

Page 1

ADVISION v 3.1
User Manual
Part Number 1950025L1
61950025L1-1B
July 2001
Page 2

Trademarks
Copyright © 2001 ADTRAN Inc. All rights reserved.
ADVISION and T-Watch Pro are trademarks of ADTRAN, Inc.
Copyright © 1992-1999 Hewlett-Packard Company. All rights reserved.
OpenView is a trademark of Hewlett-Packard Company.
Copyright © 1995-1999 by KL Group, Inc. All rights reserved.
901 Explorer Boulevard
P.O. Box 140000
Huntsville, AL 35814-4000
(256) 963-8000
© 2001 ADTRAN, Inc.
All Rights Reserved.
Printed in U.S.A.
Page 3

ADTRAN Year 2000 (Y2K) Readi n ess Dis clos ur e
ADTRAN has established a Year 2000 program to ensure that our products will correctly function in
the new millennium. ADTRAN warrants that all products meet Year 2000 specifications regardless of
model or revision. Information about ADTRAN’s Year 2000 compliance program is available at the following:
Product Matrix
E-mail
Faxback Document Line
Y2K Project Line
www.adtran.com/y2kfax.html
year2000@adtran.com
(256) 963-8200
Y2K plans and product certifications are listed in the Product Matrix
(see above).
(256) 963-2200
iii
Page 4

iv
Page 5

Table of Contents
List of Figures . . . . . . . . . . . . . . . . . . . . . . . . . . . . . . . . . . . . . . . . . . . . . . . . . . . . . . . . . . . . . . . . . . . . . . . . . . ix
List of Tables . . . . . . . . . . . . . . . . . . . . . . . . . . . . . . . . . . . . . . . . . . . . . . . . . . . . . . . . . . . . . . . . . . . . . . . . . . . xi
Chapter 1 Introduction . . . . . . . . . . . . . . . . . . . . . . . . . . . . . . . . . . . . . . . . . . . . . . . . . . . . . . . . . . . . . . 1-1
ADVISION . . . . . . . . . . . . . . . . . . . . . . . . . . . . . . . . . . . . . . . . . . . . . . . . . . . . . . . . . . . . . . . . . . . . . . . . . . . . 1-1
ADVISION GUI . . . . . . . . . . . . . . . . . . . . . . . . . . . . . . . . . . . . . . . . . . . . . . . . . . . . . . . . . . . . . . . . . . . . 1-1
ADVISION Features . . . . . . . . . . . . . . . . . . . . . . . . . . . . . . . . . . . . . . . . . . . . . . . . . . . . . . . . . . . . . . . . 1-2
HP OPENVIEW . . . . . . . . . . . . . . . . . . . . . . . . . . . . . . . . . . . . . . . . . . . . . . . . . . . . . . . . . . . . . . . . . . . . . . . . 1-2
Maps/Submaps . . . . . . . . . . . . . . . . . . . . . . . . . . . . . . . . . . . . . . . . . . . . . . . . . . . . . . . . . . . . . . . . . . . . 1-2
HP OpenView Features . . . . . . . . . . . . . . . . . . . . . . . . . . . . . . . . . . . . . . . . . . . . . . . . . . . . . . . . . . . . . 1-2
Chapter 2 Installing and Using ADVISION . . . . . . . . . . . . . . . . . . . . . . . . . . . . . . . . . . . . . . . . . . . . 2-1
Overview . . . . . . . . . . . . . . . . . . . . . . . . . . . . . . . . . . . . . . . . . . . . . . . . . . . . . . . . . . . . . . . . . . . . . . . . . . . . . 2-1
System Requirements . . . . . . . . . . . . . . . . . . . . . . . . . . . . . . . . . . . . . . . . . . . . . . . . . . . . . . . . . . . . . . . . . . . 2-1
Packing List . . . . . . . . . . . . . . . . . . . . . . . . . . . . . . . . . . . . . . . . . . . . . . . . . . . . . . . . . . . . . . . . . . . . . . . . . . . 2-1
Installing ADVISION . . . . . . . . . . . . . . . . . . . . . . . . . . . . . . . . . . . . . . . . . . . . . . . . . . . . . . . . . . . . . . . . . . . 2-1
Installation . . . . . . . . . . . . . . . . . . . . . . . . . . . . . . . . . . . . . . . . . . . . . . . . . . . . . . . . . . . . . . . . . . . . . . . . 2-2
Uninstall Process . . . . . . . . . . . . . . . . . . . . . . . . . . . . . . . . . . . . . . . . . . . . . . . . . . . . . . . . . . . . . . . . . . . 2-3
Registration . . . . . . . . . . . . . . . . . . . . . . . . . . . . . . . . . . . . . . . . . . . . . . . . . . . . . . . . . . . . . . . . . . . . . . . . . . . 2-3
Login . . . . . . . . . . . . . . . . . . . . . . . . . . . . . . . . . . . . . . . . . . . . . . . . . . . . . . . . . . . . . . . . . . . . . . . . . . . . . . . . . 2-3
Login Privilege Levels . . . . . . . . . . . . . . . . . . . . . . . . . . . . . . . . . . . . . . . . . . . . . . . . . . . . . . . . . . . . . . . 2-4
Provision . . . . . . . . . . . . . . . . . . . . . . . . . . . . . . . . . . . . . . . . . . . . . . . . . . . . . . . . . . . . . . . . . . . . . . 2-4
ReadWrite . . . . . . . . . . . . . . . . . . . . . . . . . . . . . . . . . . . . . . . . . . . . . . . . . . . . . . . . . . . . . . . . . . . . . 2-4
ReadOnly . . . . . . . . . . . . . . . . . . . . . . . . . . . . . . . . . . . . . . . . . . . . . . . . . . . . . . . . . . . . . . . . . . . . . . 2-4
None . . . . . . . . . . . . . . . . . . . . . . . . . . . . . . . . . . . . . . . . . . . . . . . . . . . . . . . . . . . . . . . . . . . . . . . . . . 2-4
Login Dialog Box . . . . . . . . . . . . . . . . . . . . . . . . . . . . . . . . . . . . . . . . . . . . . . . . . . . . . . . . . . . . . . . . . . . 2-4
Login Privilege File . . . . . . . . . . . . . . . . . . . . . . . . . . . . . . . . . . . . . . . . . . . . . . . . . . . . . . . . . . . . . . . . . 2-5
Using ADVISION . . . . . . . . . . . . . . . . . . . . . . . . . . . . . . . . . . . . . . . . . . . . . . . . . . . . . . . . . . . . . . . . . . . . . . 2-6
Using Online Help . . . . . . . . . . . . . . . . . . . . . . . . . . . . . . . . . . . . . . . . . . . . . . . . . . . . . . . . . . . . . . . . . . 2-6
Chapter 3 ADVISION Integration with HP OpenView . . . . . . . . . . . . . . . . . . . . . . . . . . . . . . . . . . 3-1
Overview . . . . . . . . . . . . . . . . . . . . . . . . . . . . . . . . . . . . . . . . . . . . . . . . . . . . . . . . . . . . . . . . . . . . . . . . . . . . . 3-1
Management Information Bases (MIBs) . . . . . . . . . . . . . . . . . . . . . . . . . . . . . . . . . . . . . . . . . . . . . . . . . . . 3-1
MIB Loading Procedure . . . . . . . . . . . . . . . . . . . . . . . . . . . . . . . . . . . . . . . . . . . . . . . . . . . . . . . . . . . . . 3-1
Discovery . . . . . . . . . . . . . . . . . . . . . . . . . . . . . . . . . . . . . . . . . . . . . . . . . . . . . . . . . . . . . . . . . . . . . . . . . . . . . 3-2
Proxied Devices . . . . . . . . . . . . . . . . . . . . . . . . . . . . . . . . . . . . . . . . . . . . . . . . . . . . . . . . . . . . . . . . . . . . 3-2
IP Auto-Discovery . . . . . . . . . . . . . . . . . . . . . . . . . . . . . . . . . . . . . . . . . . . . . . . . . . . . . . . . . . . . . . . . . . 3-2
IP Auto-Discovery: Smart 16/16e Shelf Controller . . . . . . . . . . . . . . . . . . . . . . . . . . . . . . . . . . . 3-3
IP Auto-Discovery: TSU Products . . . . . . . . . . . . . . . . . . . . . . . . . . . . . . . . . . . . . . . . . . . . . . . . . 3-3
Manual Rediscovery . . . . . . . . . . . . . . . . . . . . . . . . . . . . . . . . . . . . . . . . . . . . . . . . . . . . . . . . . . . . . . . . 3-3
Manual Rediscovery: Smart 16/16e Shelf Controller . . . . . . . . . . . . . . . . . . . . . . . . . . . . . . . . . 3-3
61950025L1-1 ADVISION User Manual v
Page 6

Table of Contents
Removing Objects . . . . . . . . . . . . . . . . . . . . . . . . . . . . . . . . . . . . . . . . . . . . . . . . . . . . . . . . . . . . . . . 3-3
Object Placement without Discovery . . . . . . . . . . . . . . . . . . . . . . . . . . . . . . . . . . . . . . . . . . . . . . . . . . . . . . 3-4
Adding IP-Addressable Objects via Loadhosts . . . . . . . . . . . . . . . . . . . . . . . . . . . . . . . . . . . . . . . . . .3-4
Manually Adding Proxied Objects . . . . . . . . . . . . . . . . . . . . . . . . . . . . . . . . . . . . . . . . . . . . . . . . . . . . .3-5
ADTRAN Status . . . . . . . . . . . . . . . . . . . . . . . . . . . . . . . . . . . . . . . . . . . . . . . . . . . . . . . . . . . . . . . . . . . . . . . .3-6
Chapter 4 Graphical User Interface (GUI) . . . . . . . . . . . . . . . . . . . . . . . . . . . . . . . . . . . . . . . . . . . . . .4-1
Overview . . . . . . . . . . . . . . . . . . . . . . . . . . . . . . . . . . . . . . . . . . . . . . . . . . . . . . . . . . . . . . . . . . . . . . . . . . . . . .4-1
Activating the GUI . . . . . . . . . . . . . . . . . . . . . . . . . . . . . . . . . . . . . . . . . . . . . . . . . . . . . . . . . . . . . . . . . . . . . .4-1
Device Viewer . . . . . . . . . . . . . . . . . . . . . . . . . . . . . . . . . . . . . . . . . . . . . . . . . . . . . . . . . . . . . . . . . . . . . . . . . .4-2
Accessing the MIB Viewer from the Device Viewer . . . . . . . . . . . . . . . . . . . . . . . . . . . . . . . . . . . . . .4-4
Menu Bar . . . . . . . . . . . . . . . . . . . . . . . . . . . . . . . . . . . . . . . . . . . . . . . . . . . . . . . . . . . . . . . . . . . . . . . . . .4-4
File . . . . . . . . . . . . . . . . . . . . . . . . . . . . . . . . . . . . . . . . . . . . . . . . . . . . . . . . . . . . . . . . . . . . . . . . . . . .4-5
View . . . . . . . . . . . . . . . . . . . . . . . . . . . . . . . . . . . . . . . . . . . . . . . . . . . . . . . . . . . . . . . . . . . . . . . . . . .4-6
Polling . . . . . . . . . . . . . . . . . . . . . . . . . . . . . . . . . . . . . . . . . . . . . . . . . . . . . . . . . . . . . . . . . . . . . . . . .4-6
Device . . . . . . . . . . . . . . . . . . . . . . . . . . . . . . . . . . . . . . . . . . . . . . . . . . . . . . . . . . . . . . . . . . . . . . . . .4-7
Modules . . . . . . . . . . . . . . . . . . . . . . . . . . . . . . . . . . . . . . . . . . . . . . . . . . . . . . . . . . . . . . . . . . . . . . . .4-7
Window . . . . . . . . . . . . . . . . . . . . . . . . . . . . . . . . . . . . . . . . . . . . . . . . . . . . . . . . . . . . . . . . . . . . . . . .4-7
Statistics Panel . . . . . . . . . . . . . . . . . . . . . . . . . . . . . . . . . . . . . . . . . . . . . . . . . . . . . . . . . . . . . . . . . . . . . .4-7
Push-button Indicators . . . . . . . . . . . . . . . . . . . . . . . . . . . . . . . . . . . . . . . . . . . . . . . . . . . . . . . . . . .4-8
PB1 . . . . . . . . . . . . . . . . . . . . . . . . . . . . . . . . . . . . . . . . . . . . . . . . . . . . . . . . . . . . . . . . . . . . . . . . . . . .4-8
PB2 . . . . . . . . . . . . . . . . . . . . . . . . . . . . . . . . . . . . . . . . . . . . . . . . . . . . . . . . . . . . . . . . . . . . . . . . . . . .4-8
PB3 . . . . . . . . . . . . . . . . . . . . . . . . . . . . . . . . . . . . . . . . . . . . . . . . . . . . . . . . . . . . . . . . . . . . . . . . . . . .4-9
PB4 . . . . . . . . . . . . . . . . . . . . . . . . . . . . . . . . . . . . . . . . . . . . . . . . . . . . . . . . . . . . . . . . . . . . . . . . . . . .4-9
Numeric Fields . . . . . . . . . . . . . . . . . . . . . . . . . . . . . . . . . . . . . . . . . . . . . . . . . . . . . . . . . . . . . . . . . . 4-9
MIB Viewer . . . . . . . . . . . . . . . . . . . . . . . . . . . . . . . . . . . . . . . . . . . . . . . . . . . . . . . . . . . . . . . . . . . . . . . . . . . 4-10
Title Bar . . . . . . . . . . . . . . . . . . . . . . . . . . . . . . . . . . . . . . . . . . . . . . . . . . . . . . . . . . . . . . . . . . . . . . . . . .4-11
Menu Bar . . . . . . . . . . . . . . . . . . . . . . . . . . . . . . . . . . . . . . . . . . . . . . . . . . . . . . . . . . . . . . . . . . . . . . . . .4-11
File . . . . . . . . . . . . . . . . . . . . . . . . . . . . . . . . . . . . . . . . . . . . . . . . . . . . . . . . . . . . . . . . . . . . . . . . . . .4-11
Polling . . . . . . . . . . . . . . . . . . . . . . . . . . . . . . . . . . . . . . . . . . . . . . . . . . . . . . . . . . . . . . . . . . . . . . . .4-13
Status . . . . . . . . . . . . . . . . . . . . . . . . . . . . . . . . . . . . . . . . . . . . . . . . . . . . . . . . . . . . . . . . . . . . . . . . .4-13
Window . . . . . . . . . . . . . . . . . . . . . . . . . . . . . . . . . . . . . . . . . . . . . . . . . . . . . . . . . . . . . . . . . . . . . . .4-13
SNMP Data Area . . . . . . . . . . . . . . . . . . . . . . . . . . . . . . . . . . . . . . . . . . . . . . . . . . . . . . . . . . . . . . . . . . . 4-13
Text Fields . . . . . . . . . . . . . . . . . . . . . . . . . . . . . . . . . . . . . . . . . . . . . . . . . . . . . . . . . . . . . . . . . . . . .4-13
Combo Boxes . . . . . . . . . . . . . . . . . . . . . . . . . . . . . . . . . . . . . . . . . . . . . . . . . . . . . . . . . . . . . . . . . . 4-13
Scales . . . . . . . . . . . . . . . . . . . . . . . . . . . . . . . . . . . . . . . . . . . . . . . . . . . . . . . . . . . . . . . . . . . . . . . . . 4-13
Push Buttons . . . . . . . . . . . . . . . . . . . . . . . . . . . . . . . . . . . . . . . . . . . . . . . . . . . . . . . . . . . . . . . . . . . 4-13
Toggle Boxes . . . . . . . . . . . . . . . . . . . . . . . . . . . . . . . . . . . . . . . . . . . . . . . . . . . . . . . . . . . . . . . . . . . 4-14
Table Index Selectors . . . . . . . . . . . . . . . . . . . . . . . . . . . . . . . . . . . . . . . . . . . . . . . . . . . . . . . . . . . . . . . 4-14
Statistics Panel . . . . . . . . . . . . . . . . . . . . . . . . . . . . . . . . . . . . . . . . . . . . . . . . . . . . . . . . . . . . . . . . . . . . .4-14
Command Buttons . . . . . . . . . . . . . . . . . . . . . . . . . . . . . . . . . . . . . . . . . . . . . . . . . . . . . . . . . . . . . . . . .4-14
Done . . . . . . . . . . . . . . . . . . . . . . . . . . . . . . . . . . . . . . . . . . . . . . . . . . . . . . . . . . . . . . . . . . . . . . . . . .4-14
Apply . . . . . . . . . . . . . . . . . . . . . . . . . . . . . . . . . . . . . . . . . . . . . . . . . . . . . . . . . . . . . . . . . . . . . . . . .4-14
Revert . . . . . . . . . . . . . . . . . . . . . . . . . . . . . . . . . . . . . . . . . . . . . . . . . . . . . . . . . . . . . . . . . . . . . . . . .4-14
Cancel . . . . . . . . . . . . . . . . . . . . . . . . . . . . . . . . . . . . . . . . . . . . . . . . . . . . . . . . . . . . . . . . . . . . . . . . 4-14
Reviewer . . . . . . . . . . . . . . . . . . . . . . . . . . . . . . . . . . . . . . . . . . . . . . . . . . . . . . . . . . . . . . . . . . . . . . . . . . . . . 4-14
Title Bar . . . . . . . . . . . . . . . . . . . . . . . . . . . . . . . . . . . . . . . . . . . . . . . . . . . . . . . . . . . . . . . . . . . . . . . . . .4-14
Menu Bar . . . . . . . . . . . . . . . . . . . . . . . . . . . . . . . . . . . . . . . . . . . . . . . . . . . . . . . . . . . . . . . . . . . . . . . . .4-15
File . . . . . . . . . . . . . . . . . . . . . . . . . . . . . . . . . . . . . . . . . . . . . . . . . . . . . . . . . . . . . . . . . . . . . . . . . . .4-15
Page . . . . . . . . . . . . . . . . . . . . . . . . . . . . . . . . . . . . . . . . . . . . . . . . . . . . . . . . . . . . . . . . . . . . . . . . . .4-15
Window . . . . . . . . . . . . . . . . . . . . . . . . . . . . . . . . . . . . . . . . . . . . . . . . . . . . . . . . . . . . . . . . . . . . . . .4-15
SNMP Data Area . . . . . . . . . . . . . . . . . . . . . . . . . . . . . . . . . . . . . . . . . . . . . . . . . . . . . . . . . . . . . . . . . . . 4-16
Text Fields . . . . . . . . . . . . . . . . . . . . . . . . . . . . . . . . . . . . . . . . . . . . . . . . . . . . . . . . . . . . . . . . . . . . .4-16
vi ADVISION User Manual 61950025L1-1
Page 7

Table of Contents
Combo Boxes . . . . . . . . . . . . . . . . . . . . . . . . . . . . . . . . . . . . . . . . . . . . . . . . . . . . . . . . . . . . . . . . . . 4-16
Scales . . . . . . . . . . . . . . . . . . . . . . . . . . . . . . . . . . . . . . . . . . . . . . . . . . . . . . . . . . . . . . . . . . . . . . . . 4-16
Push Buttons . . . . . . . . . . . . . . . . . . . . . . . . . . . . . . . . . . . . . . . . . . . . . . . . . . . . . . . . . . . . . . . . . . 4-16
Toggle Boxes . . . . . . . . . . . . . . . . . . . . . . . . . . . . . . . . . . . . . . . . . . . . . . . . . . . . . . . . . . . . . . . . . . 4-16
Table Index Selectors . . . . . . . . . . . . . . . . . . . . . . . . . . . . . . . . . . . . . . . . . . . . . . . . . . . . . . . . . . . . . . . 4-16
Graph Viewer . . . . . . . . . . . . . . . . . . . . . . . . . . . . . . . . . . . . . . . . . . . . . . . . . . . . . . . . . . . . . . . . . . . . . . . . 4-16
Title Bar . . . . . . . . . . . . . . . . . . . . . . . . . . . . . . . . . . . . . . . . . . . . . . . . . . . . . . . . . . . . . . . . . . . . . . . . . . 4-17
Menu Bar . . . . . . . . . . . . . . . . . . . . . . . . . . . . . . . . . . . . . . . . . . . . . . . . . . . . . . . . . . . . . . . . . . . . . . . . . 4-17
File . . . . . . . . . . . . . . . . . . . . . . . . . . . . . . . . . . . . . . . . . . . . . . . . . . . . . . . . . . . . . . . . . . . . . . . . . . . 4-18
Polling . . . . . . . . . . . . . . . . . . . . . . . . . . . . . . . . . . . . . . . . . . . . . . . . . . . . . . . . . . . . . . . . . . . . . . . 4-18
Window . . . . . . . . . . . . . . . . . . . . . . . . . . . . . . . . . . . . . . . . . . . . . . . . . . . . . . . . . . . . . . . . . . . . . . 4-18
Variable Selection Dialog . . . . . . . . . . . . . . . . . . . . . . . . . . . . . . . . . . . . . . . . . . . . . . . . . . . . . . . . . . . 4-18
Graph Data Area . . . . . . . . . . . . . . . . . . . . . . . . . . . . . . . . . . . . . . . . . . . . . . . . . . . . . . . . . . . . . . . . . . 4-19
Progress Dialog . . . . . . . . . . . . . . . . . . . . . . . . . . . . . . . . . . . . . . . . . . . . . . . . . . . . . . . . . . . . . . . . 4-19
Scales . . . . . . . . . . . . . . . . . . . . . . . . . . . . . . . . . . . . . . . . . . . . . . . . . . . . . . . . . . . . . . . . . . . . . . . . 4-19
Axes Labels . . . . . . . . . . . . . . . . . . . . . . . . . . . . . . . . . . . . . . . . . . . . . . . . . . . . . . . . . . . . . . . . . . . 4-19
Data Labels . . . . . . . . . . . . . . . . . . . . . . . . . . . . . . . . . . . . . . . . . . . . . . . . . . . . . . . . . . . . . . . . . . . 4-20
Window Resize . . . . . . . . . . . . . . . . . . . . . . . . . . . . . . . . . . . . . . . . . . . . . . . . . . . . . . . . . . . . . . . . 4-20
Resizing/Scaling . . . . . . . . . . . . . . . . . . . . . . . . . . . . . . . . . . . . . . . . . . . . . . . . . . . . . . . . . . . . . . . 4-20
Translation . . . . . . . . . . . . . . . . . . . . . . . . . . . . . . . . . . . . . . . . . . . . . . . . . . . . . . . . . . . . . . . . . . . . 4-20
Zooming . . . . . . . . . . . . . . . . . . . . . . . . . . . . . . . . . . . . . . . . . . . . . . . . . . . . . . . . . . . . . . . . . . . . . . 4-20
Return to Default . . . . . . . . . . . . . . . . . . . . . . . . . . . . . . . . . . . . . . . . . . . . . . . . . . . . . . . . . . . . . . 4-20
Error Dialogs . . . . . . . . . . . . . . . . . . . . . . . . . . . . . . . . . . . . . . . . . . . . . . . . . . . . . . . . . . . . . . . . . . 4-20
Table Viewer . . . . . . . . . . . . . . . . . . . . . . . . . . . . . . . . . . . . . . . . . . . . . . . . . . . . . . . . . . . . . . . . . . . . . . . . . 4-21
Title Bar . . . . . . . . . . . . . . . . . . . . . . . . . . . . . . . . . . . . . . . . . . . . . . . . . . . . . . . . . . . . . . . . . . . . . . . . . . 4-21
Menu Bar . . . . . . . . . . . . . . . . . . . . . . . . . . . . . . . . . . . . . . . . . . . . . . . . . . . . . . . . . . . . . . . . . . . . . . . . . 4-21
File . . . . . . . . . . . . . . . . . . . . . . . . . . . . . . . . . . . . . . . . . . . . . . . . . . . . . . . . . . . . . . . . . . . . . . . . . . . 4-22
Polling . . . . . . . . . . . . . . . . . . . . . . . . . . . . . . . . . . . . . . . . . . . . . . . . . . . . . . . . . . . . . . . . . . . . . . . 4-23
Window . . . . . . . . . . . . . . . . . . . . . . . . . . . . . . . . . . . . . . . . . . . . . . . . . . . . . . . . . . . . . . . . . . . . . . 4-23
Variable Selection Dialog . . . . . . . . . . . . . . . . . . . . . . . . . . . . . . . . . . . . . . . . . . . . . . . . . . . . . . . . . . . 4-23
Table Data Area . . . . . . . . . . . . . . . . . . . . . . . . . . . . . . . . . . . . . . . . . . . . . . . . . . . . . . . . . . . . . . . . . . . 4-23
Progress Dialog . . . . . . . . . . . . . . . . . . . . . . . . . . . . . . . . . . . . . . . . . . . . . . . . . . . . . . . . . . . . . . . . 4-23
Labels . . . . . . . . . . . . . . . . . . . . . . . . . . . . . . . . . . . . . . . . . . . . . . . . . . . . . . . . . . . . . . . . . . . . . . . . 4-23
Window Resize . . . . . . . . . . . . . . . . . . . . . . . . . . . . . . . . . . . . . . . . . . . . . . . . . . . . . . . . . . . . . . . . 4-24
Row/Column Resize . . . . . . . . . . . . . . . . . . . . . . . . . . . . . . . . . . . . . . . . . . . . . . . . . . . . . . . . . . . 4-24
Error Dialogs . . . . . . . . . . . . . . . . . . . . . . . . . . . . . . . . . . . . . . . . . . . . . . . . . . . . . . . . . . . . . . . . . . 4-24
Chapter 5 Device-Specific Information . . . . . . . . . . . . . . . . . . . . . . . . . . . . . . . . . . . . . . . . . . . . . . . . 5-1
Overview . . . . . . . . . . . . . . . . . . . . . . . . . . . . . . . . . . . . . . . . . . . . . . . . . . . . . . . . . . . . . . . . . . . . . . . . . . . . . 5-1
Supported Devices . . . . . . . . . . . . . . . . . . . . . . . . . . . . . . . . . . . . . . . . . . . . . . . . . . . . . . . . . . . . . . . . . . . . . 5-1
System Information . . . . . . . . . . . . . . . . . . . . . . . . . . . . . . . . . . . . . . . . . . . . . . . . . . . . . . . . . . . . . . . . . . . . 5-1
IQ Units Prior to v 3.22 . . . . . . . . . . . . . . . . . . . . . . . . . . . . . . . . . . . . . . . . . . . . . . . . . . . . . . . . . . . . . . . . . . 5-1
IQ Units Later than v 3.22 . . . . . . . . . . . . . . . . . . . . . . . . . . . . . . . . . . . . . . . . . . . . . . . . . . . . . . . . . . . . . . . 5-2
Get Error Dialog Box . . . . . . . . . . . . . . . . . . . . . . . . . . . . . . . . . . . . . . . . . . . . . . . . . . . . . . . . . . . . . . . . 5-2
Specifying a New PVC . . . . . . . . . . . . . . . . . . . . . . . . . . . . . . . . . . . . . . . . . . . . . . . . . . . . . . . . . . . . . . 5-2
IP Host Table . . . . . . . . . . . . . . . . . . . . . . . . . . . . . . . . . . . . . . . . . . . . . . . . . . . . . . . . . . . . . . . . . . . . . . 5-2
FramePort 144 & 768 . . . . . . . . . . . . . . . . . . . . . . . . . . . . . . . . . . . . . . . . . . . . . . . . . . . . . . . . . . . . . . . . . . . . 5-2
Smart 16/16e Shelf . . . . . . . . . . . . . . . . . . . . . . . . . . . . . . . . . . . . . . . . . . . . . . . . . . . . . . . . . . . . . . . . . . . . . 5-3
DSU III DBU . . . . . . . . . . . . . . . . . . . . . . . . . . . . . . . . . . . . . . . . . . . . . . . . . . . . . . . . . . . . . . . . . . . . . . . . . . 5-3
Removing a Device Card . . . . . . . . . . . . . . . . . . . . . . . . . . . . . . . . . . . . . . . . . . . . . . . . . . . . . . . . . . . . 5-3
SNMP I/O Timeout Errors . . . . . . . . . . . . . . . . . . . . . . . . . . . . . . . . . . . . . . . . . . . . . . . . . . . . . . . . . . . 5-3
T3SU 300 . . . . . . . . . . . . . . . . . . . . . . . . . . . . . . . . . . . . . . . . . . . . . . . . . . . . . . . . . . . . . . . . . . . . . . . . . . . . . . 5-4
TSU 100, 120,
61950025L1-1 ADVISION User Manual vii
Page 8

Table of Contents
& 600 . . . . . . . . . . . . . . . . . . . . . . . . . . . . . . . . . . . . . . . . . . . . . . . . . . . . . . . . . . . . . . . . . . . . . . . . . . . . . . . . . .5-4
TSU 100e, 120e, & 600e . . . . . . . . . . . . . . . . . . . . . . . . . . . . . . . . . . . . . . . . . . . . . . . . . . . . . . . . . . . . . . . . . .5-4
TSU Mux Limitations . . . . . . . . . . . . . . . . . . . . . . . . . . . . . . . . . . . . . . . . . . . . . . . . . . . . . . . . . . . . . . . .5-5
Naming Conventions . . . . . . . . . . . . . . . . . . . . . . . . . . . . . . . . . . . . . . . . . . . . . . . . . . . . . . . . . . . . . . . . . . . .5-5
SNMP I/O Timeout Errors . . . . . . . . . . . . . . . . . . . . . . . . . . . . . . . . . . . . . . . . . . . . . . . . . . . . . . . . . . . . . . .5-5
TSU Mux Option Cards . . . . . . . . . . . . . . . . . . . . . . . . . . . . . . . . . . . . . . . . . . . . . . . . . . . . . . . . . . . . . . . . . .5-6
Chapter 6 ADVISION Setup Parameters . . . . . . . . . . . . . . . . . . . . . . . . . . . . . . . . . . . . . . . . . . . . . . .6-1
Overview . . . . . . . . . . . . . . . . . . . . . . . . . . . . . . . . . . . . . . . . . . . . . . . . . . . . . . . . . . . . . . . . . . . . . . . . . . . . . .6-1
Preferences Files . . . . . . . . . . . . . . . . . . . . . . . . . . . . . . . . . . . . . . . . . . . . . . . . . . . . . . . . . . . . . . . . . . . . . . . .6-1
File Entries . . . . . . . . . . . . . . . . . . . . . . . . . . . . . . . . . . . . . . . . . . . . . . . . . . . . . . . . . . . . . . . . . . . . . . . . . 6-1
Environment Variables . . . . . . . . . . . . . . . . . . . . . . . . . . . . . . . . . . . . . . . . . . . . . . . . . . . . . . . . . . . . . . . . . .6-2
Command Line Options . . . . . . . . . . . . . . . . . . . . . . . . . . . . . . . . . . . . . . . . . . . . . . . . . . . . . . . . . . . . . . . . . 6-3
Database Server (advdb) . . . . . . . . . . . . . . . . . . . . . . . . . . . . . . . . . . . . . . . . . . . . . . . . . . . . . . . . . . . . .6-3
Changing the Number of Supported Objects . . . . . . . . . . . . . . . . . . . . . . . . . . . . . . . . . . . . . . . .6-3
Appendix A Acronyms . . . . . . . . . . . . . . . . . . . . . . . . . . . . . . . . . . . . . . . . . . . . . . . . . . . . . . . . . . . . . . . . A-1
Appendix B Glossary . . . . . . . . . . . . . . . . . . . . . . . . . . . . . . . . . . . . . . . . . . . . . . . . . . . . . . . . . . . . . . . . . B-1
Appendix C Installation Files . . . . . . . . . . . . . . . . . . . . . . . . . . . . . . . . . . . . . . . . . . . . . . . . . . . . . . . . . . C-1
Index . . . . . . . . . . . . . . . . . . . . . . . . . . . . . . . . . . . . . . . . . . . . . . . . . . . . . . . . . . . . . . . . . . . . . . . . . . . . . . . . . . 1
viii ADVISION User Manual 61950025L1-1
Page 9

List of Figures
Figure 1-1. Front and Rear Graphical Representations of a TSU 100e . . . . . . . . . . . . . . . . . . . . . . . . 1-1
Figure 1-2. HP OpenView Submap Showing Different ADTRAN-Specific Symbols . . . . . . . . . . . 1-2
Figure 2-1. Login Dialog Box . . . . . . . . . . . . . . . . . . . . . . . . . . . . . . . . . . . . . . . . . . . . . . . . . . . . . . . . . . 2-4
Figure 3-1. ADVISION Communicating with a Proxied Device . . . . . . . . . . . . . . . . . . . . . . . . . . . . 3-2
Figure 4-1. ADVISION Opening Window . . . . . . . . . . . . . . . . . . . . . . . . . . . . . . . . . . . . . . . . . . . . . . . 4-2
Figure 4-2. Two Views of the Device Viewer . . . . . . . . . . . . . . . . . . . . . . . . . . . . . . . . . . . . . . . . . . . . 4-3
Figure 4-3. Menu Tree for the Device Viewer Menu Bar . . . . . . . . . . . . . . . . . . . . . . . . . . . . . . . . . . . 4-4
Figure 4-4. Statistics Panel . . . . . . . . . . . . . . . . . . . . . . . . . . . . . . . . . . . . . . . . . . . . . . . . . . . . . . . . . . . . 4-8
Figure 4-5. MIB Viewer . . . . . . . . . . . . . . . . . . . . . . . . . . . . . . . . . . . . . . . . . . . . . . . . . . . . . . . . . . . . . . 4-11
Figure 4-6. Menu Tree for the MIB Viewer Menu Bar . . . . . . . . . . . . . . . . . . . . . . . . . . . . . . . . . . . . 4-12
Figure 4-7. Menu Tree for the Reviewer Menu Bar . . . . . . . . . . . . . . . . . . . . . . . . . . . . . . . . . . . . . . 4-15
Figure 4-8. Graph Viewer . . . . . . . . . . . . . . . . . . . . . . . . . . . . . . . . . . . . . . . . . . . . . . . . . . . . . . . . . . . . 4-17
Figure 4-9. Menu Tree for the Graph Viewer Menu Bar . . . . . . . . . . . . . . . . . . . . . . . . . . . . . . . . . . 4-17
Figure 4-10. Variable Selection Dialog Box . . . . . . . . . . . . . . . . . . . . . . . . . . . . . . . . . . . . . . . . . . . . . . 4-19
Figure 4-11. Menu Tree for the Table Viewer Menu Bar . . . . . . . . . . . . . . . . . . . . . . . . . . . . . . . . . . . 4-21
Figure 4-12. Table Viewer . . . . . . . . . . . . . . . . . . . . . . . . . . . . . . . . . . . . . . . . . . . . . . . . . . . . . . . . . . . . . 4-22
61950025L1-1 ADVISION User Manual ix
Page 10

List of Figures
x ADVISION User Manual 61950025L1-1
Page 11

List of Tables
Table 1-1. Color Definitions for Device Status . . . . . . . . . . . . . . . . . . . . . . . . . . . . . . . . . . . . . . . . . . . . . 1-3
Table 6-1. Preferences File Entry Definitions . . . . . . . . . . . . . . . . . . . . . . . . . . . . . . . . . . . . . . . . . . . . . . 6-2
Table 6-2. Environmental Variables. . . . . . . . . . . . . . . . . . . . . . . . . . . . . . . . . . . . . . . . . . . . . . . . . . . . . . 6-2
Table 6-3. Command Line Options . . . . . . . . . . . . . . . . . . . . . . . . . . . . . . . . . . . . . . . . . . . . . . . . . . . . . . 6-3
61950025L1-1 ADVISION User Manual xi
Page 12

List of Tables
xii ADVISION User Manual 61950025L1-1
Page 13
Chapter 1
Introduction
ADVISION
ADVISION GUI
ADTRAN’s ADVISION™ is a comprehensive network management
application that provides the tools necessary to control, configure, and monitor
ADTRAN data communication products that can be managed using Simple
Network Management Protocol (SNMP). Integration into Hewlett-Packard’s
(HP) OpenView™ Network Node Manager for UNIX™ platform ensures
compatibility with industry standards and eliminates the need for proprietary
management systems. With ADVISION, a single management station controls
and configures networks that include DDS, Switched 56, ISDN, Frame Relay,
and T1. In addition, ADVISION limits use of the system resources on the
management platform to those needed during active management.
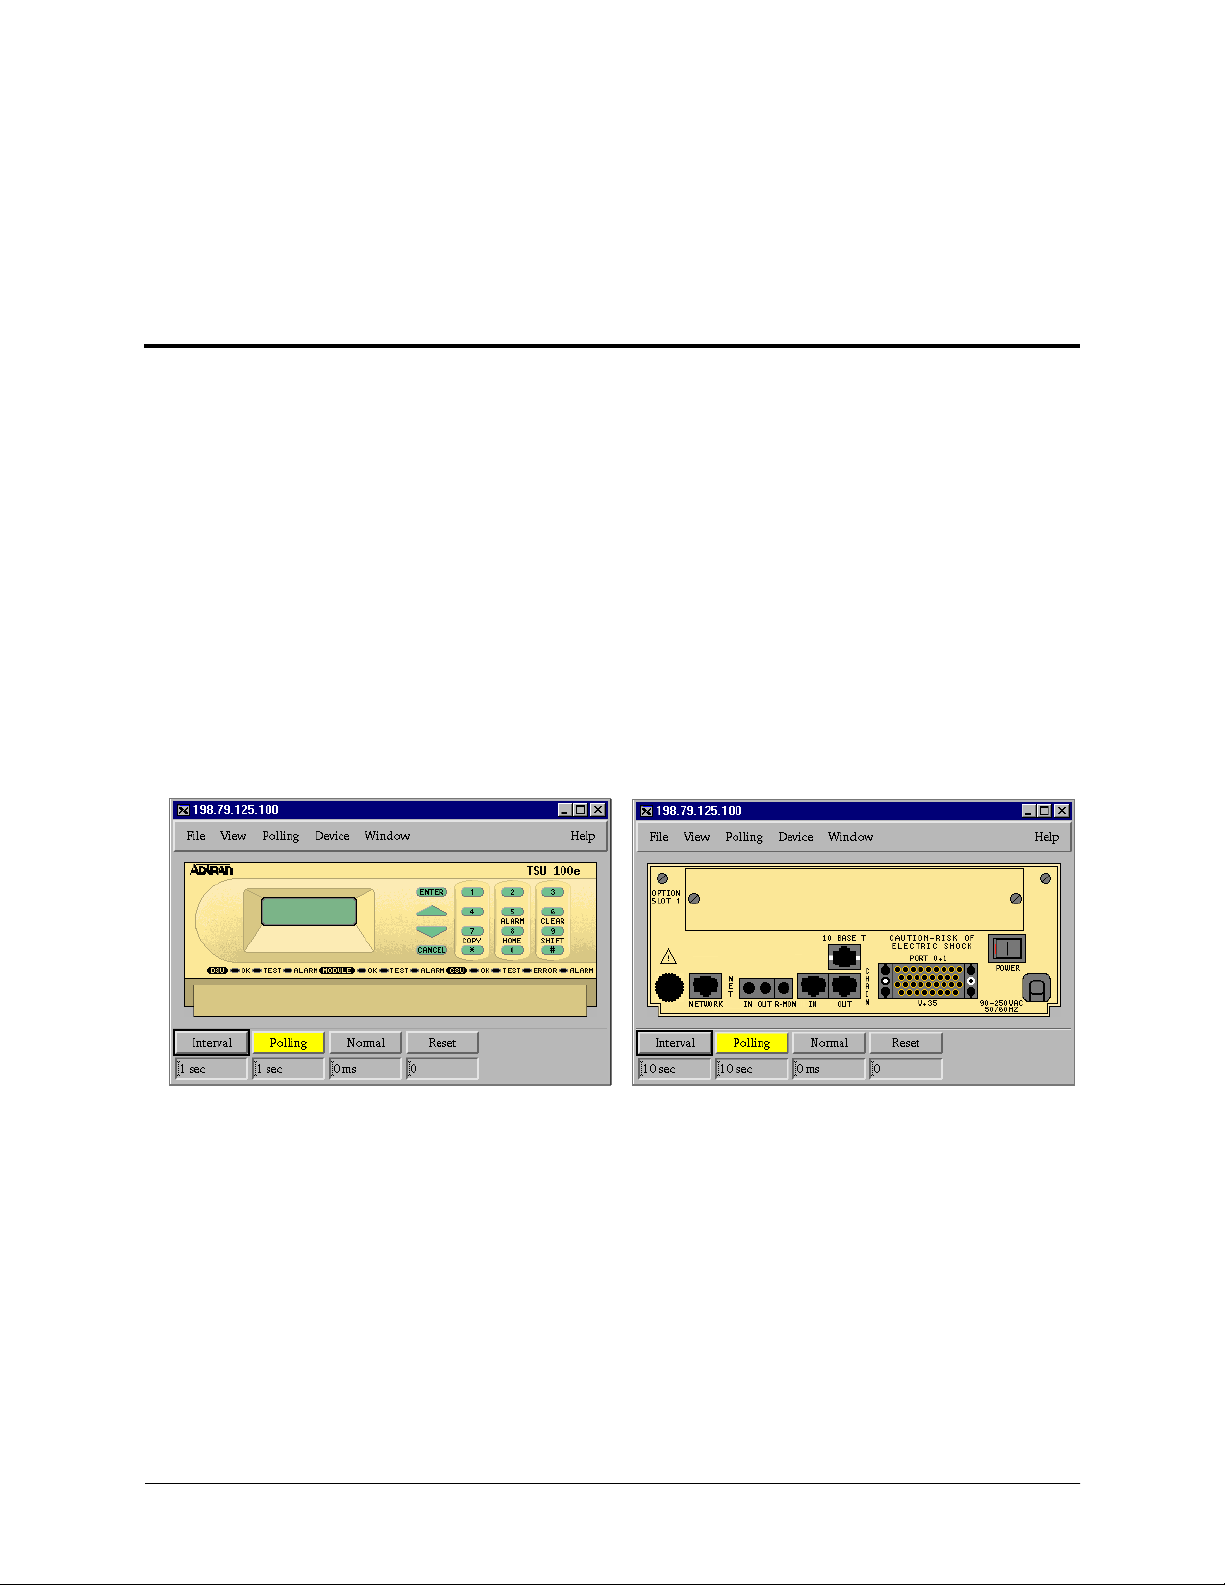
ADVISION’s device-specific graphical user interface (GUI) displays animated
graphical representations of devices, both front and rear views (see Figure 1-1),
to assist with field installations or diagnostics.
Figure 1-1. Front and Rear Graphical Representations of a TSU 100e
Activating the application GUI requires a simple point-and-click of a mouse.
Once activated, a network manager has complete access to all features supported
by the ADTRAN SNMP devices. The GUI contains device-specific symbols on
the submaps, displays animated product images that reflect device options and
indicators, and provides a set of product-specific dialogs boxes for monitoring,
configuring, and testing ADTRAN SNMP devices.
61950025L1-1 ADVISION User Manual 1-1
Page 14
Chapter 1. Introduction
ADVISION also provides Management Information Bases (MIBs) to use
with the HP OpenView MIB Browser and Event Browser. Included MIB trap
definitions describe formatting for device-specific alarms and events.
ADVISION
Features
HP OPENVIEW
Maps/Submaps
A summary of ADVISION’s features follows:
• Easy-to-use SNMP application with graphical user interface (GUI)
• Integration into HP OpenView’s UNIX platform (see Chapter 3)
• Automatic device discovery
• Comprehensive trap and alarm processing
• Color-coded, device-specific symbols indicate network status
• View, modify, save, and apply device configuration
• Complete diagnostic control
• Detailed status information
• Performance graphs
• Online help
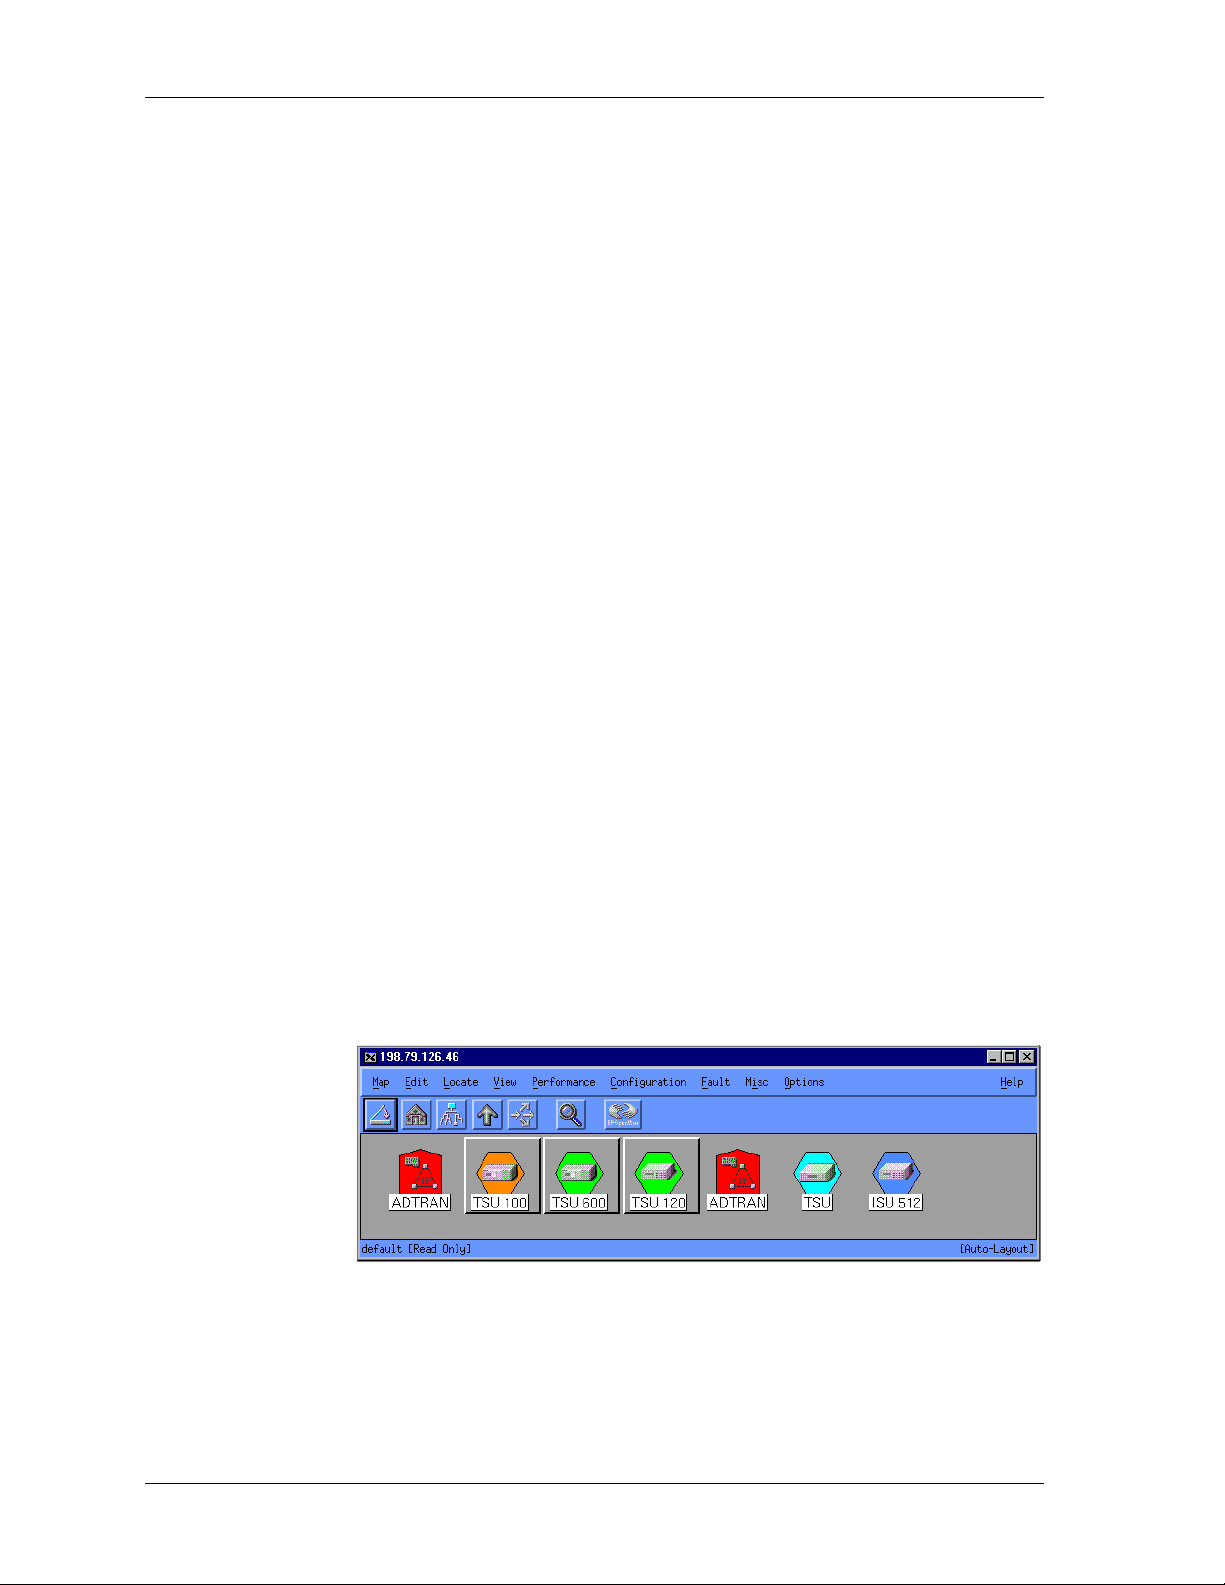
By coupling ADVISION with HP OpenView, OpenView’s maps become
more informative.
A map contains related objects, symbols, and submaps that provide a graphical and hierarchical representation of a network. Submaps can contain additional submaps (child submaps), child submaps can have additional
submaps, and so on. While you can create multiple maps, you may only
view one map at a time.
HP OpenView
Features
Figure 1-2. HP OpenView Submap Showing Different ADTRAN-Specific Symbols
HP OpenView provides the following features:
• Symbols to place on submaps. ADVISION allows OpenView to auto-
matically discover ADTRAN devices and place them into the appropriate OpenView submap using ADTRAN-specific symbols, instead of
generic symbols (see Figure 1-2).
• Auto-discovery of ADTRAN devices, customized to display installed
options. You can also manually add SNMP-proxied ADTRAN devices
to these maps.
1-2 ADVISION User Manual 61950025L1-1
Page 15

Chapter 1. Introduction
• Visual indication of ADTRAN device status derived from traps and
polling, propagated and integrated with HP OpenView IP status
throughout the map. ADVISION interprets traps received by Open-
View, and sets the color of the corresponding symbol to the severity level color of any error condition, allowing a network manager to quickly
determine the status of a particular device (see Table 1-1).
• Ability to launch the ADVISION GUI by clicking on the appropriate
ADTRAN symbol from the HP OpenView submap.
Table 1-1. Color Definitions for Device Status
Color Meaning
Cyan Warning
Red Critical
Orange Major
Yellow Min or
Green Normal
Blue Unknown device
61950025L1-1 ADVISION User Manual 1-3
Page 16

Chapter 1. Introduction
1-4 ADVISION User Manual 61950025L1-1
Page 17

Chapter 2
Installing and Using ADVISION
OVERVIEW
SYSTEM
REQUIREMENTS
PACKING LIST
This chapter provides information on installing ADVISION (including system
requirements and the packing list) and using ADVISION (including security information). In addition, this chapter discusses the registration process.
To run ADVISION, your system must meet the following requirements:
• HP 9000 UNIX workstation with HP-UX 10.20 or 11, SUN workstation (Super Sparc or later) with Solaris 2.5.1, 2.6 or 2.7
• HP OpenView Network Node Manager 4.11, 5.X or 6.X
• 256 pseudo-color display
•CD-ROM drive
• 10 megabytes (MB) memory per GUI session
• 40 MB free disk space
The ADVISION package contains the following items:
• ADVISION installation CD
• ADVISION Quick Start Guide/Software License Agreement
• ADVISION User Manual (included in PDF format on the CD)
If something is missing from your shipment, contact ADTRAN Technical Support (see inside the back cover).
INSTALLING
ADVISION
61950025L1-1 ADVISION User Manual 2-1
The installation program does the following during the installation procedure:
• Transfers all files into the installation directory tree
• Links ADVISION files to the appropriate HP OpenView directories
• Registers the ADVISION database server with HP OpenView for start-up
via ovstart
• Registers other ADVISION fields and applications
•Updates /etc/server to define the ADVISION database server socket ad-
dress as 7966
The ADVISION installation program requires that all HP OpenView environment variables be defined.
Page 18

Chapter 2. Installing and Using ADVISION
If you are reinstalling ADVISION, run $OV_BIN/ovstop
advdb before proceeding with the installation.
Installation
To install ADVISION, follow these steps:
UNIX Installation Procedure
Step Action
1
2
3
4
Log in as
Mount the CD-ROM, specifying the appropriate device
filename and mount directory. For example,
/usr/sbin/mount /dev/dsk/c0t2d0/cdrom
Change the directory to the mounted CD-ROM directory.
Execute the following:
a
b
c
Enter the ADVISION installation directory (
root
.
./INSTALL_CD.SH
Enter the path to the
directory).
Confirm the target Operating System for the installation
(default is determined via
is assumed).
tar
file depot (CD-ROM mount
uname
).
/opt/advision
If the ADVISION installation directory already exists, the
system issues an installation error. Disregard the error and
continue the installation.
5
6
Define the ADVISION environment variable
ADVISION_INSTALL
a
If running sh or ksh, add the following to your login script
.profile
(
. /opt/advision/bin/adv.envvars.sh
b
If running csh, add the following to your csh resource file
.cshrc
(
source /opt/advision/bin/adv.envvars.csh
If you have selected another location for the ADVISION
installation directory, modify this script to reflect your
installation directory.
To start the ADVISION database server, execute the following:
$OV_BIN/ovstart advdb
or
):
, as follows:
.login
):
2-2 ADVISION User Manual 61950025L1-1
Page 19

Chapter 2. Installing and Using ADVISION
Uninstall
Process
UNIX Installation Procedure
Step Action
7
8
To remove the ADVISION installation, as root and with OV environment
variables defined, execute the following from the command line:
/opt/advision/UNINSTALL.SH
Installation is now complete. Dismount the CD-ROM and log
root.
off as
Execute
advdisc
To view formatted traps in HP OpenView, load MIBS for ADTRAN
devices into HP OpenView. Device MIBs are located in the following
directory:
/var/opt/OV/share/snmp_mibs/Vendor/Adtran
ovw
to start the ADVISION processes
.
(Continued)
advstat
and
REGISTRATION
LOGIN
Registration defines ADVISION processes to OpenView. This definition
occurs on installation. Registration involves four processes.
1. The first process involves the ADVISION database server. One copy of
this database server runs per HP OpenView installation. The database
server starts when HP OpenView starts.
The following three processes start with each window session of HP
OpenView.
2. ADVISION Discover
3. ADVISION Status (maintains ADTRAN objects’ map color status)
4. ADVISION GUI
The four process names follow:
1. database - advdb
2. discover - advdisc
3. status - advstat
4. GUI - advision
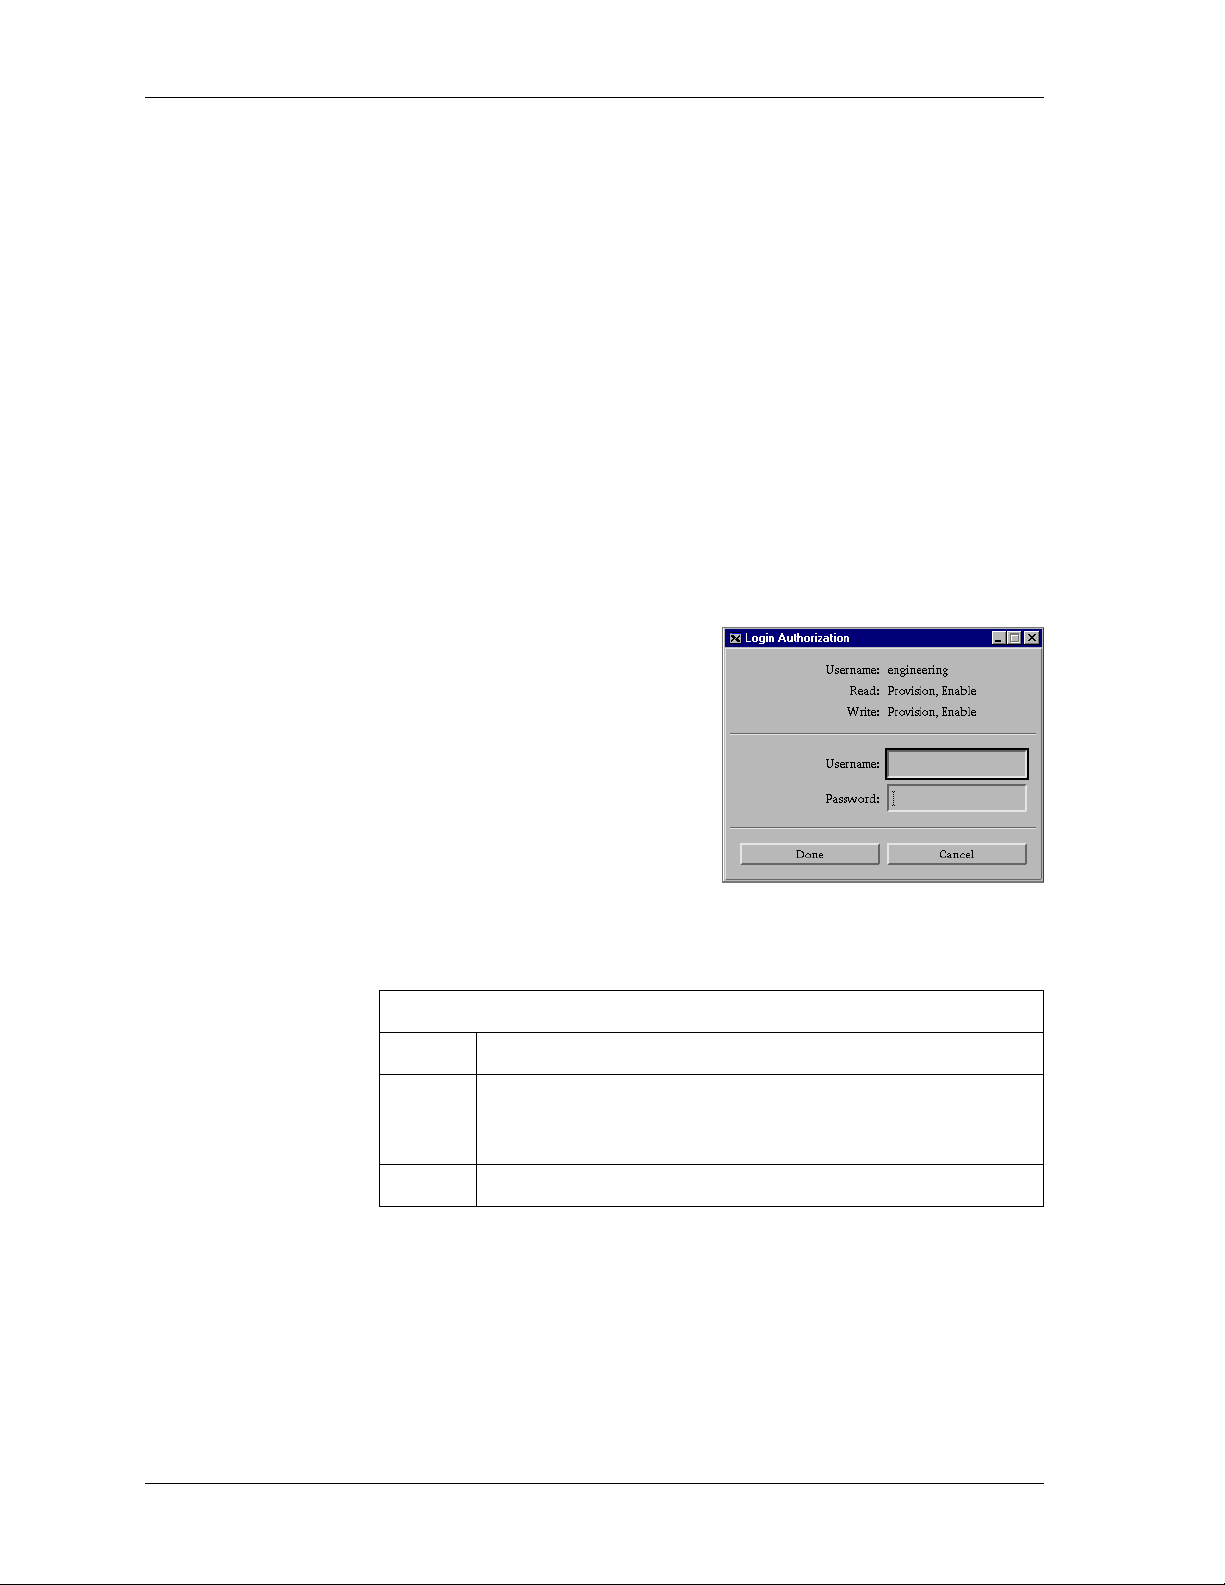
The login security feature allows you to control user access to ADVISION.
Once activated, the current user name and privileges are displayed in the Login dialog box, followed by the data entry region.
61950025L1-1 ADVISION User Manual 2-3
Page 20
Chapter 2. Installing and Using ADVISION
Login Privileg e
Levels
Provision
ReadWrite
ReadOnly
None
Login Dialog
Box
The four privilege (security) levels include Provision, ReadWrite, ReadOnly,
and None.
Provides complete ReadWrite capabilities, plus the ability to make provisioning changes for ADTRAN Carrier products.
Allows users to view current status, configuration, and provisioning data for
all devices, to modify configuration parameters for ADTRAN Enterprise
products, and to initiate tests on all devices.
Allows users to view current status, configuration, and provisioning data for
all devices.
User has no access to ADVISION.
The Login dialog box is the interface used to login to ADVISION (see
Figure 2-1).
Figure 2-1. Login Dialog Box
Instructions for Activating the Login Dialog Box
Step Action
Ensure that you are in the
1
2
administrator has activated ADVISION’s security feature. (If
this option is grayed out, it has not been activated yet.)
From the
File
menu, select
Device Viewer
Login
and that the network
.
2-4 ADVISION User Manual 61950025L1-1
Page 21
Chapter 2. Installing and Using ADVISION
Instructions for Changing User Accounts using the Login Dialog Box
Step Action
Login Privileg e
File
Open the
1
on page 2-4).
Enter the user name and password, and then click
2
(Standard system login names and passwords are defined in
/etc/passwd
The privilege (permission) levels are defined in the following authorization
file: ${ADVISION_INSTALL}/auth
If this file is not present on a system, all users are granted Provision privileges. If the file is present, users not included in the file are denied access to
ADVISION. Entries in the file have the following format:
<username> <Provision|ReadWrite|ReadOnly|None>
User names and passwords must be defined for standard login on the UNIX
system (see the following sample file):
#
# Sample ${ADVISION_INSTALL}/auth file
#
# Username Permissions
# --------- ----------
john None
paul ReadOnly
george ReadWrite
ringo Provision
Login
dialog box (see the previous Step/Action table
.)
Done
.
Comment lines begin with pound signs (#) in the first column.
Using this file, the site administrator grants or denies access privileges on a
per-user basis. When installed, the authorization file should have Read permission for all users and Write permission for the administrator’s account.
61950025L1-1 ADVISION User Manual 2-5
Page 22

Chapter 2. Installing and Using ADVISION
USING
ADVISION
To start the ADVISION GUI, select one of the following three methods:
1. From the OpenView map, single-click the left mouse button on any
ADTRAN object and select the following from the pull-down menu
on the menu bar:
Tools > ADVISION Manager > ADVISION
OR
2. From the OpenView map, single-click the right mouse button on any
ADTRAN object and select
OR
3. From the OpenView map, double-click the left mouse button on any
executable ADTRAN object. (Executable objects have a raised, button-like appearance.)
While loading, the ADVISION loading-status window displays. Once ADVISION successfully loads, the loading-status window automatically closes,
and a device-specific window opens to provide complete access to all features supported by the ADTRAN SNMP devices.
ADVISION
from the pop-up menu.
Using Online
Help
ADVISION help is delivered online as a subset of the HP OpenView help
system. Access the file from within the ADVISION GUI by selecting and executing an ADTRAN device, and then clicking on the
also access the ADVISION help system by selecting
OpenView Help menu. Choose
copy of the help information.
Print
from Help’s
Help
button. You can
ADVISION
File
menu to print a hard
from the HP
2-6 ADVISION User Manual 61950025L1-1
Page 23

Chapter 3
ADVISION Integration with
HP OpenView
OVERVIEW
MANAGEMENT
INFORMATION
BASES (MIBS)
MIB Loading
Procedure
When integrated with HP OpenView, ADVISION becomes a comprehensive
network management application. ADTRAN provides MIBs containing
definitions of management information used to remotely monitor, configure,
and control networked devices. ADVISION allows OpenView to automatically
discover ADTRAN devices and place them into the appropriate submap using
an ADTRAN-specific symbol (see Figure 1-2 on page 1-2). ADVISION also
allows you to manually discover devices and add them to a submap. In addition,
OpenView provides device-status based on received traps or polled status
information. This chapter discusses MIBs, discovery methods, and ADTRAN
status.
ADTRAN-provided MIBs provide the following information and functions:
• Definitions needed to format traps with descriptions and interpretation of
status variables contained in the trap messages. These embedded definitions
can be passed to HP OpenView during the MIB loading process to automatically build the trap configuration database entries. This process eliminates
the need for manual trap definition in HP OpenView version 4.x and later.
• Ability to use the OpenView MIB Browser to examine and alter SNMP data
in ADTRAN devices.
Follow the instructions in the ensuing Step/Action table to load the ADTRAN
MIBs:
Instructions for Loading ADTRAN-provided MIBs
Step Action
1
Start HP OpenView.
From the HP OpenView menu bar, select the following:
2
Options > Load > Unload MIBS: SNMP
From the
3
button.
61950025L1-1 ADVISION User Manual 3-1
Load/Unload MIBS
dialog box, click on the
Load
Page 24

Chapter 3. ADVISION Integration with HP OpenView
DISCOVERY
Instructions for Loading ADTRAN-provided MIBs
Step Action
adtran.mib, ads1.mib
Load
4
all device MIBs applicable to your setup. (ADTRAN MIBs are
located under
5
6
Discovery is the process by which devices (objects) are added to the HP
OpenView submap. This process occurs either through IP Auto-Discovery
(below) or Manual Rediscovery (see page 3-3). In both cases, an entry for the
device is added into HP OpenView’s SNMP configuration database, and
onto a specific map.
OK
Click
When asked if you want to load the
OK
The system notifies you that the load was successful.
.
The Technical Support section of the ADTRAN website provides a
complete list of the MIBs required to support each ADTRAN device.
Vendor/Adtran
The message “MIB Successfully Loaded” appears.
.
(for T1 product support), and
.)
TRAP-TYPE
(Continued)
macro, click
Proxied Devices
IP Auto-Discovery
ADVISION can also communicate by proxy, via SNMP, with a device that
can’t directly communicate with ADVISION. Figure 3-1 illustrates this
process.
ADVISION
SNMP
ADTRAN
Proxy Device
Figure 3-1. ADVISION Communicating with a Proxied Device
HP OpenView automatically discovers IP-addressable devices and places
them on the submap as part of its normal auto-discovery process.
ADVISION’s auto-discovery process recognizes which option cards are
installed in these devices and places these cards on the child submap.
Through the process of auto-discovery, ADVISION automatically creates a
second executable symbol for the object on the device's child submap. The
new symbol’s device status is set to “Status” indicating that the device's
Proprietary
Proxied Device
3-2 ADVISION User Manual 61950025L1-1
Page 25

Chapter 3. ADVISION Integration with HP OpenView
condition is dependent on the alarm or test conditions reflected in traps and
is independent of the polling status maintained by HP OpenView.
IP Auto-Discovery:
Smart 16/16e Shelf
Controller
IP Auto-Discovery:
TSU Products
Manual
Rediscovery
For any auto-discovered Smart 16/16e Shelf controller, the ADVISION
discovery process interrogates the unit and determines which (if any) other
Smart 16/16e controllers are being proxied and adds symbols for the
proxied shelf on the auto-discovered unit’s child submap. A child submap
for each proxied chassis is created with the second executable chassis
symbol (which also reflects the unit status) and symbols for any of the
proxied unit’s option cards.
While there is no auto-discovery option card support for the TSU 100, 120,
& 600, the TSU 100e, 120e, & 600e do have option card support.
ADVISION does not automatically revise the configuration of a device (with
respect to its resident option cards) within the HP OpenView database.
manually
Whenever a card is added or replaced in the unit, the user must
rediscover the device so that the proper configuration is displayed.
Rediscovery is also necessary when a unit is given an IP address which has
been previously assigned to a different device type. To initiate a rediscovery
of an ADTRAN product, follow the steps in the ensuing Step/Action table:
Instructions for Manually Rediscovering an ADTRAN Product
Step Action
Select the applicable unit on the HP OpenView map.(Only one
1
selection at a time is allowed, and the map must be a Read/
Write map.)
Manual Rediscovery:
Smart 16/16e Shelf
Controller
Removing Objects
Execute ADTRAN’s discovery process by selecting
2
Tools > ADVISION Manager > ADVISION Discovery
from the HP OpenView menu bar.
The rediscovery process interrogates the unit and updates its set of option
cards listed on the child submap. The objects for existing cards which have
changed type are updated accordingly; any newly discovered cards are
added to the map; and any cards no longer present are deleted from the
submap on the HP OpenView database.
The rediscovery process for the Smart 16/16e Shelf controller searches for new
controllers being proxied by the device. If a new controller is found, it is
added to the submap and its option cards are placed on their respective
submap. You must initiate a manual discovery on a proxied chassis to
discover changes. Any existing proxied chassis is not affected by this
process.
If a proxied chassis has been physically removed from service, it is also
removed from the submap through manual object deletion. This practice
alleviates the potential removal from a submap of a proxied device, in the
event that communication with the unit fails during the rediscovery process.
To remove an object that refers to units which have been removed from
61950025L1-1 ADVISION User Manual 3-3
Page 26

Chapter 3. ADVISION Integration with HP OpenView
OBJECT
PLACEMENT
WITHOUT
DISCOVERY
Adding IPAddressable
Objects via
Loadhosts
service, select and delete the object from the HP OpenView map (
Delete > From All Submaps
In two instances, you must manually place ADTRAN objects on the map:
1. When you need to add IP-addressable units on an installation where
OpenView’s discovery has been disabled.
2. When you need to add proxied units which are not discovered during
the normal discovery process (for instance, chained units attached to a
TSU 100e, 120e, & 600e).
The following Step/Action table provides instructions for adding IPaddressable units to an OpenView installation using OpenView’s
loadhosts utility. (The loadhosts utility adds (loads) hosts to the
OpenView database.)
Instructions for Using loadhosts to Add IP-addressable Units
Step Action
1
2
Ensure the device is not already on the map.
Create a text file which contains the IP address followed by the
name of the device you wish to add. An example of the file
contents follows (underlined text is not included in the file):
).
Edit >
IP Address Device Comment identifying unit
10.22.3.7 tsuiq #Pleasant Prairie
You can have multiple devices in the file, but restrict the file to
units of the same type (for instance, only TSU IQs in one file
and DSU IQs in another).
If using DNS, ensure it is updated with the hostnames specified
in the above file(s).
3
Otherwise, add the contents of the file(s) to the end of the
/etc/hosts
file for name resolution.
3-4 ADVISION User Manual 61950025L1-1
Page 27

Chapter 3. ADVISION Integration with HP OpenView
Instructions for Using loadhosts to Add IP-addressable Units
Step Action
Logged in as
$OV_BIN/loadhosts -o
(
action loads the nodes into the OpenView database/map.)
Example invocations follow for TSU IQs and the TSU 600es,
where the last parameter is the file you created in step 2. Type
4
all of this information on one line.
$OV_BIN/loadhosts -o 1.3.6.1.4.1.664.1.147
TSUIQfilename
$OV_BIN/loadhosts -o 1.3.6.1.4.1.664.1.149
TSU600efilename
root
, run the loadhosts command
) from a command prompt.
(This
Manually
Adding Proxied
Objects
The last group of numbers of the octet string (
the above example)
octet values for each supported product is located in the
following file: /opt/advision/conf/C/oid2sym.txt
You must manually add proxied devices to the submap (except for the Smart
16/16e Shelf which is placed on the submap via auto-discovery). Follow the
instructions in the ensuing Step/Action table:
Instructions for Manually Adding Proxied Objects
Step Action
Select
1
Add Object: Palette window appears.)
2
Select the device class from the
3
Select the appropriate
Click and hold the middle-mouse button to drag the symbol to
4
the child submap.
Enter the words that you want displayed underneath the symbol
5
into the
Edit > Add Object
Label
changes for each product type. A list of
from the HP OpenView menu. (
Symbol Classes
symbol
(The Add Object dialog box appears.)
field.
of the device you want to add.
147 and 149 in
The
list.
If the ADVISION GUI supports the device, select
the device is not supported, skip to step 9.
6
(See the section Supported Devices
supported devices.)
From the list under
7
ADVISION:ADVISION
8
61950025L1-1 ADVISION User Manual 3-5
Target Objects
Set
Application Action:
.
Self
for
.
on page 5-1
, select
Execute
for a list of
. If
Page 28

Chapter 3. ADVISION Integration with HP OpenView
Instructions for Manually Adding Proxied Objects
Step Action
9
10
11
12
13
14
15
Under
Click on
Attributes dialog box opens.)
Enter the physical address or slot number into the
Device Address/Slot
Select the
Click on
not, information on how to correct the error is shown.)
If an error occurs, modify the appropriate entry and select
Verify
Once you receive the
system returns to the Add Object window.)
For executable objects, enter the
consists of the selection name of the proxy, followed by a tilde
and then the address, for example,
Object Attributes
Set Object Attributes...
ADTRAN Product Type
Verify
again.
(The message All Data OK should appear. If
.
, select
field.
All Data OK
AdvisionStatus
(The Add Object-Set
.
from the scrollable list.
message, click OK.
Selection Name
device.mycomp.com~3
(Continued)
.
ADTRAN
(The
. This entry
ADTRAN
STATUS
The HP OpenView database contains a field entitled ADTRAN Status for
each ADTRAN device (object). This field reflects the status of the device as
determined through traps received from the device or from status
information obtained while polling the device when displaying the unit’s
Device View.
The ADTRAN status field drives the HP OpenView object status for all nonIP-addressable ADTRAN objects, and drives the symbol status for the
symbol of an IP-addressable device which resides on that object’s child
submap. (This action does not interfere with the device’s object status which
is determined by HP OpenView’s netmon, a daemon that maintains the
network topology and status).
Some ADTRAN devices have no SNMP status data associated with them
(for instance all ESP option cards) and, therefore, normally have a status of
“Unknown” (blue color). Also, while some devices may have SNMP status
data available, the data in some cases may not be retrieved from the device
while displaying the Device Viewer (for example, option cards within a
Smart 16e Shelf).
3-6 ADVISION User Manual 61950025L1-1
Page 29

Chapter 3. ADVISION Integration with HP OpenView
You may modify the ADTRAN Status value (for instance, to set ESP option
cards to Normal) by following these steps:
Instructions for Modifying the ADTRAN Status
Step Action
1
Start OpenView.
2
Select an ADTRAN object.
3
Select
In the
4
and then select
In the
5
status from the scrollable list displayed under
Select
6
select OK.
Edit > Describe/Modify Object
Object Description
dialog box, select
.
View / Modify Object Attributes
Attributes for Object
Verify
and, after receiving a confirmation message,
dialog box, select the desired
The object status (or symbol status for the child submap
7
symbol for IP devices) on the map should now reflect the
selected status.
AdvisionStatus
.
ADTRAN Status
.
61950025L1-1 ADVISION User Manual 3-7
Page 30

Chapter 3. ADVISION Integration with HP OpenView
3-8 ADVISION User Manual 61950025L1-1
Page 31

Chapter 4
Graphical User Interface (GUI)
OVERVIEW
ACTIVATING
THE GUI
The ADVISION GUI provides access to configuration information, which is
viewable and modifiable though a series of pull-down and pop-up menus located in five different device-specific viewers. This chapter discusses the GUI viewers and their menus in the following sections:
• Device Viewer on page 4-2
• MIB Viewer on page 4-10
• Reviewer on page 4-14 (also called the MIB Reviewer)
• Graph Viewer on page 4-16
• Table Viewer on page 4-21
To activate the device-specific GUI (shown in Figure 4-2 on page 4-3), follow one
of the procedures described below.
1. From the OpenView map, single-click the left mouse button on any
ADTRAN object and select the following from the pull-down menu on
the menu bar:
Tools > ADVISION Manager > ADVISION
OR
2. From the OpenView map, single-click the right mouse button on any
ADTRAN object and select
ADVISION
from the pop-up menu.
OR
3. From the OpenView map, double-click the left mouse button on any executable ADTRAN object. (Executable objects have a raised, button-like
appearance.)
61950025L1-1 ADVISION User Manual 4-1
Page 32

Chapter 4. Graphical User Interface (GUI)
While loading, the ADVISION window displays (see Figure 4-1). Once
ADVISION successfully loads, the window automatically closes. The
device-specific window opens to provide complete access to all features
supported by the ADTRAN SNMP devices.
Figure 4-1. ADVISION Opening Window
DEVICE
VIEWER
The Device Viewer (see Figure 4-2 on page 4-3) is the visual interface to the
ADVISION-supported ADTRAN device. Four sections make up this viewer:
the Title Bar, the Menu Bar, the Device Image, and the Statistics Panel.
The Title Bar identifies the device. The Menu Bar (see also, Menu Bar on
page 4-4) contains a number of menus to configure the device. The Device
Image pictorially depicts the unit. The Statistics Panel (see also, Statistics
Panel on page 4-7) contains push buttons and numeric fields that keep you
informed of the GUI’s communication with the unit.
4-2 ADVISION User Manual 61950025L1-1
Page 33

Title Bar
Menu Bar
Chapter 4. Graphical User Interface (GUI)
Title Bar
Menu Bar
Device Image
Statistics Panel
Device Image
Statistics Panel
Figure 4-2. Two Views of the Device Viewer
61950025L1-1 ADVISION User Manual 4-3
Page 34

Chapter 4. Graphical User Interface (GUI)
Accessing the
MIB Viewer from
the Device
Viewer
A special feature of the Device Viewer is the ability to jump from the Device
View er to the MIB Viewer.
Instructions for Accessing the MIB Viewer from the Device Viewer
Step Action
Ensure that you are in the Device Viewer (see Figure 4-2 on
1
page 4-3).
Right-click on the device or on any option card.
2
menus and unit identification for that item display in a pop-up
menu.
For Option Cards Only:
Double-click the left mouse button on the option card to launch
3
an independent option card Device Viewer.
play menu options by using the menu bar or by right-clicking on
the option card.)
If the main unit’s Device Viewer is no longer needed, you can dismiss
it without affecting the option card’s Device Viewer. This procedure
eliminates unnecessary polling.
The available
(You can then dis-
Menu Bar
The following options make up the menu bar: File, View, Polling, Device, Mod-
ules, and Window. (The Modules option only appears if an option card is in-
stalled in the device; compare the menu bars in Figure 4-2 on page 4-3.)
Login
Apply Configuration
File Save Configuration
Close
Exit
View Front
Rear
Hide/Show Statistics
Menu Bar Suspend/Resume Polling
Demand Poll
Polling Clear Error
Reset Statistics
Device Device Polling
All Polling
Modules
Devices
MIB Viewers
Window Reviewers
Graphs
Tables
Figure 4-3. Menu Tree f or the Device Viewer Menu Bar
4-4 ADVISION User Manual 61950025L1-1
Page 35

Chapter 4. Graphical User Interface (GUI)
File
Includes the menu items Login, Apply Configuration, Save Configuration,
Close, and Exit.
Login See Login Dialog Box on page 2-4.
Apply Configuration Applies to the displayed device a complete device configuration previously
saved in a text file. A Load File dialog box displays to allow selection of the
text file (generated via the Save Configuration item described in the next
section).
When the file selection is made, ADVISION reads the saved configuration
data from the selected file into memory. The restrictions for each saved field
are compared to the user's permissions. If ANY field has a higher
permission requirement than that of the user, the download process is
terminated and the user is notified through an information dialog box.
Otherwise, ADVISION begins to transfer the saved configuration to the
device.
A Downloading Progress dialog box displays during the transfer showing
the number of required and completed transmissions. The
Stop
button in
the Downloading Progress dialog box allows you to stop the transfer. If an
SNMP error occurs (principally no-response timeouts), an information dialog box displays noting the error, and the rest of the transfer is terminated.
Terminating a Download Sequence
Only in the most unusual circumstances should you terminate a download
sequence. Whenever a termination occurs (either manually initiated or due
to I/O errors), immediately attempt to restore the device to a known configuration state by attempting a new Apply Configuration or by reviewing the
configuration with the MIB Viewer and applying any required modifications.
Updating MIB-II System Parameters
An Apply Configuration updates the user-selectable system parameters of
MIB-II. Therefore, while a saved configuration can be applied to two units
of the same type, ensure that the sysContact, sysLocation, and sys-
Name are correct after doing so.
Date and time values in the device are not affected by an Apply
Configuration.
Save Configuration Retrieves a complete device configuration from the displayed device and
saves it in a text file. A Save File dialog box displays which allows you to
select a file to create or update.
61950025L1-1 ADVISION User Manual 4-5
Page 36

Chapter 4. Graphical User Interface (GUI)
Uploading the Configuration
After you select the file, ADVISION begins retrieving the device's current
configuration. An Uploading Progress dialog box displays during the retrieval process, showing the number of required and completed transmissions. The
stop the transfer. If an SNMP error occurs (principally no-response timeouts), an information dialog displays noting the error, and the uploading
process terminates.
Terminating the Upload
Stop
button in the Uploading Progress dialog box allows you to
A terminated upload, via the
Stop
button selection or an I/O error, does not
affect the text file because all data must be retrieved without error before the
text file opens and the retrieved data is written to it. This procedure helps ensure that a partial configuration file is never created.
I/O Errors
If problems persist with I/O timeouts during either an upload or download
sequence, try suspending all polling of the device (and its proxy or host
unit if it's a card in a multi-card unit), and try again. The reduced I/O load
should have a positive impact on performance.
Close Closes the current Device Viewer and all open MIB Viewers generated from
the Device Viewer. If you close all windows without exiting, ADVISION
remains dormant in memory, ready to quickly respond to the next invocation with no delay for program loading.
Exit Exits ADVISION—closing all Device and MIB Viewers. A confirmation dia-
log box avoids accidental termination.
View
Polling
Selects from the views available for the unit (front and rear).
Contains the menu items Hide/Show Statistics, Suspend/Resume Polling,
Demand Poll, Clear Error, Reset Statistics, Device Polling, and All Polling.
Hide/Show Statistics Hides or shows the Statistics Panel. The Preferences Files specifies the default
visibility of this panel (see also, Preferences Files on page 6-1).
Suspend/Resume
Suspends or resumes polling for device status if Interval polling is specified.
Polling
Demand Poll Forces an immediate poll, if no poll is currently outstanding.
Clear Error Returns the error or timeout indication to Normal.
Reset Statistics Resets the last poll elapsed time and the poll counter (displayed in the Sta-
tistics Panel) to 0.
Device Polling Suspends or resumes polling for the Device View and all MIB Views cur-
rently displayed for this device. Does not affect the initial polling parameters set for any MIB View displayed at a later time. Suspend terminates a
Graph or Table View refresh in progress.
4-6 ADVISION User Manual 61950025L1-1
Page 37

Chapter 4. Graphical User Interface (GUI)
All Polling Suspends or resumes polling for the Device View and all MIB Views cur-
rently displayed for all devices. Does not affect the initial polling parameters set for any MIB View displayed at a later time. Suspend terminates a
Graph or Table View refresh in progress.
Device
Modules
Window
These headings indicate which MIB Viewers (dialog pages) are available for
the selected device. Headings are device-specific and include categories
such as Status, Configure, Diagnostics, Performance, Dial, Test, etc.
See the selected device’s user manual for information on the fields
represented on the MIB Viewers.
Accesses the Device menus for the option cards (for units containing option
cards) and identifies these options cards.
Provides a list of open ADVISION views. All MIB, graph, and table views
opened for a unit remain in this list until the unit’s device view is closed.
These lists consists of Devices, the MIB Viewer, the Graph Viewer, the Table
Viewer, and the MIB Reviewer.
Devices
•
names to bring that view to the top of the desktop.
MIB Viewers
•
Name: MIB View Title. Select from the list to bring that view to the top
of the desktop (see also, MIB Viewer on page 4-10).
Reviewer
•
View Title. For reviews of files, the unit name is extracted from the saved
file. Select from the list to bring that view to the top of the desktop (see
also, Reviewer on page 4-14).
Graph Viewer
•
Name: Graph View Title. Select from the list to bring that view to the top
of the desktop (see also, Graph Viewer on page 4-16).
Table Viewer
•
Name: Table View Title. Select from the list to bring that view to the top
of the desktop (see also, Table Viewer on page 4-21).
- lists names of open device views. Select from the list of unit
- lists names of opened MIB views. Entries include Unit
- lists names of open reviews. The entries are Unit Name: MIB
- lists names of opened graph views. The entries are Unit
- lists names of opened table views. The entries are Unit
The MIB Viewer and the MIB Reviewer differ in that the MIB
Reviewer does not communicate with the device at all and all fields
are editable.
Statistics Panel
61950025L1-1 ADVISION User Manual 4-7
The Statistics Panel, if enabled, appears on both the Device Viewer and the
MIB Viewer windows. To hide or display the Statistics Panel, use the selections under Polling (from the menu bar). The default state of hidden or visible is an installation option specified in the Preferences Files (see Preferences
Files on page 6-1). The Statistics Panel automatically becomes visible if an
SNMP error or a time-out occurs. Automatic visibility ensures that the ab-
Page 38

Chapter 4. Graphical User Interface (GUI)
normal condition displays. Changing a view image in either type of viewer
also automatically initializes the Statistics Panel.
The Statistics Panel is organized into two rows of four blocks (see
Figure 4-4). The top row contains four push-button (PB) indicators, referred
to as PB1—PB4 in the following paragraphs. The bottom row contains numeric (N) fields (some editable, some strictly informative), referred to as
N1—N4 in the following paragraphs.
PB1 PB2 PB3 PB4
Push-button
Indicators
PB1
N1
N2 N3
N4
Figure 4-4. Statistics Panel
The push-button indicators act as shortcuts for the Polling menu.
Click these
buttons to activate the following options. The push-buttons vary, depending
on the view selected and the action requested.
Indicates the viewer’s polling mode by displaying Demand, Once, Interval,
or Suspended.
Demand
Polling takes place only upon your request. This mode is uncommon and is
found on views that contain no dynamic data (such as some option cards).
Once
Polls the device only once to supply dynamic data (which is most commonly
unchanging configuration data). You can initiate a demand poll at any time.
Interval
Repeatedly polls the device to collect dynamic data for the viewer. Polling
takes place at the rate indicated in the numeric field directly below this
push-button (N1). The time shown in the field is the time between the end of
one poll and the beginning of the next poll. Click this push-button indicator
or change the
menu selection to suspend interval polling.
Polling
Suspended
Suspends polling. Click this push-button indicator to suspend polling then
use the
menu to resume interval polling. (The field now displays In-
Polling
terval.)
PB2
Indicates SNMP input/output (I/O) activity by displaying Poll, Polling, or
Applying.
4-8 ADVISION User Manual 61950025L1-1
Page 39

Chapter 4. Graphical User Interface (GUI)
Poll Displays when there is no SNMP I/O activity. Click this push-button indi-
cator or change the
menu selection to initiate a demand poll. You can
Polling
initiate a demand poll no matter what poll mode is active (interval, once, demand, or suspended); however, attempting to demand a poll while a poll is
still outstanding has no effect.
Polling Displays with a yellow highlight the duration of time that the SNMP GET
request and response transaction is in progress. The elapsed time displays in
N3.
Applying Displays with a green highlight for the duration of time that the SNMP SET
transaction is in progress. The elapsed time displays in N3.
PB3
Indicates the status of the last SNMP transaction by displaying Normal,
Timeout , or Error. If a time-out or error condition occurs while the Statistics
Panel is hidden, the panel automatically becomes visible again. Reset the
Error or Timeout indication back to Normal by clicking this push-button
indicator or by changing the
menu selection.
Polling
Normal Initially (and at the end of every successfully completed SNMP transaction)
Normal displays and continues to display until an abnormal result is received.
Timeout Indicates that a poll failed to obtain a response after waiting and retrying as
specified in the HP OpenView SNMP configuration database. Timeout indicates that the displayed data is not current. Possible errors resulting in this
display include community string errors, loss of physical link, and device errors.(see also, SNMP I/O Timeout Errors on page 5-3).
Error Indicates that an SNMP error occurred. An SNMP error usually indicates
that the device does not have a compatible firmware revision for ADVISION
management. Report this condition to ADTRAN Technical Support (see inside back cover) for resolution.
This error could also indicate a device configuration change. If an SNMP error is detected and the polling mode is Interval, polling automatically suspends because this error is unlikely to be corrected by retries. You can
demand a poll to verify this and/or to resume interval polling, as previously
described.
PB4
Displays the word “Reset” and is not an indicator. Click on this button to
reset the duration of the last poll in N3 and to reset to zero the count of the
number of polls in N4.
Numeric Fields
Specify the length of time between successive polls when in the interval
mode, the length of time between successive polls when a timeout condition occurs, displays the time that the last SNMP activity took to complete
the transaction of a GET or SET request, and displays a count of the number
of SNMP transactions completed.
N1 Determines the length of time between successive polls when in the interval
mode. Most device and status views are defined to poll at one-second intervals. You can suspend interval polling or temporarily override the rate by
61950025L1-1 ADVISION User Manual 4-9
Page 40

Chapter 4. Graphical User Interface (GUI)
editing the value to any suitable value (in seconds) and then pressing
Specifying a value of zero causes ADVISION to poll the device continuously at the fastest rate possible. The flashing yellow polling indicator in
block PB2 reflects the impact of this setting.
N2 Specifies the length of time between successive polls when a timeout condi-
tion occurs. Typical default value are the same as the timeout value for normal Polls. To reduce congestion during high traffic periods, manually
increase this value by editing the field to the appropriate value (in seconds)
and then pressing
N3 Displays the time that the last SNMP activity took to complete the transac-
tion of a GET or SET request and its corresponding response. Use this time
when diagnosing network problems, when determining practical timeout
settings for the SNMP Configuration database, or when establishing baselines of access performance.
N4 Displays a count of the number of completed SNMP transactions, with or
without error, since either initiating the view or resetting the statistics.
MIB VIEWER
MIB Viewers are dialog pages which display SNMP data obtained from a
device. View, change, and control the data parameters from within the
pages. These pages consist of six parts: the Title Bar, the Menu Bar, the
SNMP Data Area, the Table Index Selectors, the Statistics Panel, and the Command Buttons (see Figure 4-5).
Enter
.
Enter
.
4-10 ADVISION User Manual 61950025L1-1
Page 41

Title Bar
Menu Bar
SNMP Data Area
Chapter 4. Graphical User Interface (GUI)
Title Bar
Menu Bar
File
Table Index Selectors
Statistic Panel
Command Buttons
Figure 4-5. MIB Viewer
To select a MIB Viewer, go to the Device Viewer menu bar and select Device
(for the main device MIB Viewer) or Module (for any option card MIB
Viewer). MIB Viewers are also accessible from the Device Viewer through
the pop-up menus displayed when you right-click an ADTRAN device (or
its option cards).
Identifies the device and the title of the MIB Viewer.
The following menu items make up the Menu Bar: File, Polling, Status, and
Window. Status is unique to the device and the category selected (for example Status, Configure, etc.).
Contains the following options: Login, Load, Save, and Close.
61950025L1-1 ADVISION User Manual 4-11
Page 42

Chapter 4. Graphical User Interface (GUI)
Login
File Load
Save
Close
Refresh Viewer
Hide/Show Statistics
Suspend/Resume Polling
Polling Demand Poll
Menu Bar Clear Error
Reset Statistics
Device Polling
Status All Polling
Devices
MIB Viewer
Window Graph Viewer
Table Viewer
MIB Reviewer
Figure 4-6. Menu Tree for the MIB Viewer Menu Bar
Login See Login Dialog Box on page 2-4.
Load Restores any MIB View to a previously saved set of values. When loading
the saved values, all user-modifiable fields are updated and can be subsequently edited. Any ReadOnly fields or fields not modifiable due to the
user's privilege level are not restored. When you click the
updated fields (either by
File > Load
or user input) are downloaded to the
Apply
button, all
device.
You can also use the
File > Load
feature to download common configurations to other devices. After properly configuring one device, save the baselines and then load them to the corresponding pages of other devices. After
loading the saved configuration to the MIB page, you can make adjustments
to the fields as necessary. Click the
Apply
button to download the new con-
figuration.
ADVISION issues a warning message to prevent you from loading a saved
page file that is different from the currently displayed page.
For pages with Table Index Selectors, if the selected index is different from the
index saved in the file, a warning message generates noting the mismatch. If
you continue the load by clicking
Apply
, the values from the file update the
associated fields, disregarding the index mismatch.
By default, these files are located in your home directory with a preferred
suffix of .sav. You can alter this location during navigation in the
Save
dialog, or preset the location in the Preferences Files.
Load >
Save When saving a MIB Viewer page to a file, all of the values are stored as they
are currently displayed (even if some fields have been edited since the
device was last polled). All fields, whether they have permissions of
ReadOnly or ReadWrite, are stored in the file. Saving all the fields captures
4-12 ADVISION User Manual 61950025L1-1
Page 43

the complete MIB Viewer page state as a baseline, so you can review it at a
later time.
Close Closes the current MIB Viewer.
Chapter 4. Graphical User Interface (GUI)
Polling
Refresh Viewer Conditionally enabled when a page containing a Table Index Selector’s
Status
Window
SNMP Data Area
Contains the same menu options as Device Viewer/Polling (see page 4-6) with
the addition of Refresh Viewer.
value range is dynamically bounded by an SNMP variable obtained from
the device. Whenever a page is initially viewed, the unit is polled to obtain
the valid range for the selector and then data is retrieved for the selector’s
default value. Any subsequent polling of the device maintains the limits
initially obtained.
However, in many cases the Table Index Selector’s range may change while
the page is being reviewed. If you have reason to believe the range might
have changed during this time, simply select Refresh Viewer and the Table
Index Selector’s range variable will be polled. Data displayed within the dialog will be subsequently polled.
Shows the status category (Status, Configure, etc.) of the displayed page.
Menu items under this option are radio-buttons identifying all of the pages
associated with the category. To display a different page, select the page
name from the list.
See Window on page 4-7.
Displays information about SNMP data parameters. Several different field
types contain this information. Some fields are editable or executable; some
fields are view-only. The different types of fields are described below:
Text Fields
Combo Boxes
Scales
Push Buttons
61950025L1-1 ADVISION User Manual 4-13
Accepts data entered using the keyboard and allows you to view the displayed information. The system beeps if you attempt to edit a read-only
text field, or if you attempt to enter more characters than are supported by
the device.
Provide additional menus. To access these menus, click the box located to
the right of the combo box menu field to view and select from the menu
options. Combo box menus with an arrow indicate alterable fields. Combo
box menus with no arrow indicate a read-only field.
Increases and decreases a value when you drag the selector right or left,
respectively. Click to the right/left of the selector to increase/decrease the
value by one.
Activates an option when you click on the push-button.
Push-button action implicitly applies all pending field changes.
Page 44

Chapter 4. Graphical User Interface (GUI)
Toggle Boxes
Table Index
Selectors
Statistics Panel
Command
Buttons
Done
Enables (checked box) and disables (unchecked box) mutually exclusive
options when you click the box. If the system does not respond to your
command, the field is read-only.
Some MIB Viewer pages display selected data for a set of parameters within
the device. For example, a device may have multiple ports which have identical configuration parameters. To identify which port the data is associated
with, a scale displays between the Data Area and the Command Buttons. Select data for two different parameters, using two scales displayed in the
same region. When a page with selectors first displays, the selector values
default to their minimum. If you want to view data for a different item (e.g.,
port), move the scale to the appropriate value. The data associated with the
new selection is retrieved from the device and displayed.
This section is the same as for Device Viewer Statistics Panel (see page 4-7).
Located beneath the Statistics Panel, the Command Buttons include Done,
Apply, Revert, and Cancel.
Applies any changes made on the current page to the device and dismisses
the MIB Viewer.
Apply
Revert
Cancel
REVIEWER
Applies changes to the device. This button is only active when fields have
been altered. In any text field, altered integer values are compared to an
allowable range for the text field before being sent to the device. If the value
is not within range, a message dialog opens noting which field is in error
and describing the allowable range. Correct the value before attempting
another
Discards field changes made since the last Apply and polls the unit for its
current set of values.
Discards field changes made since the last Apply and dismisses the MIB
Viewer.
The MIB Reviewer allows you to review and modify the contents of MIB
views which have been saved through the
Viewer. The two primary differences between the MIB Viewer and the MIB
Reviewer are that the Reviewer does not communicate with the device (neither Polling nor Apply is supported) and all fields are editable.
When launched from the Device Viewer, the MIB Reviewer displays a
Load
from the MIB Viewer, the current MIB view is copied and displayed. The Reviewer consists of the following sections: Title Bar, Menu Bar, SNMP Data Ar-
ea, and Table Index Selectors.
Apply
.
File > Save
dialog box which prompts you for a file to display. When launched
function of the MIB
File >
Title Bar
4-14 ADVISION User Manual 61950025L1-1
Identifies the device and the title of the MIB Reviewer.
Page 45

Chapter 4. Graphical User Interface (GUI)
Menu Bar
Includes the following menu items: File, Page, and Window.
Login
Load
File Save
Close
Page Exit
Menu Bar
Device Viewer
MIB Viewer
Window Graph Viewer
Table Viewer
Reviewer
Figure 4-7. Menu Tree for the Reviewer Menu Bar
File
Contains the following menu items: Login, Load, Save, Close, and Exit.
Login See Login Dialog Box on page 2-4.
Load Displays a previously saved set of values. When loading, all saved values
(including Table Index Selectors) are updated and can be subsequently
edited and saved.
By default, these files are located in your home directory with a preferred
suffix of .sav. You can alter this location during navigation in the
Load > Save
dialog, or preset the location in the Preferences Files.
Save Saves the current MIB Reviewer contents to a text file. All fields, regardless
of current user permissions, are stored in the file.
Close Closes the Reviewer
window.
Exit Exits ADVISION, closing all Viewers and exiting the ADVISION applica-
tion. Your response to a confirmation box, avoids accidental termination.
Page
Conditionally displays the total configuration page for some products, for
example, TSU 100e, TSU 120e, and TSU 600e. Page is actually a set of pages,
consisting of its own total configuration page and additional total configuration pages for each of its option cards. When multiple pages make up the
total configuration page, Page becomes visible and has a drop-down radio-button list of included page names. To view a page, simply select the
page name from the list.
Window
See Window on page 4-7.
61950025L1-1 ADVISION User Manual 4-15
Page 46

Chapter 4. Graphical User Interface (GUI)
SNMP Data Area
Text Fields
Combo Boxes
Scales
Push Buttons
Toggle Boxes
Table Index
Selectors
Contains several different field types. All fields are editable regardless of
your permission. These field types include the following: Text Fields, Combo
Boxes, Scales, Push Buttons, and Toggle Boxes.
See Tex t F ie l d s on page 4-13.
See Combo Boxes on page 4-13.
See Scales on page 4-13.
See Push Buttons on page 4-13.
See Toggle Boxes on page 4-14.
Some pages display selected data for a set of parameters within the device.
For example, a device may have multiple ports which have identical configuration parameters. To identify which port the data is associated with, a
scale displays between the Data Area and the Command Buttons. Data may
be selected for two different parameters, which are displayed with two
scales in the same region. In the MIB Reviewer, the Table Index Selector values are view-only items.
GRAPH
VIEWER
Provides a graphical presentation of various tabular MIB data available in
ADTRAN devices. Each graph displays in a separate window. Some graphs
are preconfigured so that the viewable data sets are not user-selectable.
However, several graphs have logically grouped together a sizable number
of MIB variables and allow you to select from a list a reasonable number of
variables to simultaneously view. You may also modify several presentation
parameters at run time. The following sections make up the Graph Viewer:
Title B a r, Menu Bar, Variable Selection Dialog, and Graph Data Area.
4-16 ADVISION User Manual 61950025L1-1
Page 47

Chapter 4. Graphical User Interface (GUI)
Title Bar
Menu Bar
Figure 4-8. Graph Viewer
Identifies the device and presented data.
The following menu options make up the Menu Bar: File, Polling, and Win-
dow.
Login
File Export Data
Close
Exit
Refresh
Menu Bar Polling Reconfigure
Device Polling
All Polling
Device Viewer
MIB Viewer
Window Graph Viewer
Table Viewer
Reviewer
Figure 4-9. Menu Tree for the Graph Viewer Menu Bar
61950025L1-1 ADVISION User Manual 4-17
Page 48

Chapter 4. Graphical User Interface (GUI)
File
Login See Login Dialog Box on page 2-4.
Export Data Allows you to save data currently displayed on the Graph to a file which
Close Closes the Graph window.
Exit Exits ADVISION, closing all viewers. Your response to a confirmation box
Contains the following menu items: Login, Export Data, Close, and Exit.
can later be transferred to a database or spreadsheet program. The data is
saved in a comma-delimited format with data for each variable stored in a
single column. When you select Export Data, a file dialog box prompts you
to select the data filename.
Importing the Exported Data File
When importing the file, be aware that several identifier lines are saved at
the beginning of the file identifying the user who created the file, his ADVISION permissions, the file creation time, the filename, the source ADTRAN
unit, and the ADVISION graph page name. Following these identifier lines,
the first data row contains a description of the field and the second data row
contains the actual MIB variable, along with any instance specification noted
as an index.
avoids accidental termination.
Polling
Refresh Accesses the device to update all data displayed on the graph. A progress
Reconfigure Displays the Variable Selection Dialog from which to select for viewing a dif-
Device Polling
Suspend/Resume
All Polling
Suspend/Resume
Window
Variable
Selection Di alog
Includes the following items: Refresh, Reconfigure, Device Polling Suspend/Resume, and All Polling Suspend/Resume.
dialog box displays progress during data acquisition.
ferent set of data.
Suspends or resumes polling for the Device View and all MIB Views currently displayed for this device. It does not affect the initial polling parameters set for any MIB View displayed at a later time. Suspend terminates a
Graph or Table View refresh in progress.
Suspends or resumes polling for the Device View and all MIB Views currently displayed for all devices. It does not affect the initial polling parameters set for any MIB View displayed at a later time. Suspend terminates a
Graph or Table View refresh in progress.
See Window on page 4-7.
Lists variables that may be displayed in the Graph Viewer (see Figure 4-10
on page 4-19). The listed variables are logically associated, for example, listing all Network Frame Relay Performance data for a unit from the IQ product family. Each list has a maximum number of variables that may be
simultaneously viewed. Typically, that number is four and is displayed in
the upper-right corner of the dialog box. To select a variable, simply check
4-18 ADVISION User Manual 61950025L1-1
Page 49

Chapter 4. Graphical User Interface (GUI)
the toggle button to the left of the variable description. If the maximum number of variables has been selected, the remaining list is grayed-out.
Figure 4-10. Variable Selection Dialog Box
If the maximum number of variables has been selected, you can replace a
current variable with a grayed-out variable, by de-selecting (unchecking)
one of the current variables. This action makes the number of variables selected no longer the maximum. Then, you can select a new variable from the
list of available variables. After making a new selection, click the
button at the bottom of the dialog box to view the new graph, or click
to view data for previous variable selections.
Accept
Cancel
Graph Data
Area
Progress Dialog
Stop Button Interrupts data acquisition and leaves the graph in its current, partially com-
Scales
Axes Labels
Displays in several different ways: point plot, area plot, bar chart, and
stacked bar. The default display method is chosen to best represent the data.
Each axis is appropriately scaled and labeled. The Graph Viewer window
size and the graph size and scale can be modified.
While data is acquired from the device, either from the initial window display or a subsequent Refresh Graph request, a Progress dialog box displays
to show how much of the requested data has been retrieved. A progress bar
along with a numeric percentage is shown. This is particularly useful when
most of the retrieved data is plotted along the X-axis, and, therefore, not visible.
plete state. This option can eliminate unnecessary network traffic if only part
of the graphed data is of interest and is already displayed.
Presets scaling to show defined ranges of data, for example, 0-900 for DS1
Errored Seconds by 15-minute intervals. Scales can also “float,” automatically re-scaling the graph to plot the displayed data, as in DS1 Path Coding Violations by 15-minute interval.
Displays text along the graph's axes describing the engineering units of the
data.
61950025L1-1 ADVISION User Manual 4-19
Page 50

Chapter 4. Graphical User Interface (GUI)
Data Labels
Window Resize
Resizing/Scaling
Translation
Zooming
Provides labels across the bottom of graph identifying the data represented
by symbol type (for point/line plots) or by color (for area or bar charts).
Resizes the graph window in any direction, at any time. The aspect ratio of
the graph need not be maintained.The graph is redrawn to fit the new window display area, rescaling the axes and possibly changing the data label organization to best-fit the new window area.
Changes the graph scale, independent of the window. To alter the graph
scale, press the
Ctrl
key on the keyboard and simultaneously hold down the
middle mouse button. To increase the graph's size, drag the mouse towards
you. To decrease its size, drag the mouse away from you. When enlarging
the view, the graph display is clipped within the window.
Re-positions (translates) the location of the graph within the window (under
normal scale or when reduced) or of the portion of the graph being viewed
(when the scale has been so enlarged that all of the graph is not viewable).
Press the
Shift
key on your keyboard and simultaneously hold down the
middle mouse button. Move the mouse in the appropriate direction to
re-position the graph. Releasing the middle mouse button “drops” the
graph at the current location within the window.
Enlarges (zooms-in on) a particular portion of a graph to fill the current window. The zoomed graph may or may not have labeled axes depending on
the selection method. To view the data without any axes, place the mouse
pointer at a corner of the area to be enlarged. Simultaneously press the
Ctrl
key on your keyboard and the left mouse button, and proceed to “lasso” a
rectangular region to enlarge. Release the mouse button and the graph
changes to display the lassoed region. If an axis is included in the lassoed region, it is shown in the resulting view. To ensure that both axes are displayed, use the
Shift
key instead of the
Ctrl
key.
Return to Default
After scaling, translation, or zooming the graph, you may return the graph
to its original display settings by pressing the r key on your keyboard. All
interactive scaling, translation, and zooming are removed and the default
graph margins and axes bounds display. While the original geometry is restored, the axes scaling may differ slightly from the original display.
Error Dialogs
Various errors may occur when communicating with a device to retrieve
data for display in the graph. When errors occur, the viewer displays a dialog box to help explain the encountered problem. The dialogs are listed below along with a brief explanation of the problem and its possible source.
GET Error A general SNMP communication error occurred. The type of error is dis-
played within the dialog. This error can result from several different problem sources including an intermittent communication error, an incorrect
GET community string, and an attempt to retrieve data not stored within
the device.
Viewer Creation
Warning
The message states, Device contains no data. A graph with a selectable list
of indices (for example, the TSU/DSU IQ PVC Interval Performance Graph)
has no list entries from which to select. In this example, this error may occur
when the unit has not identified any PVCs to monitor.
4-20 ADVISION User Manual 61950025L1-1
Page 51

Chapter 4. Graphical User Interface (GUI)
Initialization Error A problem occurred while trying to determine data display constraints
(index ranges) before actually retrieving data. For instance, all TSU IQ performance graphs have to poll (interrogate) the device to determine what set
of intervals and PVCs are available for retrieval. If an SNMP I/O error
occurs during this phase of graph generation, the dialog text explains the
detected error. If the index ranges are obtained and the index maximum
value is zero, the dialog text states, Device contains no data . You may
observe this when attempting to retrieve daily performance statistics before
the unit has recorded the first day’s data.
If the maximum index range value is nonzero, but still below the minimum
value, the text states, Startup limits out of range. No errors resulting from
normal operations should result in this notice.
TABLE VIEWER
Title Bar
Menu Bar
Provides a tabular view of various MIB data available in ADTRAN devices.
Each table opens within a separate window and is ReadOnly regardless of
the user’s permission. Some tables are preconfigured so that the viewable
data sets are not user-selectable. However, several tables have logically
grouped a sizable number of MIB variables together and allow you to select
from a list a reasonable number of variables which can be simultaneously
viewed.
This viewer consists of the following sections: Title Bar, Menu Bar, Variable
Selection Dialog, and Table Data Area (see the menu tree in Figure 4-11 and,
also, Figure 4-11 on page 4-21).
The title bar identifies the device and presented data.
The following menu items make up the Men Bar: File, Polling, and Window.
Login
File Export Data
Close
Exit
Refresh
Menu Bar Polling Reconfigure
Device Polling
All Polling
Device Viewer
MIB Viewer
Window Graph Viewer
Table Viewer
Reviewer
Figure 4-11. Menu Tree for the Table Viewer Menu Bar
61950025L1-1 ADVISION User Manual 4-21
Page 52

Chapter 4. Graphical User Interface (GUI)
Figure 4-12. Table Viewer
File
Contains the following menu items: Login, Export Data, Close, and Exit.
Login See Login Dialog Box on page 2-4.
Export Data Saves data currently displayed in the table to a text file which can later be
transferred to a database or spreadsheet program. The data is saved in a
comma-delimited format with data for each variable stored in a single column. After selecting Export Data, you are prompted with a file dialog box
to enter a name for the text file.
Importing the Export Data File
When importing the text file, be aware that several identifier lines are saved
at the beginning of the file identifying the user who created the file, his
ADVISION permissions, the file creation time, the filename, the source
ADTRAN unit, and the ADVISION table page name. Following these
identifier lines, the first data row contains a description of the field and the
second row contains the actual MIB variable along with any instance
specification noted as an index.
4-22 ADVISION User Manual 61950025L1-1
Page 53

Chapter 4. Graphical User Interface (GUI)
Close Closes the table window.
Exit Exits ADVISION, closing all viewers. Your response to a confirmation box
avoids accidental termination.
Polling
Refresh See Refresh on page 4-18.
Reconfigure See Reconfigure on page 4-18.
Device Polling
Suspend/Resume
All Polling
Suspend/Resume
Window
Variable
Selection Dialog
Contains the following options: Refresh, Reconfigure, Device Polling Suspend/Resume, and All Polling Suspend/Resume.
See Device Polling Suspend/Resume on page 4-18.
See All Polling Suspend/Resume on page 4-18.
See Window on page 4-7.
Lists variables that may be displayed on the Table Viewer. The listed variables are logically associated, for example, listing all Network Frame Relay
Performance data for an IQ product. Each list has a maximum number of
variables that may be simultaneously viewed. Typically, that number is
eight and is displayed in the upper-right corner of the dialog box. To select
a variable, simply check the toggle button to the left of the variable description. If the maximum number of variables has been selected, the remaining
list is grayed-out.
Table Data Area
Progress Dialog
Labels
If the maximum number of variables has been selected, you can replace a
current variable with a grayed-out variable, by deselecting (unchecking) one
of the current variables. This action makes the number of variables selected
no longer the maximum. Then, you can select a new variable from the list of
available variables. After making a new selection, click the
the bottom of the dialog box to view the new graph, or click
data for previous variable selections.
The displayed table represents tabular MIB data displayed in columnar fashion. Each row represents data for a given index for the MIB table with each
column a MIB variable within the table. The Viewer’s window size and the
size of a column or row can be modified.
Shows how much data has been retrieved from the device (either from the
initial window display or from a subsequent Refresh Table request). The dialog box includes a progress bar and a numeric percentage. The Progress dialog box also has a
and leaves the table in its current, partially complete state. Stopping data acquisition can eliminate unnecessary network traffic if only part of the table’s
data is of interest and is already displayed.
Each table column contains a label identifying the displayed MIB variable,
and each row has a label identifying the entry’s index.
Stop
push-button which interrupts the data acquisition
Accept
Cancel
button at
to view
61950025L1-1 ADVISION User Manual 4-23
Page 54

Chapter 4. Graphical User Interface (GUI)
Window Resize
Resizes the window in any direction, at any time; however, the table is not
rescaled to adjust to the new window size. Table adjustments must be performed by the user. If the table display area is larger than the window size,
scroll bars automatically appear to allow the user to view the entire table.
Row/Column Resize
Alters the height of each row and the width of each column. When you position the mouse cursor over a cell border, the cursor changes to a bounded
arrow (e.g. ->|). Hold down the left mouse button and drag the border to the
desired location, and drop it there by releasing the button. By selecting an
intersection, the width and height of a cell (along with its row and column)
can be concurrently altered in a similar manner.
Error Dialogs
Various errors may occur when communicating with the device to retrieve
data to display in the table. When errors occur, the viewer displays a dialog
box to help explain the encountered problem. The dialogs are listed below
along with a brief explanation of the problem and its possible source.
GET Error A general SNMP communication error occurred. The type of error is dis-
played within the dialog. This error can result from several different problem sources including an intermittent communication error, an incorrect
GET community string, and an attempt to retrieve data not stored within
the device.
Viewer Creation
Warning
Message states, Device contains no data. A table with a selectable list of
indices (for example, the TSU/DSU IQ PVC Interval Performance Table)
has no list entries from which to select. In this example, this error may occur
when the unit has not identified any PVCs to monitor.
Initialization Error A problem occurred while trying to determine data display constraints
(index ranges) before actually retrieving data. For instance, all TSU IQ performance tables have to poll (interrogate) the device to determine what set
of intervals and PVCs are available for retrieval. If an SNMP I/O error
occurs during this phase of table generation, the dialog text explains the
detected error. If the index ranges are obtained and the index maximum
value is zero, the dialog text states, Device contains no data . You may
observe this error when attempting to retrieve daily performance statistics
before the unit has recorded the first day’s data.
If the maximum index range value is nonzero, but still below the minimum
value, the text states, Startup limits out of range. No errors resulting from
normal operations should result in this notice.
4-24 ADVISION User Manual 61950025L1-1
Page 55

Chapter 5
Device-Specific Information
OVERVIEW
SUPPORTED
DEVICES
This chapter discusses device-specific information for ADVISION and provides
details on the features unique to the ADVISION GUI. For all other devicespecific information, refer to the device user manual.
ADVISION supports the following devices:
• ATLAS 800, ATLAS 800
only)
• IQ Units (DSU IQ, TSU IQ, IQ Probe, NxIQ, TSU IQ Rackmount, and
TSU IQ+)
•DSU IV ESP
• FramePort 144 & 768 on page 5-2
• MX2800 & MX2810
• Smart 16/16e Shelf on page 5-3
• T3SU 300
• Total Access Shelf (Gen 1 SCU and NMI)
• TSU 100, 120, & 600 on page 5-4
• TSU 100e, 120e, & 600e on page 5-4
•TSU ESP
PLUS
(base units and Quad T1/PRI Option Card
SYSTEM
INFORMATION
IQ UNITS PRIOR
TO V 3.22
61950025L1-1 ADVISION User Manual 5-1
Activate the system information MIB Viewer by selecting it from the device’s
Status menu. You can edit the following fields: System contact, Name, and Location. All other fields are read-only.
For DSU/TSU IQ units with a software revision prior to 3.22, most SNMP configuration modifications are not applied by the unit until an Apply Configuration command is sent. Send this command by clicking the push button on the
Unit Configuration page. Refer to your DSU/TSU IQ manual for the list of items
which do not require an Apply Configuration command to become active.
Also, for these units to allow a total configuration download to work without error, the Apply Configuration command is not automatically sent at the end of
Page 56

Chapter 5. Device-Specific Information
the application sequence. You must manually send the Apply Configuration
to activate the downloaded configuration.
IQ UNITS
LATER THAN
V 3.22
Get Error Dialog
Box
DSU IQ, TSU IQ, IQ Probe and TSU IQ+ units with software revision 3.22
and later do not require the Apply Configuration command for updates to
take effect. Individual modifications and Total Configuration updates take
effect automatically. On all units, applying a Total Configuration does not
update PVC performance monitoring configurations or PVC diagnostic configurations. This decision allows a Total Configuration file saved for one
unit to be readily applied to another unit (whose list of defined PVC DLCIs
are most likely different).
The last parameters to be updated when applying a Total Configuration to
these devices are the Performance data interval settings (for example, number of intervals, length of interval, etc.). The device’s SNMP agent typically
will not respond before a timeout condition occurs, since it is in the process
of reallocating its memory to the specified settings (even if the values did not
change). Therefore, the Apply Total Configuration process typically generates an error on the last buffer transmitted, while the unit actually has been
updated properly. Be sure to review the Performance data interval settings
after observing this to ensure the desired settings were achieved.
A Get Error dialog may occur when retrieving the last interval of a large set
of performance data for the TSU IQ / DSU IQ. This is especially true if
5-minute intervals are being retrieved. The interval range is determined at
the start of data retrieval. Data for the oldest interval may be removed from
the unit’s buffers before the graph or table viewer attempts to retrieve it.
Specifying a
New PVC
IP Host Table
FRAMEPORT
144 & 768
To specify a new PVC within the Configure PVC dialog, select the largest
available index, which will have a DLCI value of zero (0). Enter the appropriate settings and select
figuration table and the next higher index will be available for entering a
new definition. To view the new index, you must select Refresh Viewer (see
page 4-13) from the Polling item in the menu bar.
The entire IP Host table is currently not included in the unit’s Total Configuration. Only the first table entry is saved and restored upon applying the
configuration to the unit. Additions to the IP Host table should be handled
in a similar fashion as described in Specifying a New PVC, above.
ADVISION displays the option cards installed in the FramePort 144 and 768
in a shelf called a D4 DiGroup. The shelf is arranged in two rows of twelve
cards and does not necessarily reflect the actual layout of the option card’s
physical chassis. Gain access to information on the network data associated
with the FramePort via the D4 DiGroup menu selections (by selecting Device from the menu bar or by right-clicking on the shelf in an area where an
installed card is not shown). Gain access to information and options for individual cards by selecting the card from the Modules menu or by rightclicking the card.
Apply
. The new DLCI will be entered into the con-
5-2 ADVISION User Manual 61950025L1-1
Page 57

Chapter 5. Device-Specific Information
An additional menu item, the Provisioning selection, is included in the
FramePort 144 and 768 ADVISION interface. Access this selection from the
Device menu. Choose to provision the card, port, PVC, or DLCI. You must
have Provision permission to be able to write to the Provisioning pages;
however, with ReadWrite permission, you may perform test functions. See
the Using Online Help on page 2-6 for more information on Provision and
ReadWrite permission.
SMART 16/16E
SHELF
DSU III DBU
Removing a
Device Card
The Smart 16/16e Shelf controller provides SNMP support for up to 16
shelves. The rackmount cards supported include the following:
• DSU III AR
• DSU III DBU (V.34, V.32, ISDN, S4W)
•ISU 128
•ISU 2x64
•T1 ESF CSU
• TSU (V.35, EIA-530)
The DSU III DBU V.32 is treated as a V.34 card and is controlled in the same
manner.
Removing a device card from the Smart 16e Shelf causes the MIB Viewer to
report an error in the statistics panel and to suspend interval polling. When
the card is replaced, polling may be resumed. If the card configuration is altered so that the HP OpenView submap is no longer valid, select the Smart
16/16e Shelf symbol and initiate Manual Rediscovery to rebuild the submap. Close the ADVISION Device Viewer for the shelf and relaunch to allow the GUI to reflect the new configuration.
SNMP I/O
Timeout Errors
61950025L1-1 ADVISION User Manual 5-3
You may experience SNMP I/O timeout errors when applying a Total Configuration to a unit or its option cards or when applying several changes
from any MIB View/Configuration page. Responses from the unit can be delayed since all changes have to be validated. To alleviate this problem, in the
OpenView SNMP Configuration Database extend the unit's timeout value
(up to 5 seconds) and set its retry value to none (0). Note that these values do
not affect ADVISION's operation until the Device View of the unit is closed
and re-opened.
Page 58

Chapter 5. Device-Specific Information
T3SU 300
TSU 100, 120,
& 600
Port Configurations cannot be updated directly on the T3SU 300. To modify
a port configuration, select the Port Configuration page. Next select which
port to modify by setting the field Update Profile from Port and clicking
Apply
. The port’s configuration will be copied to the units temporary
working buffer which is displayed in the configuration dialog. Modify the
configuration as desired and then select the port in the Apply Profile to Port
field. Clicking
working buffer’s settings.
The port configuration procedure described above is not supported under
the current Load/Save Configuration for the T3SU 300. All non-port configuration parameters are saved and restored. You must update each port configuration separately to completely restore a unit’s configuration. You may
use the individual page
page to aid you in this.
These products have limited SNMP support for ADVISION version 3.1 using the SNMP Agent option card, although they have complete proprietary
management support using the ADTRAN product T-Watch Pro™.
Under ADVISION 3.1, the following limitations exist for the TSU Multiplexers (TSU Mux) product family (TSU 100, 120, and 600):
Apply
updates the selected port’s configuration with the
Save > Load
feature from the port configuration
TSU 100E, 120E,
& 600E
• In the front view of the Device Viewer, only three of four CSU indicators
are animated: OK, ALARM, and TEST (ERROR is not supported). The
OK (green) indicator is on when the DS1 line status variable indicates no
errors. The ALARM (red) indicator is on when an error is reported. The
TEST (yellow) indicator is only on when the device is reporting an active
local loopback test but does not show when the device is in non-loopback test mode. Some test conditions at the device produce OK and
ALARM indications that are not reported to ADVISION.
• The rear view in the Device Viewer does not display the presence of op-
tion cards. There is no SNMP support of TSU MUX option cards in ADVISION 3.1.
• Members of this product family, as well as the standalone TSU and
ISU 512, can be chained to a TSU with an SNMP agent card to provide
SNMP support through one IP address. The existence of these chained
devices is currently not reported by the SNMP agent card to ADVISION.
Manually place these devices on a submap to allow management with
ADVISION by following the procedure described under Manually Add-
ing Proxied Objects on page 3-5.
These products have expanded SNMP support for ADVISION version 3.1.
The Device Viewer presents an accurate representation of all front panel
LEDs and shows supported option cards in their appropriate location on the
rear view of the device. Status, configuration, and test parameters for the option cards are available for review and setting. While there is some additional support for the base units, complete management support requires use of
the ADTRAN product T-Watch Pro (for instance, to manipulate the DS1DS0s mapping.)
5-4 ADVISION User Manual 61950025L1-1
Page 59

Chapter 5. Device-Specific Information
TSU Mux
Limitations
NAMING
CONVENTIONS
Under ADVISION 3.1, the following limitation exists for the TSU Multiplexers (TSU Mux) “e” product family (TSU 100e, 120e, and 600e):
• Members of this product family, as well as the standalone TSU and
ISU 512, can be chained to a TSU “e” unit to provide SNMP support
through one IP address. The existence of these chained devices is currently not reported by the unit to ADVISION. Manually place these devices on a submap to allow management with ADVISION by following
the procedure described under Manually Adding Proxied Objects on
page 3-5.
• ADTRAN units which are remotely controllable via the FDL link with a
TSU Mux “e” product are accessible to ADVISION. However, the user
must manually add the remote device to the OpenView map. See Man-
ually Adding Proxied Objects on page 3-5 for general help on adding objects to the map. The following describes naming conventions and
Address/Slot specifications for the TSU Mux “e” units.
Remember the following naming conventions:
• The name of the remote device should be the name of the unit which is
connected to it via the FDL with the remote unit’s unit address appended (separated by “~”), for example, near.unit.name~25. Set the remote
device’s Address/Slot specification in the Advision Status dialog to the
unit’s address.
• To add the remote device’s option cards, add them to the Open View
map with a name constructed by appending the card’s slot and port
(separated by “~”) to the remote unit’s name (near.unit.name~unitaddress~slot~port), for example, near.unit.name~25~1~3 (for unit 25, slot
1, and port 3). Set the card’s Address/Slot specification in the Advision
Status dialog to the unit’s Interface Index. This number can be viewed
on the Interface Table dialog of the remote unit.
SNMP I/O
TIMEOUT
ERRORS
61950025L1-1 ADVISION User Manual 5-5
You may experience SNMP I/O timeout errors when applying a Total Configuration to a unit containing option cards or when applying several changes from a MIB View Configuration page. Responses from the unit can be
delayed since all changes have to be validated. To alleviate this problem, in
the OpenView SNMP Configuration Database extend the unit's timeout value (up to 20 seconds) and set its retry value to none (0). These values do not
affect ADVISION's operation until the Device view of the unit is closed and
re-opened.
Page 60

Chapter 5. Device-Specific Information
TSU MUX
OPTION CARDS
ADVISION supports the following TSU Mux option cards:
•DSU III
• Drop and Insert
•DSX-1
• Dual OCU DP
•Dual Modem
•Dual Nx56/64
•E&M
•FXO
•FXS
•Multiport DBU
• Nx56/64
• Nx56/64 DBU
•OCU DP
• Quad Modem
5-6 ADVISION User Manual 61950025L1-1
Page 61

Chapter 6
ADVISION Setup Parameters
OVERVIEW
PREFERENCES
FILES
File Entries
ADVISION’s setup parameters include preference files, environment variables,
and command line options. Preference files contain entry definitions that affect
software operation and specify certain filenames. Environment variables specify
file locations and the directories used. Command line options include run time
specifications which affect operation of the GUI. This chapter provides information on these three parameters.
ADVISION allows the installation of two .advisionrc preferences files. The
administrator may place one .advisionrc file in the ADVISION_INSTALL di-
rectory, and all users may have one in their home directory. The
ADVISION_INSTALL directory provides an example of this file.
Any options set by .advisionrc found in the home directory take
precedence over values set by the ADVISION_INSTALL preference
file.
Preferences file entries ARE case sensitive. Table 6-1 on page 6-2 lists the entry
definitions. The syntax for each option is as follows:
<option> <value>
61950025L1-1 ADVISION User Manual 6-1
Page 62

Chapter 6. ADVISION Setup Parameters
Table 6-1. Preferences File Entry Definitions
Option Value Definition
confirm TRUE = required (default)
FALSE = none required
User preference for requiring a confirmation step
after selecting a push-button control in a MIB
Viewer and before exiting ADVISION.
dir.load $HOME = default Directory from which saved configuration pages
are retrieved.
dir.save $HOME = default Directory to which configuration pages are saved.
file.errors
splash TRUE = always displayed
.advision_errors
(default)
= default Informs ADVISION where to output the error data.
The user preference for the ADVISION About window displayed at startup.
FALSE = never displayed
statistics TRUE = initially visible
(default)
The user preference for the initial display of the
statistics panel on any viewer.
FALSE = initially hidden.
:
ENVIRONMENT
VARIABLES
The environmental variables listed in Table 6-2 are entered at the command
line or within a .profile (or .bashrc, etc.) file.
Table 6-2. Environmental Variables
Option Definition
ADVISION_FILE_ERRS Tells ADVISION where to output the error data, other than
.advision_errors.
ADVISION_INSTALL Directory in which the ADVISION files are installed (not just the applica-
tion). This directory is defined at installation and must be correct for the
HP OpenView connection to work properly.
HOME Environment variables of the user’s home directory. This option can be
set by command line or .advisionrc file, but it is typically the $HOME
environment variable. This is a mandatory variable and is required for
ADVISION to run. In most cases, $HOME is defined by the system for the
user, so no additional action is required.
6-2 ADVISION User Manual 61950025L1-1
Page 63

Chapter 6. ADVISION Setup Parameters
COMMAND
LINE OPTIONS
Option Definition
-error_file=<filename>
-ovw
-server
Database
Server (advdb)
Changing the Number
of Supported Objects
This information is provided only for reference purposes. The command line
options listed in Table 6-3 supersede all other options and are entered when
typing the ADVISION command.
The database base server, as a default, supports 10,000 ADTRAN objects including IP-addressable units, proxied units, and their option cards. If the
maximum supported value is reached, the daemon exits with an error message stating that maximum number of objects has been reached.
To change the number of supported objects, edit the advdb startup command in the following file to include as a command line argument “-nxxx,”
where xxxx is the number of objects to be supported:
Table 6-3. Command Line Options
Informs ADVISION of where to output the error data, other than
.advision_errors.
Required for HP OpenView integration; notifies the process to register with HP OpenView for ADTRAN object selections.
Required for HP OpenView integration; notifies process to connect
with .advdb (ADVISION database server) to identify the configuration of objects for display.
$ADVISION_INSTALL/advdb.lrf
Then, restart advdb by entering the following on the command line:
$OV_BIN/ovstart advdb
The command line argument can also be used to decrease the number of
supported objects and hence the amount of memory required by advdb.
This should only be done if the number of ADTRAN devices is known to be
small.
61950025L1-1 ADVISION User Manual 6-3
Page 64

Chapter 6. ADVISION Setup Parameters
6-4 ADVISION User Manual 61950025L1-1
Page 65

Appendix A
CSU......................................Channel Service Unit
DLCI.................................... Data Link Connection Identifier
DSU .....................................Data Service Unit
FDL...................................... Facility Data Link
FSU ...................................... Frame Relay Service Unit
HP........................................Hewlett Packard
ISU .......................................ISDN Service Unit
MIB ......................................Management Information Base
PVC......................................Permanent Virtual Circuit
SNMP .................................. Simple Network Management Protocol
TSU...................................... Terminal Service Unit
Acronyms
61950025L1-1 ADVISION User Manual A-1
Page 66

Appendix A. Acronyms
A-2 ADVISION User Manual 61950025L1-1
Page 67

Appendix B
D4 DiGroup
An ADVISION shelf that displays the FramePort 144 and 768.
daemon
A background program that runs unattended, collecting information or performing operating system
administration tasks. Some daemons activate when an event occurs while others activate at timed
intervals.
Data Link Connection Identifier (DLCI)
A group of bits in a frame relay connection’s overhead that identifies the virtual circuit or channel over
which the data is being sent to its address.
discovery
The process by which devices are added to an HP OpenView submap.
event
An occurrence or happening.
lasso
The process of selecting an area on an active window by using the left mouse button to draw a rectangular or square outline around the area.
Glossary
loadhosts
HP OpenView file that loads (adds) hosts to the IP topology database maintained by ovtopmd and
used by netmon and ipmap. Lines are read from standard input, or from the specified in-file, and are
in the format used by /etc/hosts.
Management Information Base (MIB)
Specifications containing definitions of management information so that networked systems can be
remotely monitored, configured, and controlled.
netmon
A daemon that attempts to discover nodes on the network. After it discovers a node, it polls the node
regularly to check for status, topology, configuration, and threshold changes. This daemon discovers
and polls only the nodes in the management region.
object
Object has many meanings. It can represent a logical or physical entity or resource, or a group of such
physical entities or resources that exist in a network environment. For example, an object can be an
ADTRAN device or a group of ADTRAN devices.
61950025L1-1 ADVISION User Manual B-1
Page 68

Appendix B. Glossary
permanent virtual circuit (PVC)
A dedicated (private line) channel in a multiplexed transmission or packet network.
polling
The periodic gathering of data.
proxy
A device that provides communication between two noncommunicating devices.
registration
The permanent assignment of a unique object identity to an item.
Simple Network Management Protocol (SNMP)
A protocol that communicates management information between network management stations
and the agents in the network elements.
trap
A message sent to indicate a failure or problem with a specific device.
B-2 ADVISION User Manual 61950025L1-1
Page 69

Appendix C
Installation Files
INSTALLED
FILES
The following files comprise the ADVISION install. These files are placed in the
specified directory $ADVISION_INSTALL:
FileName
Advision X-Resource file for the ADVISION (GUI)
Data_A File containing device descriptions which drives
all GUI views
Help/ Contains files for integration into the CDE Help
system
INSTALL.SH Tape Installation script (obsolete)
INSTALL_CD.SH CD Installation script
Images/ Image files for ADTRAN unit Device Views
README Text file describing new features, new product
support, etc.
advdb.lrf File to use with ovaddobj to register advdb, the
ADTRAN database server
auth.sample Sample user-authentication file
bin/ Contains executables and user-includes for login
scripts
Function
bitmaps/C/device/*.pm Bit maps defining OpenView symbols for
ADTRAN devices
conf/C/ Contains files to be added to OpenView's
oid_to_sym and oid_to_type files to prop-
erly register ADTRAN units for netmon discovery.
fields/C/Adtran.fld File to register additional OpenView database
fields required to support ADVISION
registration/*.lrf OpenView registration files for ADVISION pro-
cesses associated with an OpenView window
(map) session
snmp_mibs/*.mib ADTRAN product MIBs
61950025L1-1 ADVISION User Manual C-1
Page 70

Appendix C. Installation Files
symbols/C/Adtran.mib File used to register symbols for ADTRAN prod-
ucts with OpenView
Uninstall.sh This is an uninstall script which runs without
operator intervention (once started).
FILES AL TERED
BY
INSTALLATION
During installation, the files in the following directories are linked into the
specified OV directories.
Directory
bitmaps/ $OV_BITMAPS
conf/ $OV_CONF
fields/ $OV_FIELDS
registration/ $OV_REGISTRATION
snmp_mibs/ $OV_SNMP_MIBS
symbols/ $OV_SYMBOLS
Installation also updates the /etc/services file, with an entry for the advdb socket.
Filename
C-2 ADVISION User Manual 61950025L1-1
Page 71

Inde x
A
accessing configuration information 4-1
accessing the MIB viewer from the device viewer
4-4
activating downloaded configurations
activating the GUI
adding IP-addressable units when Open View
discovery disabled
adding IP-addressble unit to an Open View in-
stallation
adding object to HP Open View submap
adding proxied devices to submap
adding proxied units not discovered during nor-
mal discovery process
ADTRAN object status
advdb (database process)
advdis (discover process)
ADVISION
features
GUI
installing
onlilne help (UNIX only)
packing list
registration process
system requirements
using the GUI
advision (GUI process)
ADVISION Integration with HP OpenView
advstat (status process)
altering SNMP data
apply
applying a configuration
1-1
ADVISION GUI (advision)
database server (advdb)
discover (advdisc)
object status (advstat)
4-14
1-2
3-4
2-1
2-1
4-1
2-6
3-1
3-4
3-6
2-3
2-3
2-3
2-1
4-5
3-4
2-3
2-3
2-3
2-6
2-3
2-3
3-5
2-3
5-1
3-2
3-1
C
changing the ADTRAN Status value 3-7
child submap
closing the device viewer
command line options
advdb
6-3
3-2
6-3
4-6
changing the number of supported ob-
jects
-error_file=<filename>
-ovw
6-3
-server
configuration information
accessing
6-3
4-1
D
D4 DiGroup 5-2
device naming conventions
device viewer
apply configuration
close
menu bar
file
4-6
4-5
4-4
4-2
apply configuration
login
save configuration
device viewer, menu bar
device
file
modules
polling
view
window
device-specific information
discovery
IP auto-discovery
4-7
close
4-6
exit
4-6
save configuration
4-7
4-6
all polling suspend/resume
clear error
demand poll
device polling suspend/resume
hide/show statistics
reset statistics
4-6
devices
graphs
MIB viewers
reviewers
3-2
4-7
4-7
6-3
4-5
4-6
4-7
4-6
4-6
4-7
3-2
4-5
4-5
4-2
6-3
5-5
4-5
5-1
4-6
4-5
4-7
4-6
61950025L1-1 ADVISION User Manual Index-1
Page 72

Index
manual 3-3
proxied chassis
displaying statistics panel
dministrator
download sequence, terminating
DSU III DBU
2-5
5-3
3-3
4-6
4-5
E
entering data into text fields 4-16
environemental variables
ADVISION_FILE_ERRS
ADVISION_INSTALL
HOME
errors, I/O
exiting the device viewer
6-2
4-6
6-2
4-6
6-2
6-2
F
FramePort 144 and 768 5-2
accessing network information
displaying installed cards
provisioning options
5-3
5-2
5-2
G
get error dialog box 5-2
graph viewer
graph viewer, menu bar
file
graph viewer, title bar
graph viewer, variable selection dialog
graph viewer,graph data area
axis lables
data lables
error dialogs
progress dialog
resizing/scaling
return to default
scales
translation
window resize
zooming
GUI
1-1
GUI, activating
4-16
4-17
4-18
close
4-18
exit
4-18
export data
login
GET error
initialization error
viewer creation warning
4-19
4-18
4-19
4-20
4-20
4-20
4-1
4-20
4-18
4-20
4-19
4-20
4-20
4-17
4-20
4-21
4-19
4-20
H
hide/show statistics 4-6
4-18
4-6
1-1, 3-1
1-2
1-2
1-3
hiding statistics panel
HP
1-2
HP Open View
HP OpenView
description
features
maps/submaps
symbols
1-2
1-2
colors, meaning of
I
I/O errors 4-6
installing ADVISION
IP auto-discovery
IP host table
IQ units
applying performance data interval settings
including the IP Host table
prior to revision 3.22
retrieving large sets of performance data
revision 3.22 and later
specifying a new PVC
IQ Units later than v 3.22
IQ units prior to v 3.22
5-2
5-1
5-2
applying SNMP configuration modifica-
tions
downloading configurations
applying configuration modifications
updating PVC performance monitoring
configurations
3-2
5-1
2-1
5-1
5-2
5-2
5-2
5-2
5-1
L
log-in 2-3
dialog box
login dialog box
activating
changing user accounts
login privilege file
sample file
privilege levels
None
ReadOnly
ReadWrite
2-4
2-4
2-4
2-4
2-5
2-4
2-4
2-5
2-5
M
manual discovery 3-3
maps/submaps
MIB reviewer
SNMP data area
MIB reviewer, menu bar
file
4-15
1-2
4-16
4-15
5-2
5-2
Index-2 ADVISION User Manual 61950025L1-1
Page 73

Index
close 4-15
exit
4-15
load
4-15
login
4-15
save
4-15
page
4-15
window
MIB reviewer, SNMP data area
pull-down menus
push buttons
scales
text fields
toggle boxes
MIB reviewer, title bar
MIB viewer
get error dialog box
IQ Units later than v 3.22
IQ Units Prior to v 3.22
system information
MIB viewer, command buttons
cancel
done
revert
MIB viewer, device image
MIB viewer, menu bar
file
MIB viewer, SNMP data area
push buttons
scales
text fields
toggle boxes
MIB viewer, statistics panel
numeric fields
push-button indicators
MIB viewer, table index selectors
MIB-II system parameters, updating
MIBs
3-1
4-11
close
load
login
save
N1
N2
N3
N4
PB1
PB2
PB3
PB4
4-16
4-14
4-14
4-14
4-13
4-9
4-10
4-10
4-10
4-15
4-16
4-10
4-13
4-12
4-12
4-12
4-13
4-8
4-8
4-9
4-9
4-16
4-16
4-13
4-14
4-9
4-16
4-14
5-2
5-1
5-2
5-1
4-14
4-2
4-13
4-7, 4-14
4-14
N
naming conventions, device 5-5
4-5
O
object status 3-6
online help (UNIX only)
Open View
1-1, 3-1
2-6
P
placing ADTRAN objects on the map 3-4
polling
demanding
resuming
suspending
preferences file
file entries
confirm
dir.load
dir.save
file.errors
splash
statistics
preferences files
file entries
proxied chassis
manually deleting
proxied devices
4-7
6-2
6-1
4-6
4-7
6-1, 6-2
6-2
6-2
6-2
6-2
6-1
3-3
3-2
3-3
R
rediscovery
IP address
procedure for
when adding new cards
removing a device card (Smart 16/16e shelf)
removing objects
resizing table columns and rows
resume polling
reviewing and modifying MIB views
3-3
4-7
3-3
3-3
3-3
4-24
4-14
S
saving a configuration 4-5
setting up ADVISION
command line options
environmental variables
preference files
Smart 16/16(e) Shelf
SNMP I/O timeout errors
Smart 16/16e Shelf
removing a device card
SNMP configuration modifications for IQ units
1
SNMP I/O timeout errors
specifying a new PVC
statistics panel
displaying
hiding
4-6
4-6
6-1
5-3
5-2
6-3
5-5
6-2
5-3
5-3
5-3
5-
61950025L1-1 ADVISION User Manual Index-3
Page 74

Index
returning error indicator to normal 4-6
submap
child
3-2
supported devices
suspend polling
symbols, and unit status
system information (MIB viewer)
system requirements
4-7
5-1
2-1
3-3
T
T3SU 300 5-4
table viewer
table data area
table viewer, menu bar
file
polling
window
table viewer, table data area
error dialogs
4-21
4-23
4-21
4-22
close
4-23
exit
4-23
export data
login
4-23
all polling suspend/resume
device polling suspend/resume
reconfigure
refresh
4-23
GET Error
4-22
4-23
4-24
4-22
4-23
4-24
5-1
4-23
4-23
initialization error
viewer creaton warning
lables
4-23
progress dialog
rown/column resize
window resize
table viewer, title bar
table viewer, variable selection dialog
technical support
terminating a download sequence
TSU 100, 120, & 600
TSU 100e, 120e, & 600e
TSU mux limitations
TSU mux option cards
TSU, IP auto-discovery
2-1
4-23
4-24
5-4
5-5
4-21
5-4
5-6
3-3
4-24
4-24
4-24
4-5
U
unit status and symbols 3-3
units supported by ADVISION
updating MIB-II system parameters
using ADVISION
using ADVISION GUI
using push buttons
using scales
4-16
2-1
4-16
2-6
5-1
V
variable selection dialog 4-18
4-5
4-23
Index-4 ADVISION User Manual 61950025L1-1
Page 75

ADTRAN Support
General Information
ADTRAN Home Page
ADTRAN T echnical Support
(800) 9ADTRAN
http://www.adtran.com
Phone: (888) 4ADTRAN
E-mail: support@adtran.com
Page 76

 Loading...