

Page 1
PRELIMINARY
SECTION 7
Installing and Using the
AdminManager Software
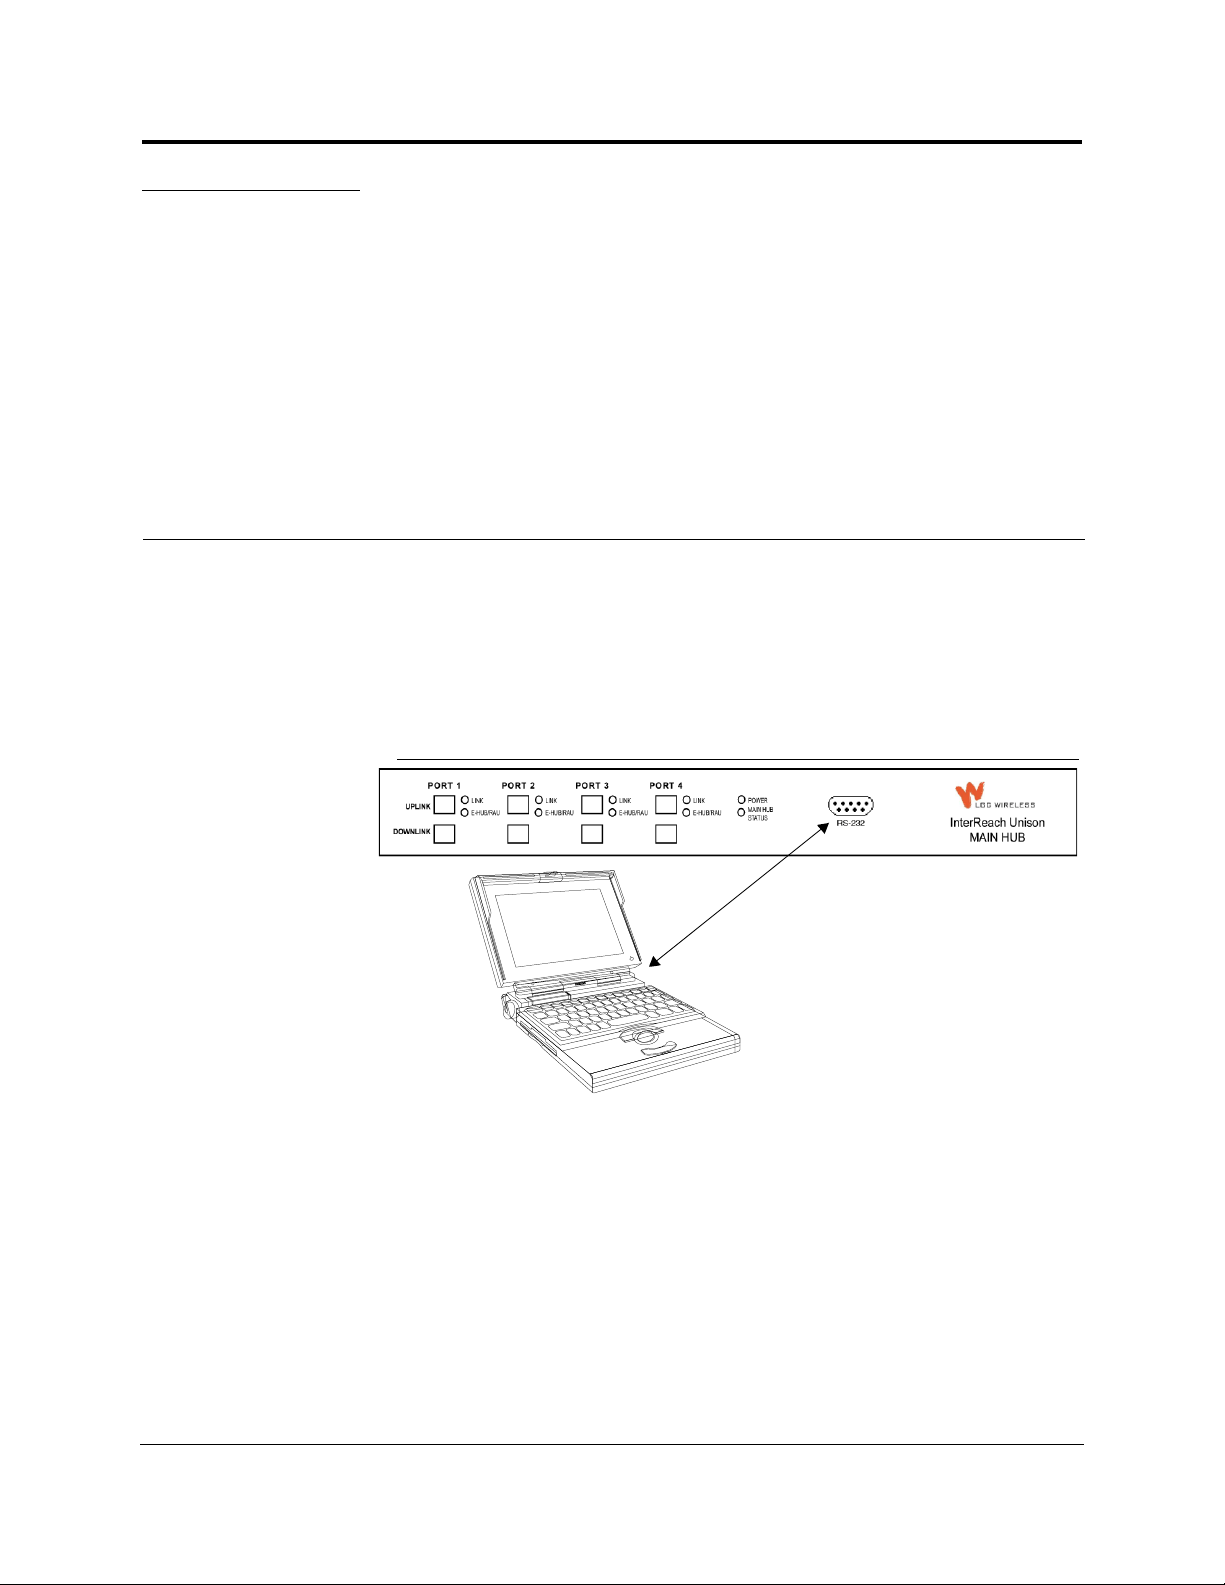
The AdminManager software is used to install, configure, and maintain the Unison
system from a PC or laptop that you connect directly to a Main Hub’s front panel
serial port.
You can use the AdminManager to remotely view system status by connecting a PC
or laptop to the Unison system via a dialup modem.
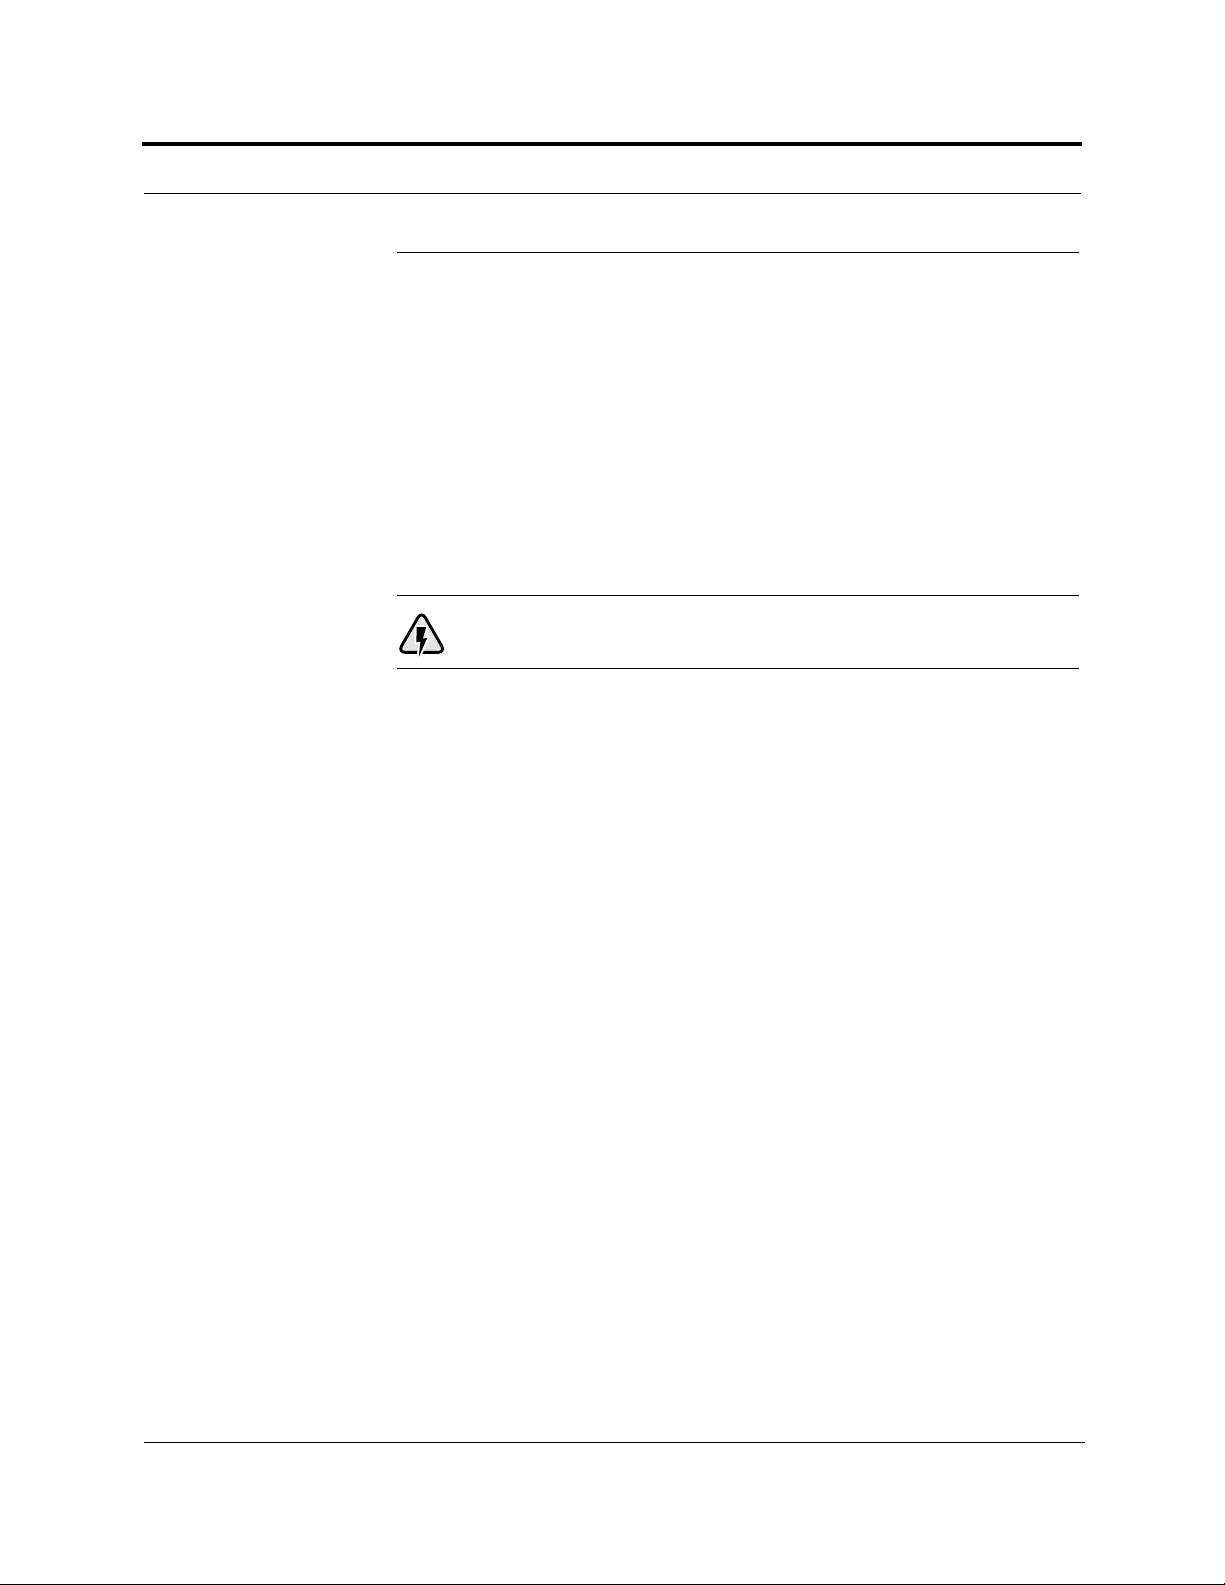
Figure 7-1 PC Connected to Main Hub
PN 8700-10 InterReach Unison User Guide and Reference Manual 7-1
620003-0 Rev. A
Page 2

Installing and Using the AdminManager Software PRELIMINARY
7.1 Installing the AdminManager Softwar e
7.1.1 PC/Laptop Requirements
• Op erat i ng Sy st em:
• Windows 2000 Professional (recommended)
• Windows 98 SE with IE 5.0
• 1 Communication Port (COM1–COM4)
• 133 MHz or higher Pentium-compatible CPU
• 64 MB memory (Windows 2000) or 32 MB (Windows 98 SE)
• At least 150 MB free disk space
• VGA or higher resolution
• Standard 9600 Modem
•CD-ROM drive
• DB-9 female-to-DB-9 female NULL modem cable
7-2 InterReach Unison User Guide and Reference Manual
PN 8700-10
620003-0 Rev. A
Page 3
PRELIMINARY PC/Laptop Requirements
Installing AdminManager
Install the AdminManager software on a PC/laptop that meets the requirements as
described in Section 7.1.1.
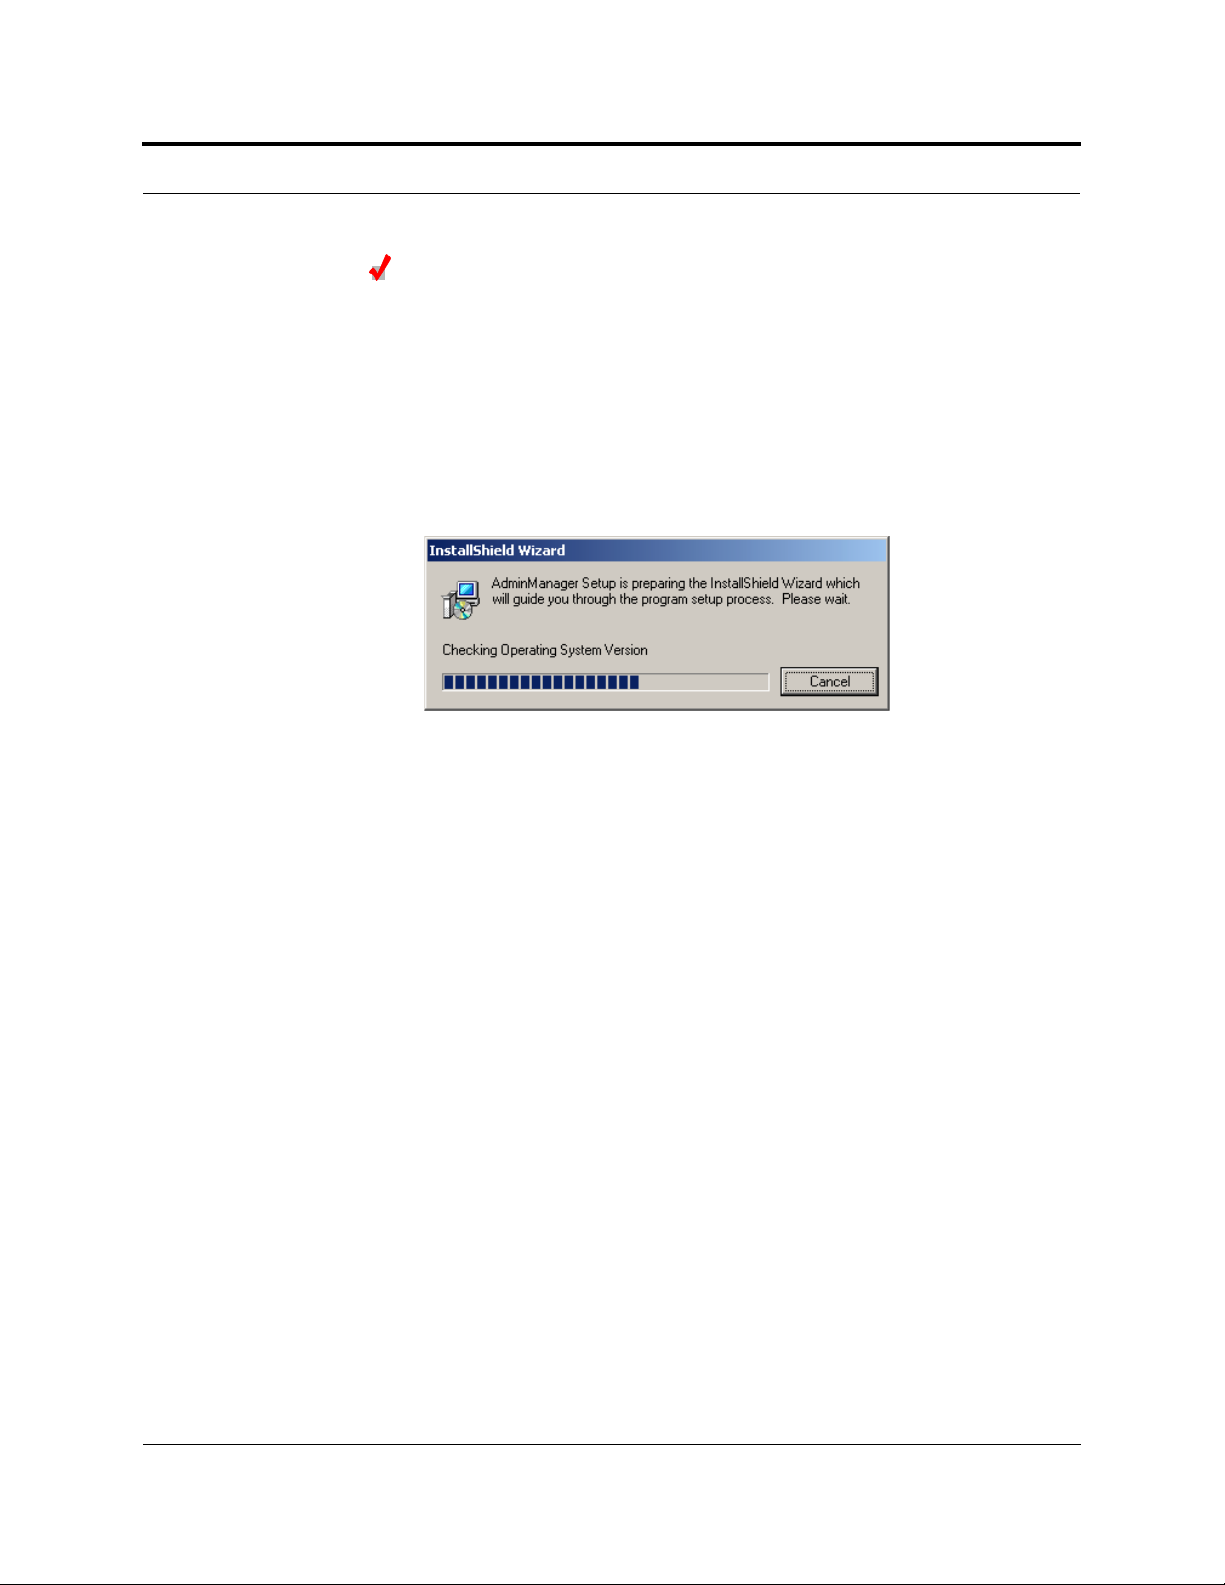
1. Turn on the PC/laptop and insert the AdminManager CD into the PC/laptop’s CD
drive.
setup.exe should automatically start. If it does not, double-click “setup.exe” on
the CD-ROM.
The following pop-up window is displayed while InstallShield checks the PC’s
system.
PN 8700-10 Help Hot Line (U.S. only): 1-800-530-9960 7-3
620003-0 Rev. A
Page 4
Installing and Using the AdminManager Software PRELIMINARY
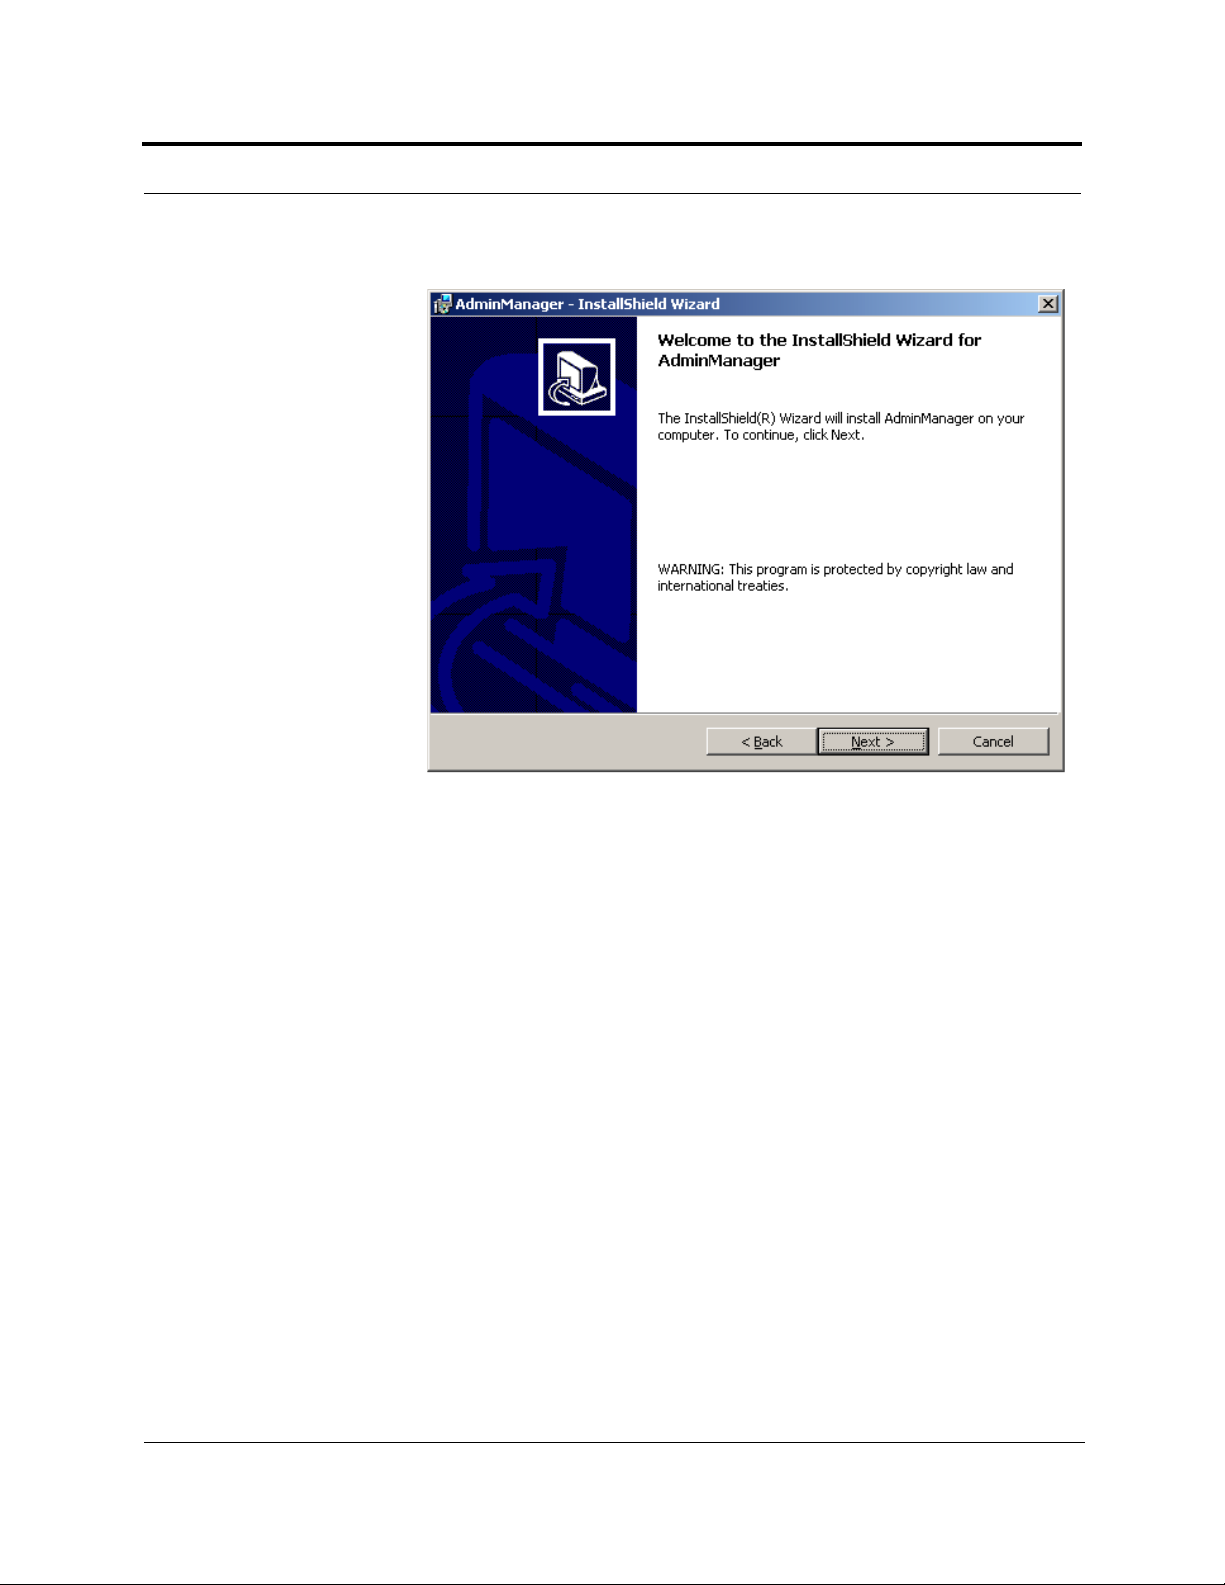
The Welcome to InstallShield Wizard window is displayed.
2. Click the NEXT button to begin the AdminManager installation.
7-4 InterReach Unison User Guide and Reference Manual
PN 8700-10
620003-0 Rev. A
Page 5
PRELIMINARY PC/Laptop Requirements
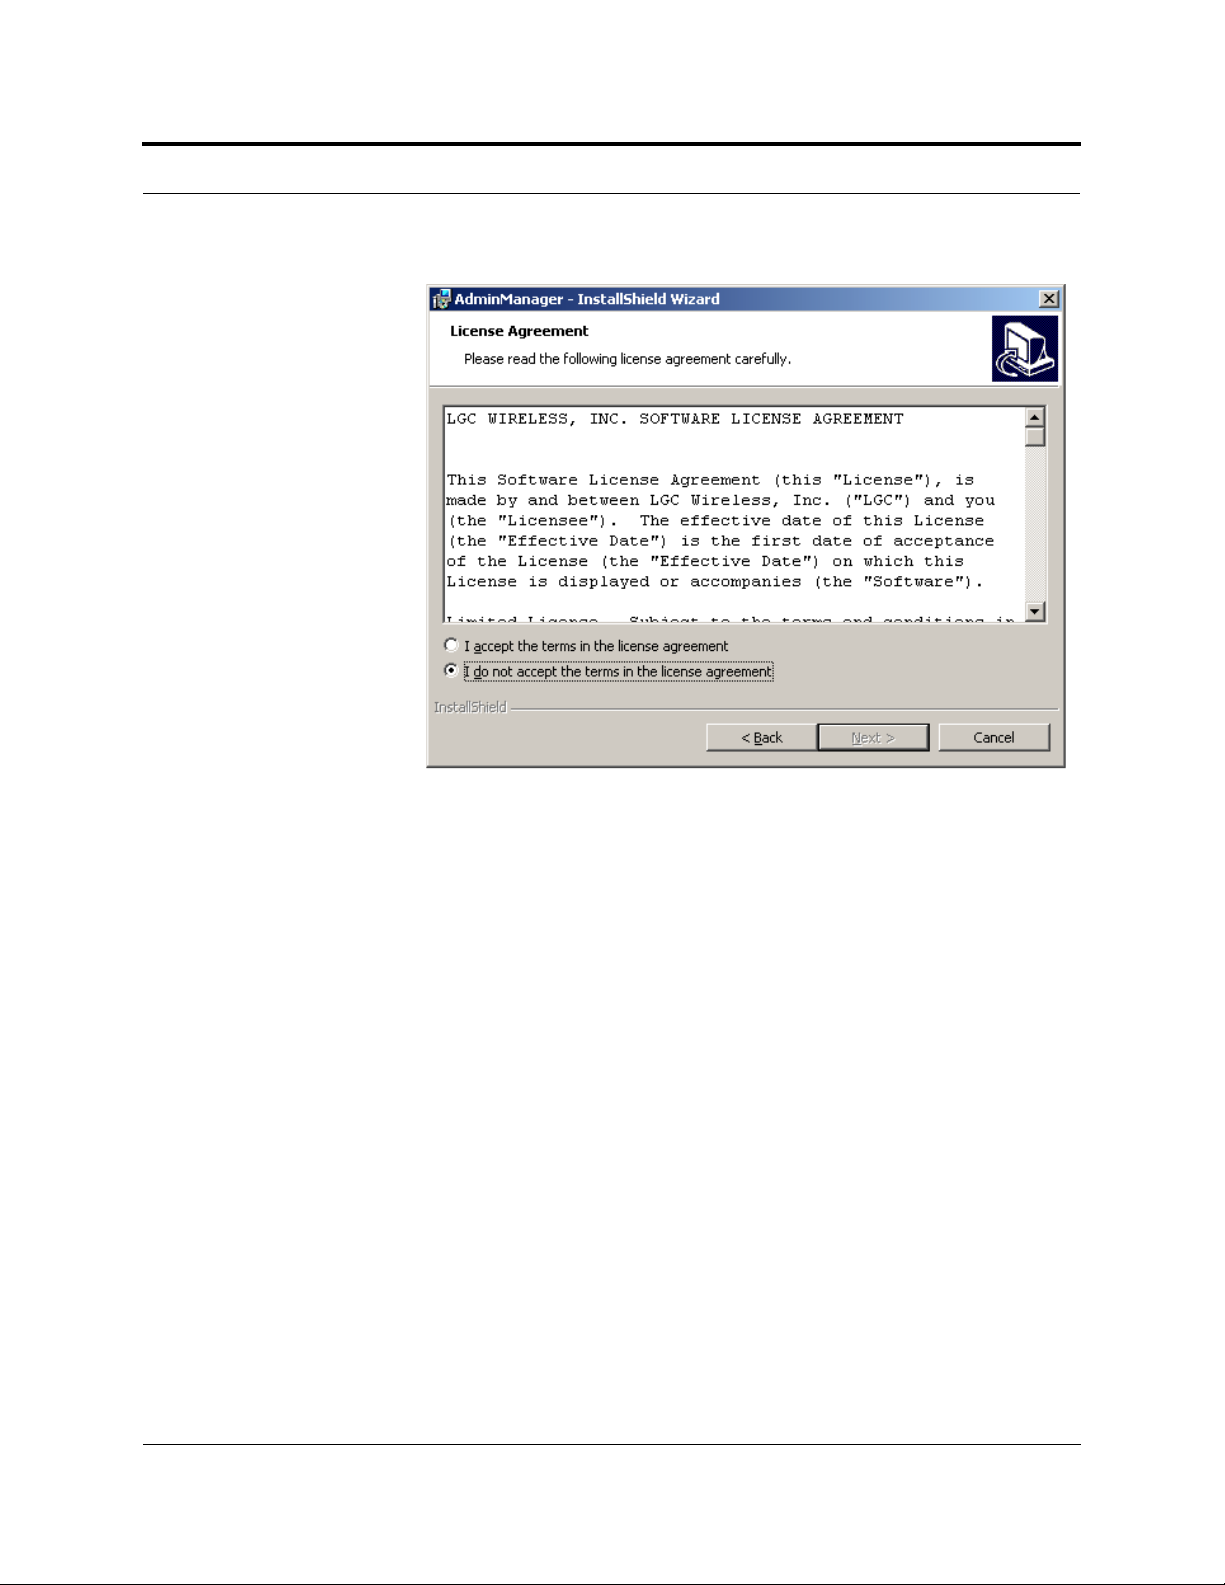
The License Agreement window is displayed.
If you select the “I do not accept” radio button, the InstallShield W izard s tops and
the windows close.
PN 8700-10 Help Hot Line (U.S. only): 1-800-530-9960 7-5
620003-0 Rev. A
Page 6
Installing and Using the AdminManager Software PRELIMINARY
3. Read the agreement and select the “I accept” radio button, and then click the NEXT
button.
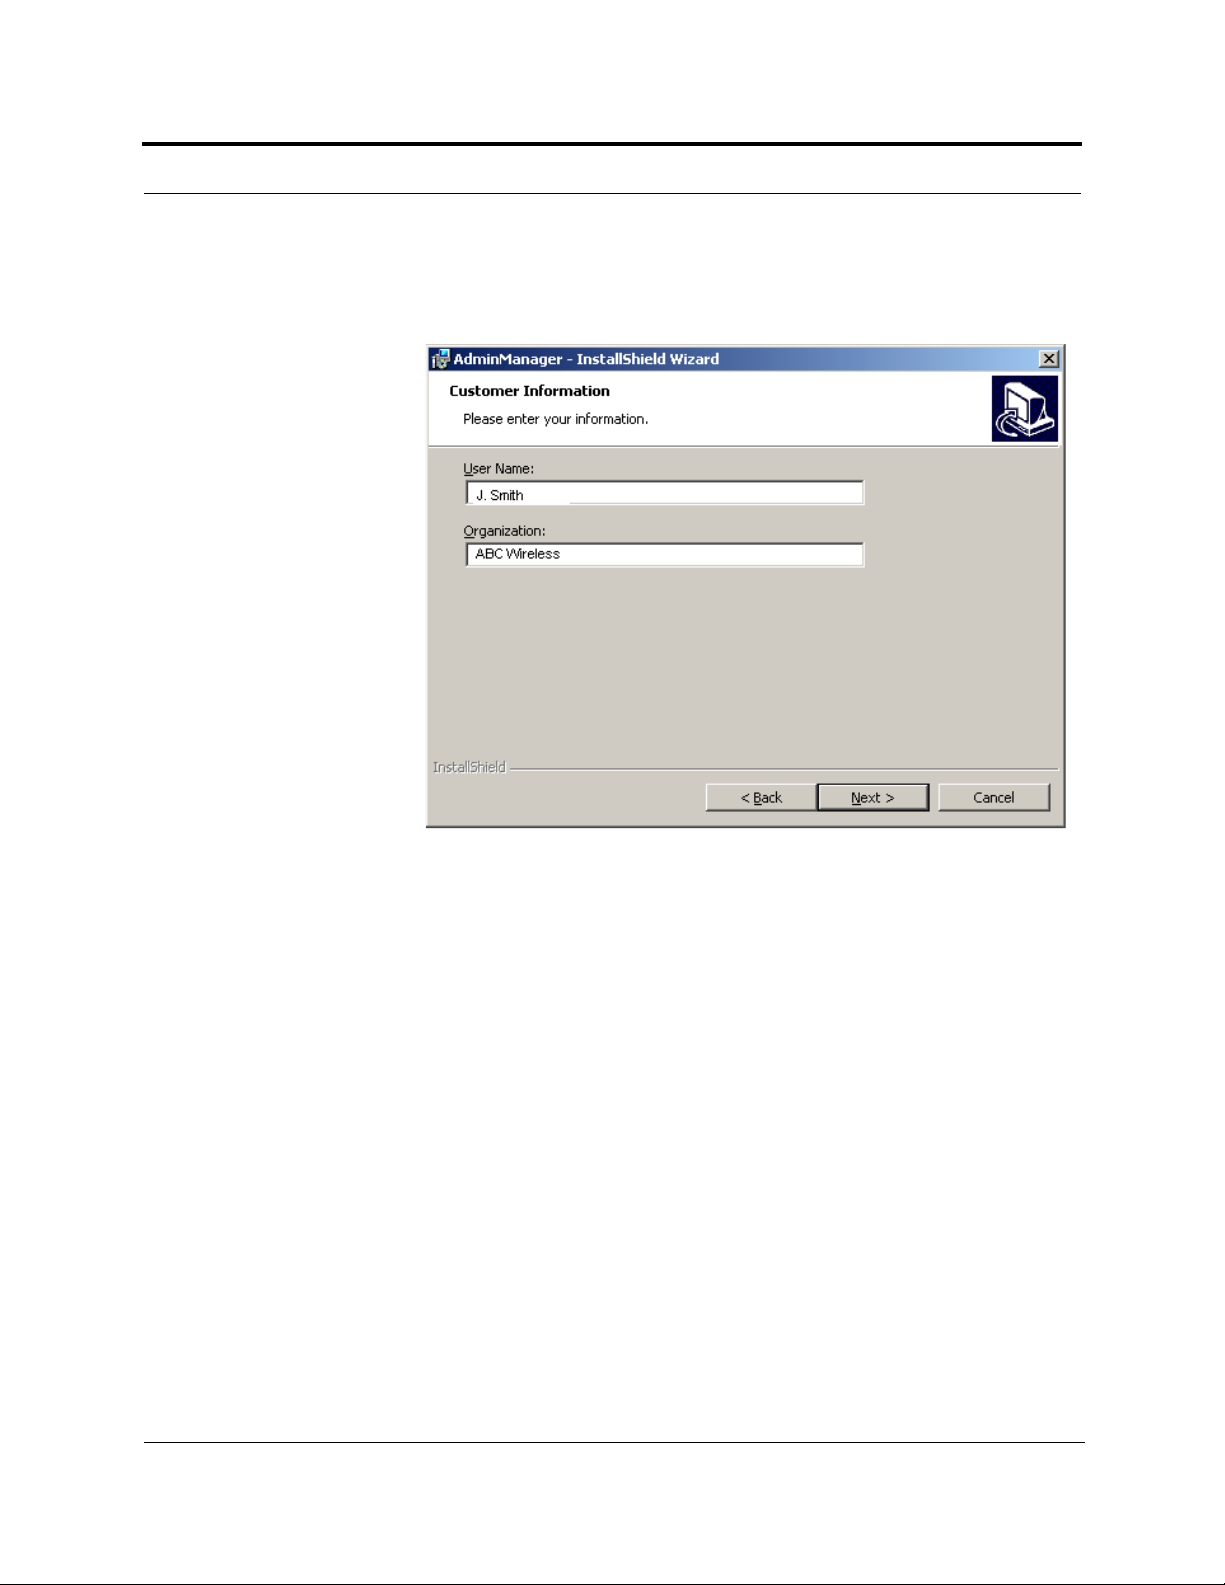
The Custom er Information window is displayed.
7-6 InterReach Unison User Guide and Reference Manual
PN 8700-10
620003-0 Rev. A
Page 7
PRELIMINARY PC/Laptop Requirements
4. Enter a User Name and Organization in the text boxes, and then click the NEXT
button.
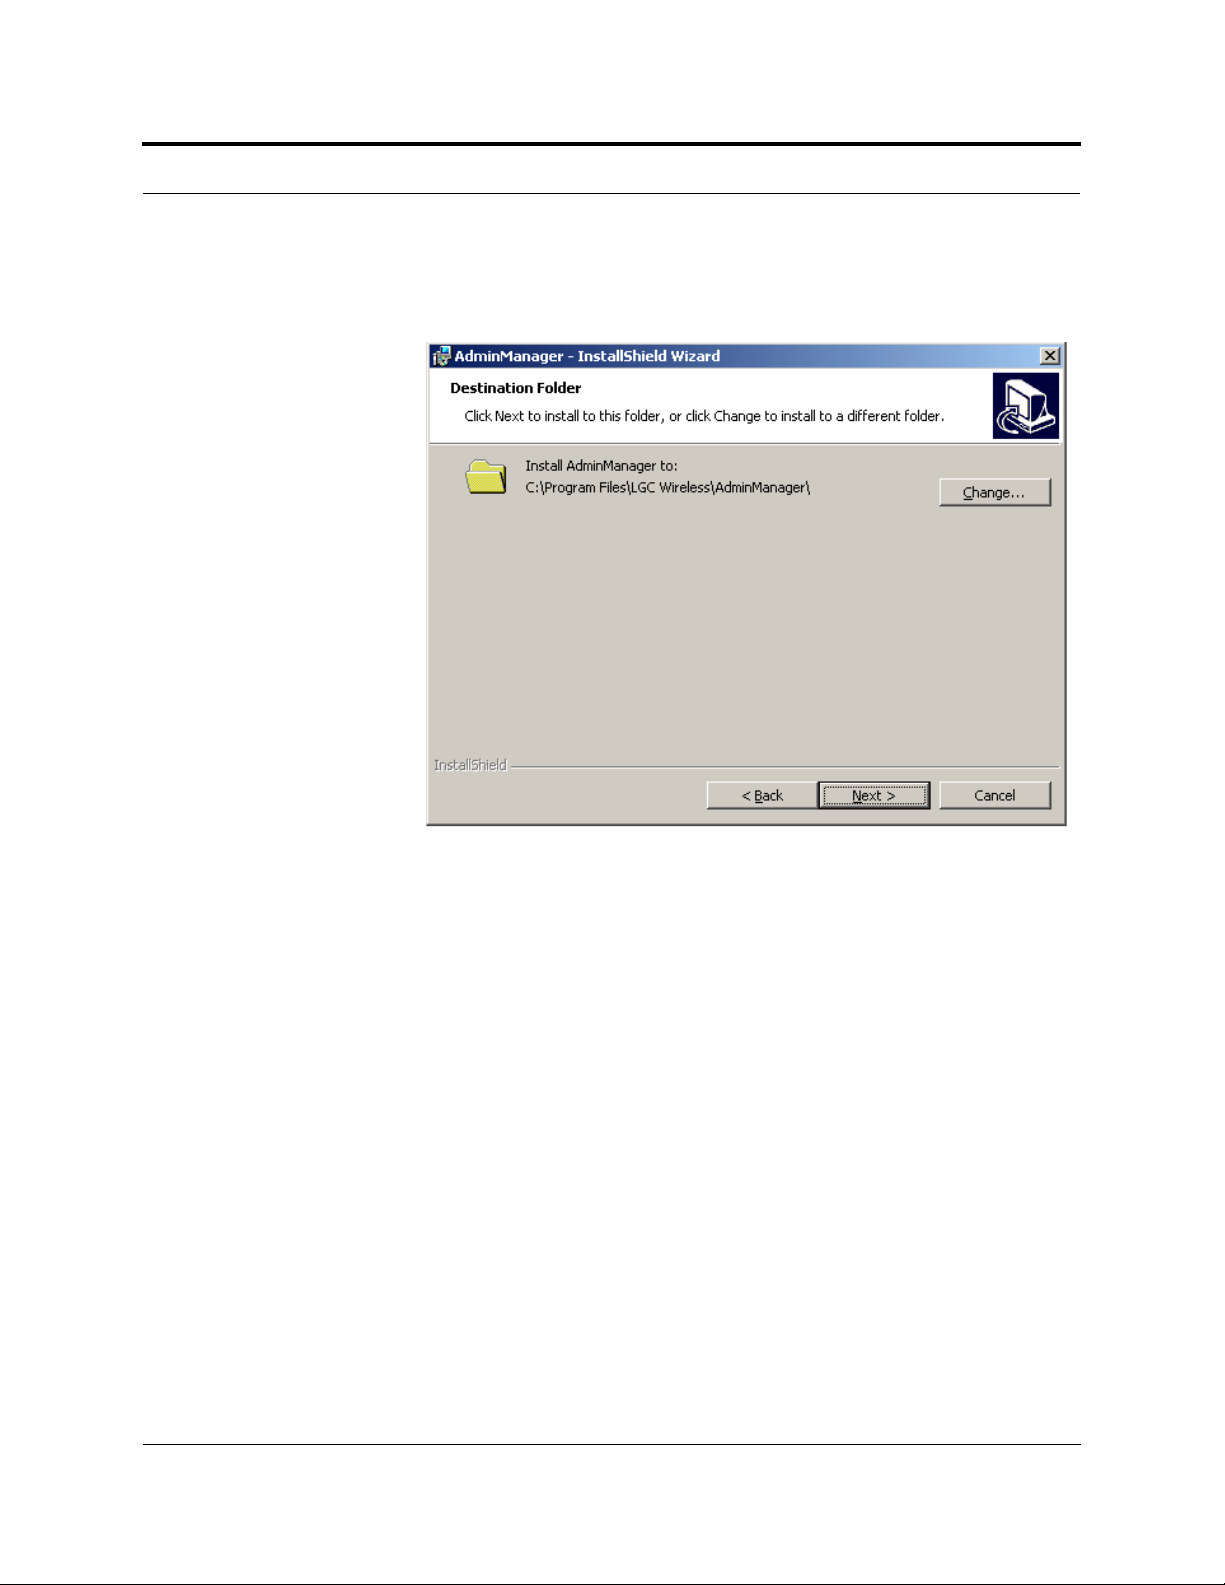
The Destination Folder window is displayed
PN 8700-10 Help Hot Line (U.S. only): 1-800-530-9960 7-7
620003-0 Rev. A
Page 8
Installing and Using the AdminManager Software PRELIMINARY
5. Click the NEXT button to accept the default destination.
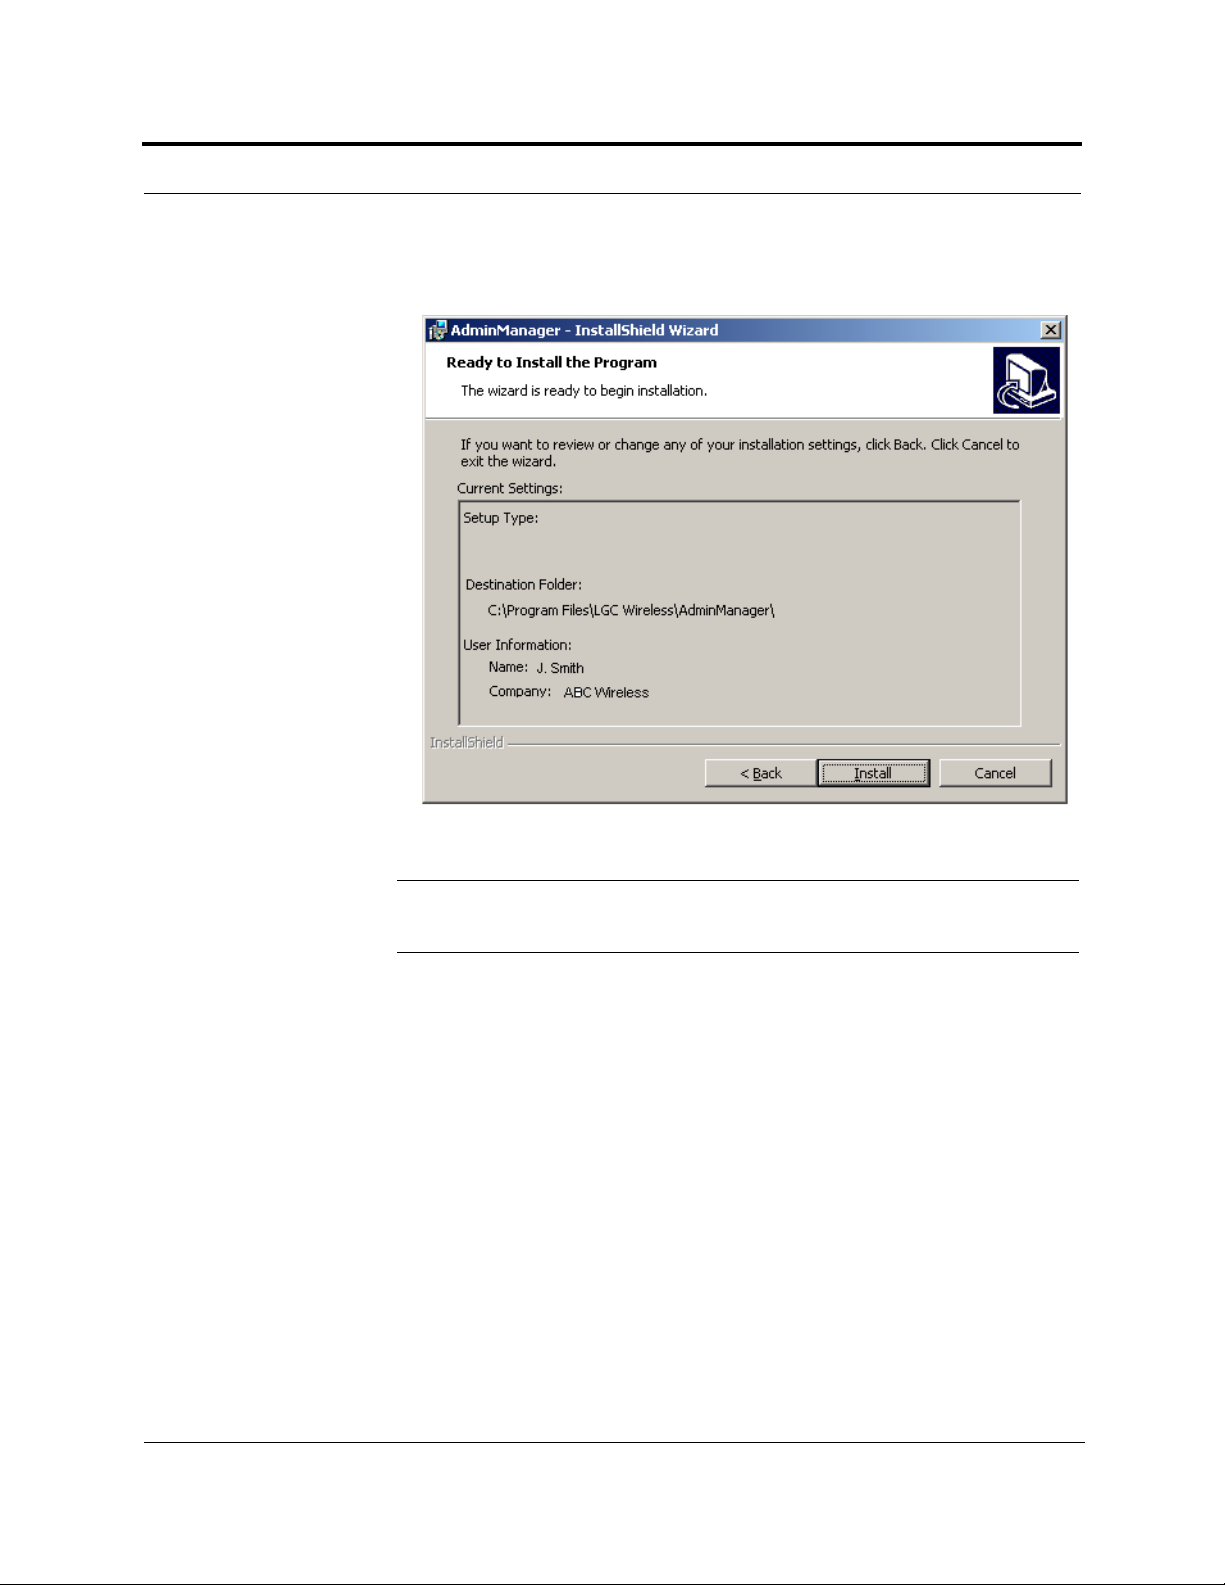
The Ready to Install the Program window is displayed.
NOTE: To change information that is displayed in the Ready to Install the Program
window, click the BACK button and make changes in previous windows.
7-8 InterReach Unison User Guide and Reference Manual
PN 8700-10
620003-0 Rev. A
Page 9
PRELIMINARY PC/Laptop Requirements
6. Click the INSTALL button if the information that is displayed in the Ready to Install
the Program window is correct.
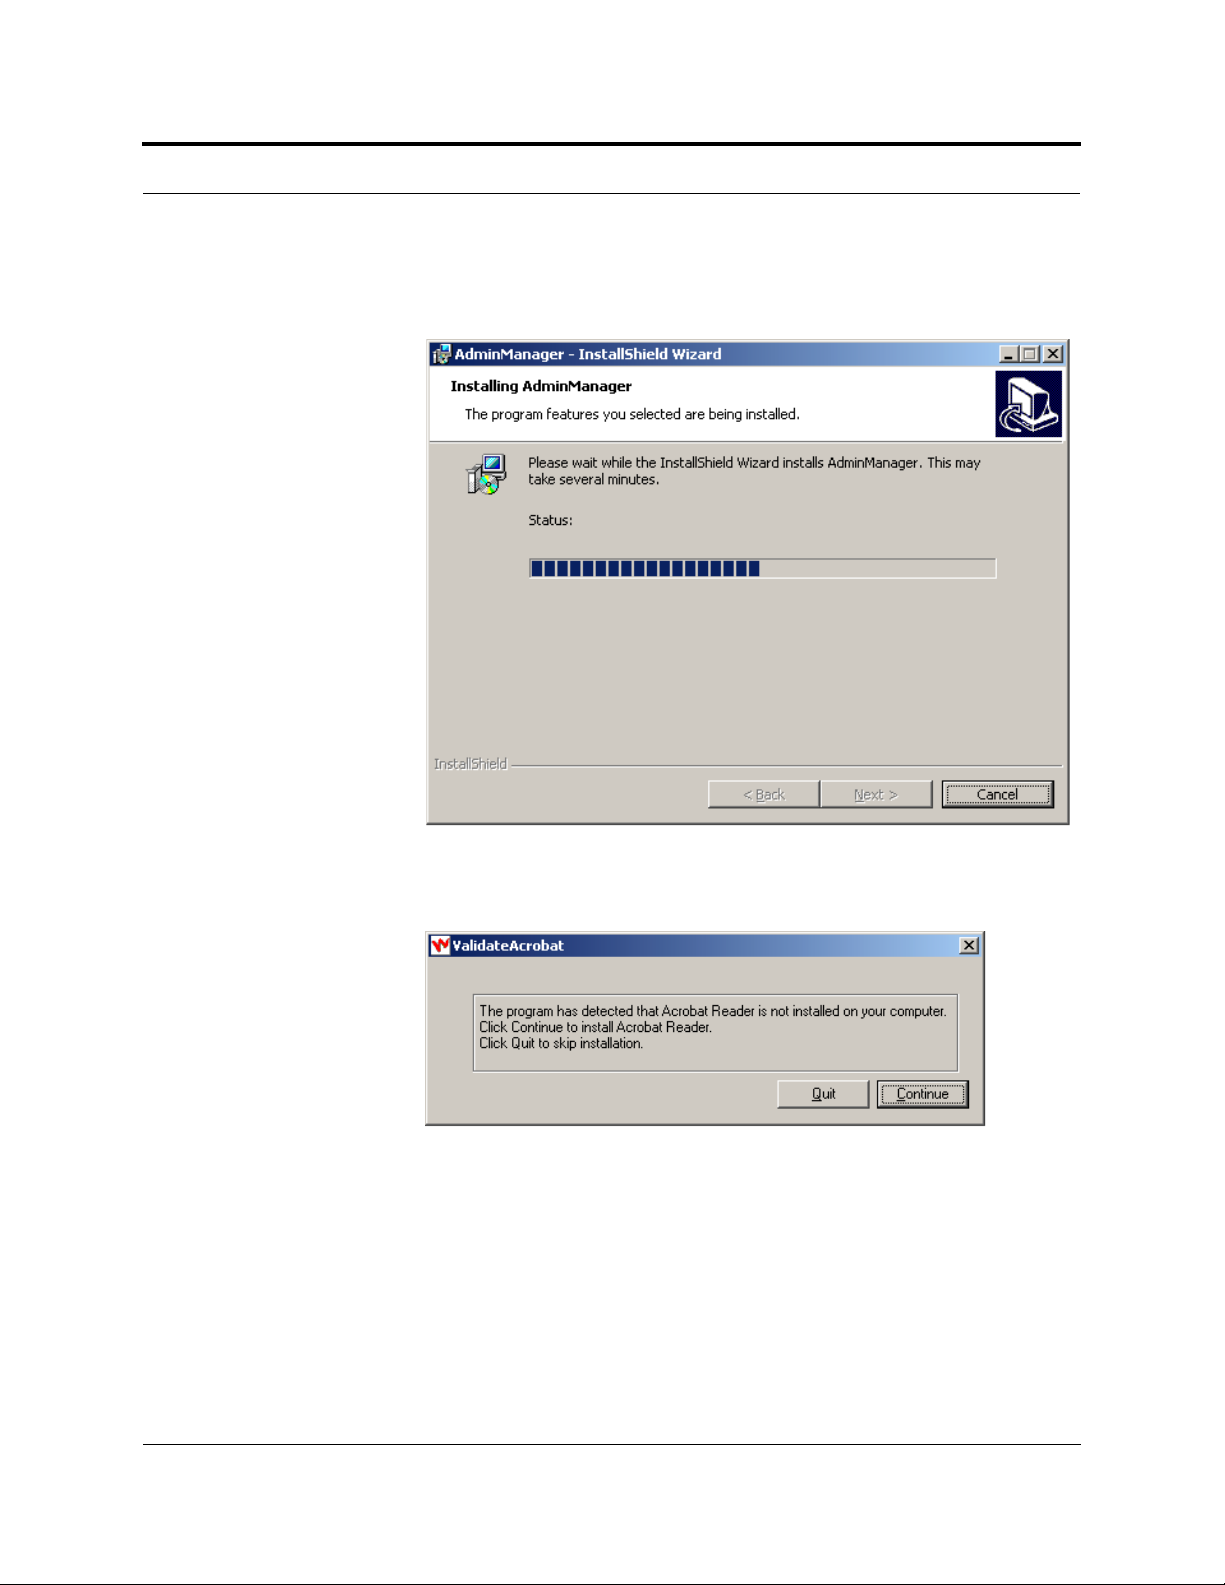
The Installing AdminManager window is displayed.
PDF files are used for Help. If the InstallShield Wizard detects that the PC does
not have software for viewing PDF files, the following pop-up is displayed.
• Click
• Click
CONTINUE to install Acrobat Reader from the CD onto your PC.
QUIT to skip the installation of Acrobat Reader.
PN 8700-10 Help Hot Line (U.S. only): 1-800-530-9960 7-9
620003-0 Rev. A
Page 10
Installing and Using the AdminManager Software PRELIMINARY
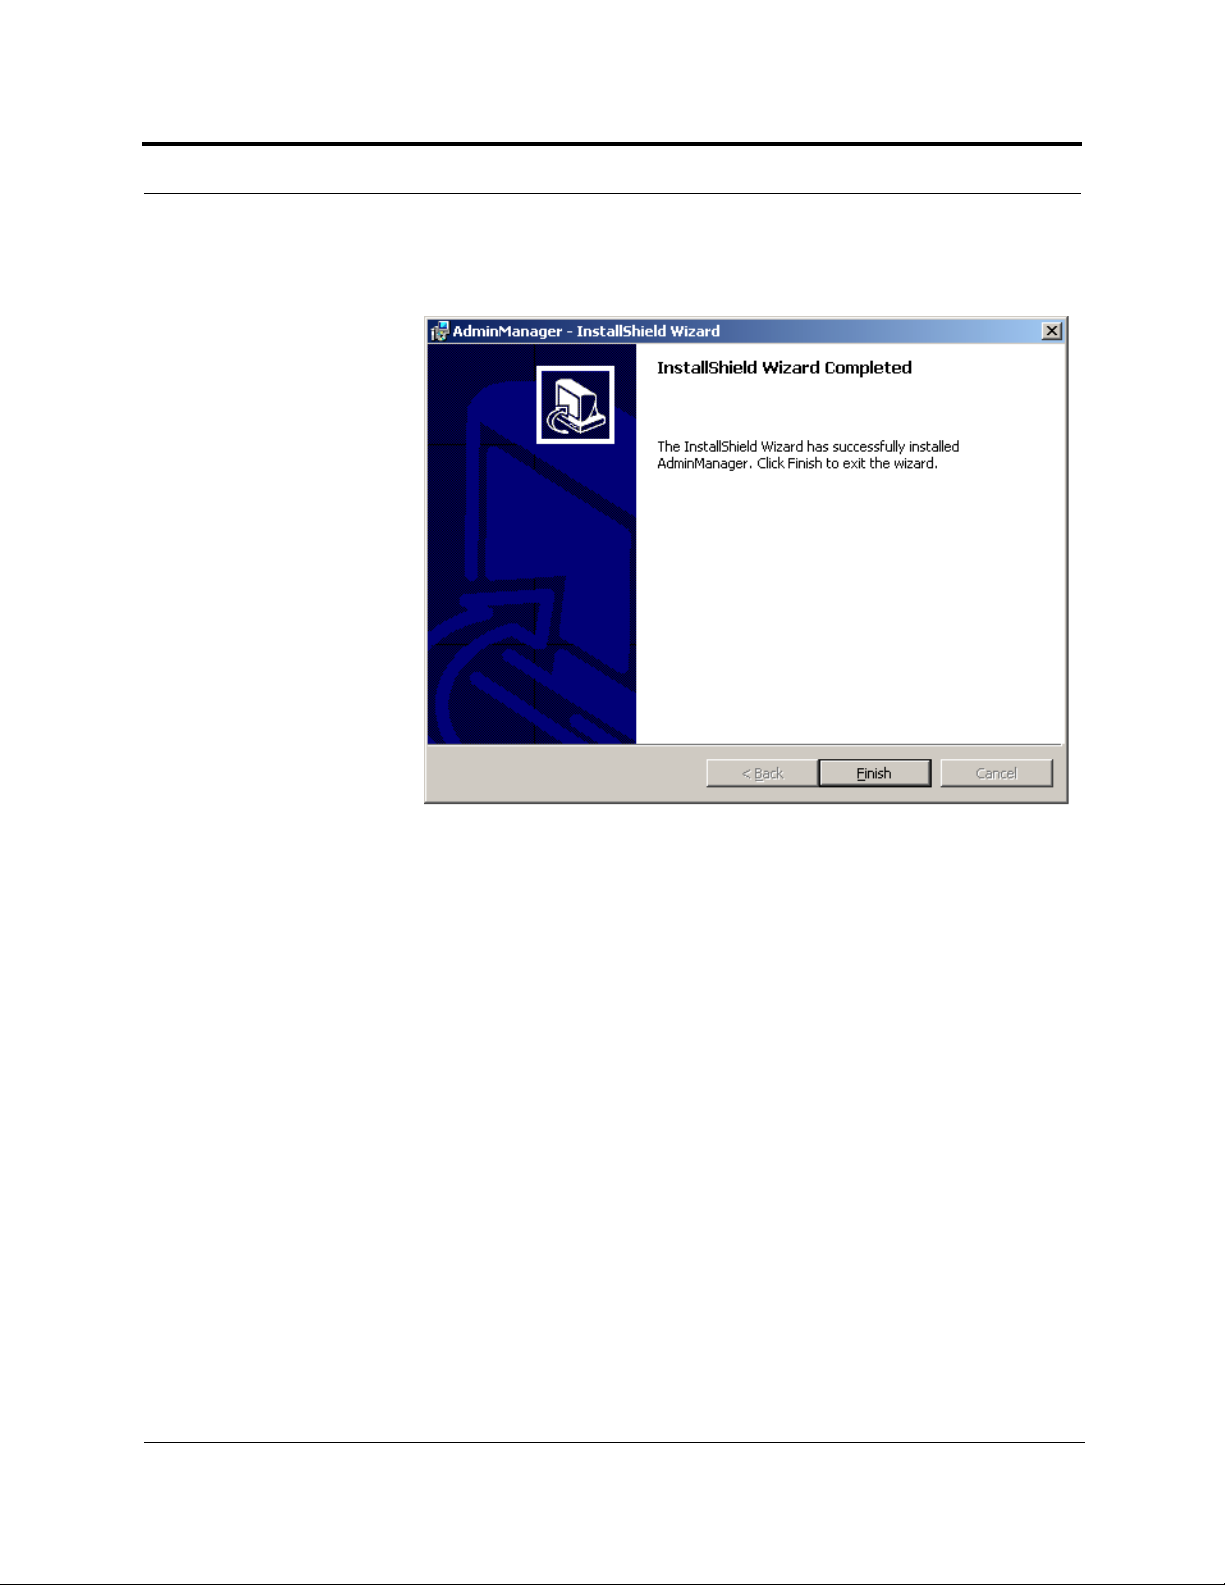
When the installation is finished, the InstallShield Wizard Completed window is
displayed.
7. Click the FINISH button to end the InstallShield Wizard session and close the win-
dow.
An AdminManager shortcut is added to your PC’s Start menu and an icon is
added to your desktop.
7-10 InterReach Unison User Guide and Reference Manual
PN 8700-10
620003-0 Rev. A
Page 11
PRELIMINARY PC/Laptop Requirements
Starting AdminManager
1. Using the NULL modem cable, connect the PC/laptop to the Main Hub’s front
panel RS-232 connector.
2. Turn on the power to the Main Hub, if it is not already on.
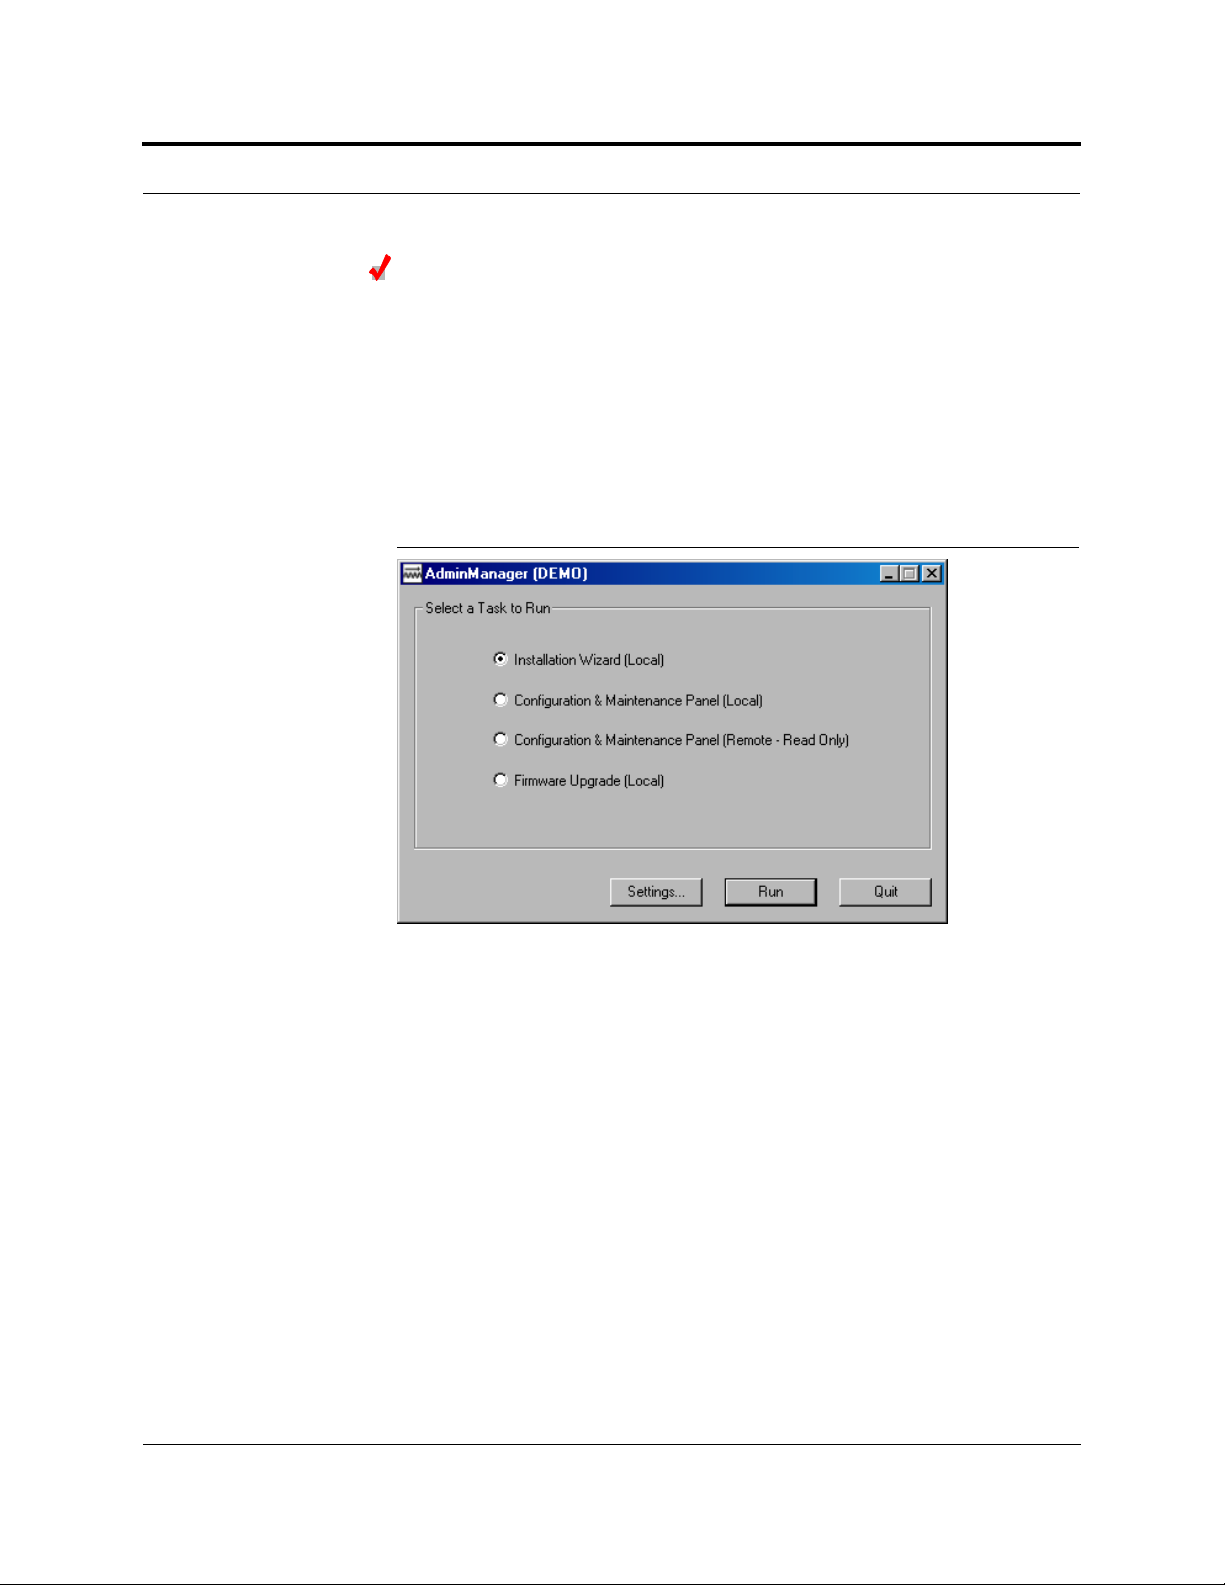
3. Double-click the AdminManager icon to start the software.
Alternately, you can click the Start button that is on the PC’s taskbar, click Programs, click AdminManager, and then click the AdminManager application.
The following window is displayed when AdminManager starts.
Figure 7-2 AdminManager Start Window
You can display the AdminManager User Guide at any time while the software is
running by pressing the F1 key.
PN 8700-10 Help Hot Line (U.S. only): 1-800-530-9960 7-11
620003-0 Rev. A
Page 12
Installing and Using the AdminManager Software PRELIMINARY
AdminManager Operation Modes
You can choose one of four operation modes from the AdminManager Start window.
• Section7.2 Installation Wizard . . . . . . . . . . . . . . . . . . . . . . . . . . . . . . . . . . 7-13
Select this option when you are installing a system or a Main Hub fo r the first time.
Also, when you are replacing a Main Hub select this option to set the frequency
band.
• Section7.3 Configuration & Maintenance Panel . . . . . . . . . . . . . . . . . . . 7-25
• Section7.3.2 Options when Connected Locally . . . . . . . . . . . . . . . . . . 7-29
Select this option when you want to perform s pecific tasks, su ch as perform the
system test and set system parameters, or check the status of an operating system. All options are available when you are connected locally.
• Section7.3.3 Read-Only Options when Connected Remotely . . . . . . . 7-34
The Configuration Panel is displayed in a read-only state. When you are connected remotely there are a limited number of o ptions available. The option s let
you check the status of the system and determine if a site visit is required. (This
is the only operation mode you can choose when you are connected remotely.)
• Section7.4 Upgrading Firmware . . . . . . . . . . . . . . . . . . . . . . . . . . . . . . . . 7-38
Select this option when you are upgrading a component’s firmware.
Buttons
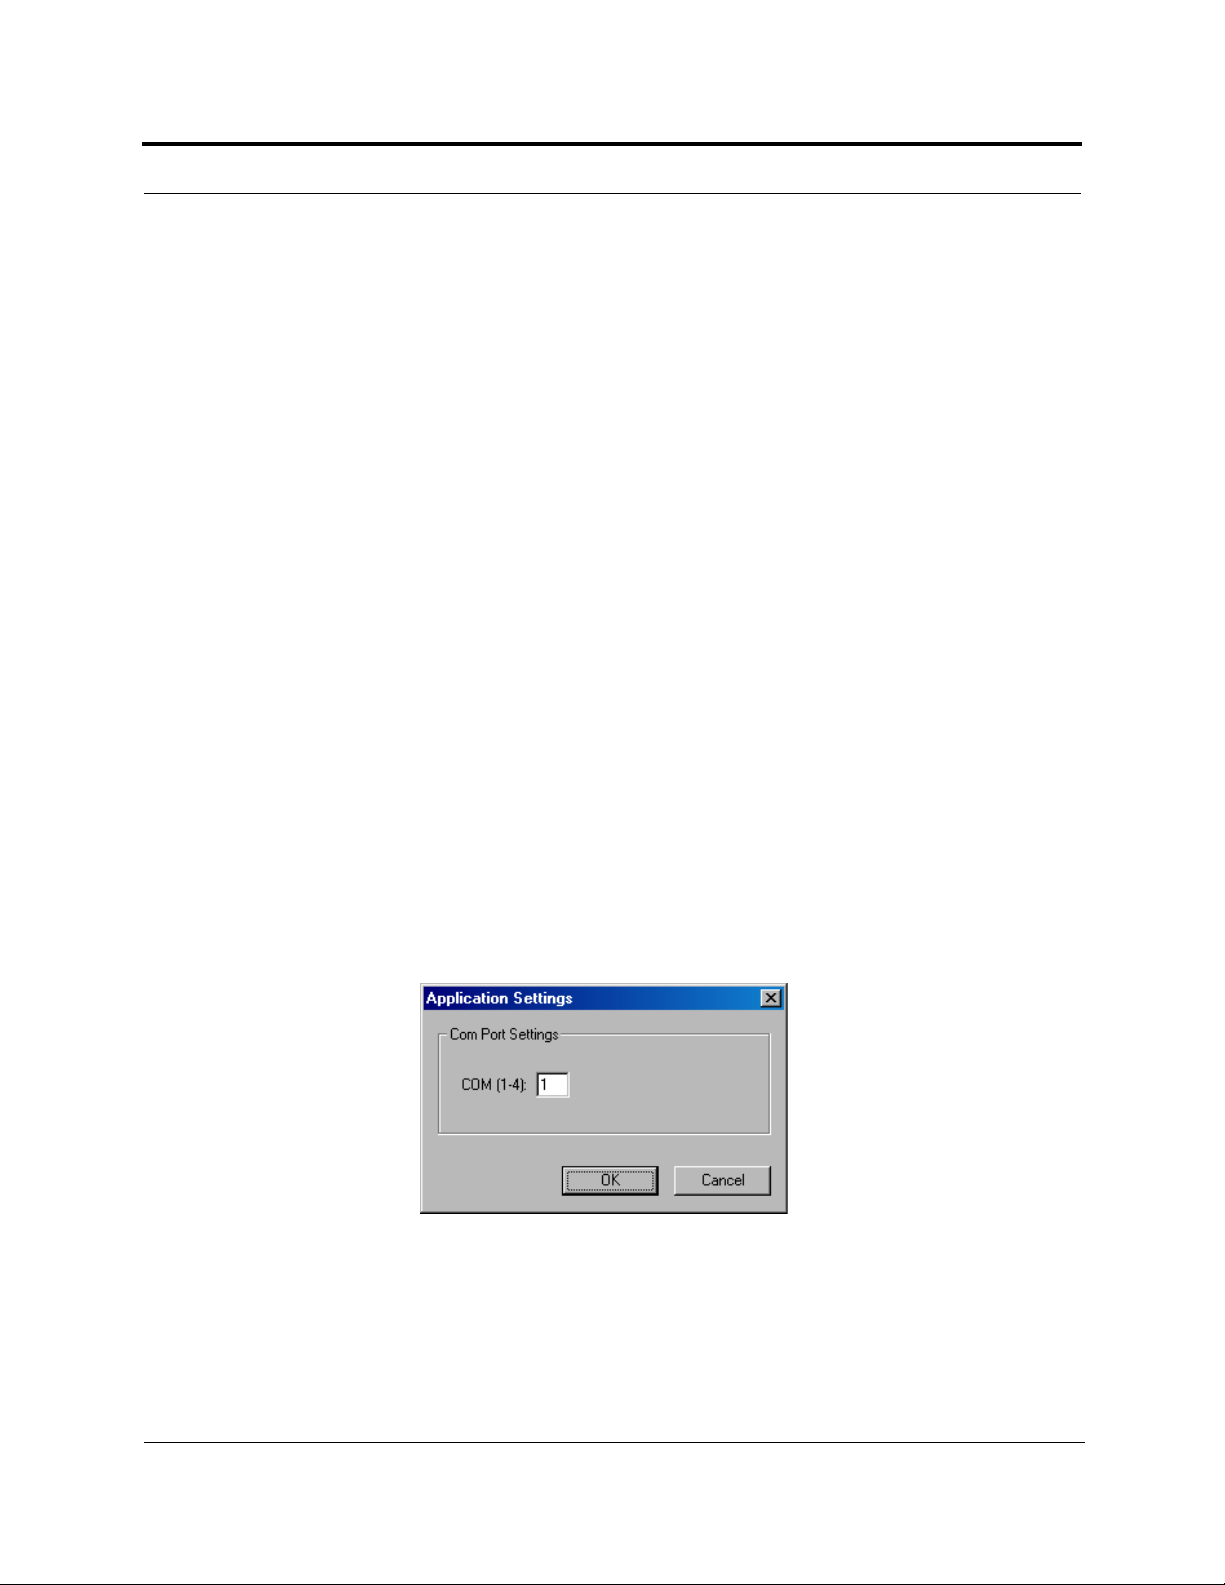
•Settings
Clicking the
you enter the communications port number that the modem will connect to for
remote monitoring and that the PC will use for connecting directly to a Main Hub
•Run
Depending on the operation option that you selected, clicking the
plays the Step 1 panel of the Ins tallation Wizard, the Configuratio n & Maintenance
window, or the Firmware Update window.
•Quit
Clicking the
SETTINGS button displays the Application Setting dialog box in which
RUN button dis-
QUIT button stops the AdminManager and closes the panel.
7-12 InterReach Unison User Guide and Reference Manual
PN 8700-10
620003-0 Rev. A
Page 13

PRELIMINARY Installation Wizard
7.2 Installation Wizard
Use the Installation Wizard when you are installing a new system or a new Main Hub
to a system. Installation consists of four steps; each one is displayed in a separate
panel of the Wizard.
• Section 7.2.1 Step 1: Verify Hardware . . . . . . . . . . . . . . . . . . . . . . . . . . . . . . 7-14
• Section 7.2.2 Step 2: Set Operation Band . . . . . . . . . . . . . . . . . . . . . . . . . . . . 7-16
• Section 7.2.3 Step 3: Configure System Parameters . . . . . . . . . . . . . . . . . . . . 7-20
• Section 7.2.4 Step 4: Final System Test . . . . . . . . . . . . . . . . . . . . . . . . . . . . . 7-22
PN 8700-10 Help Hot Line (U.S. only): 1-800-530-9960 7-13
620003-0 Rev. A
Page 14
Installing and Using the AdminManager Software PRELIMINARY
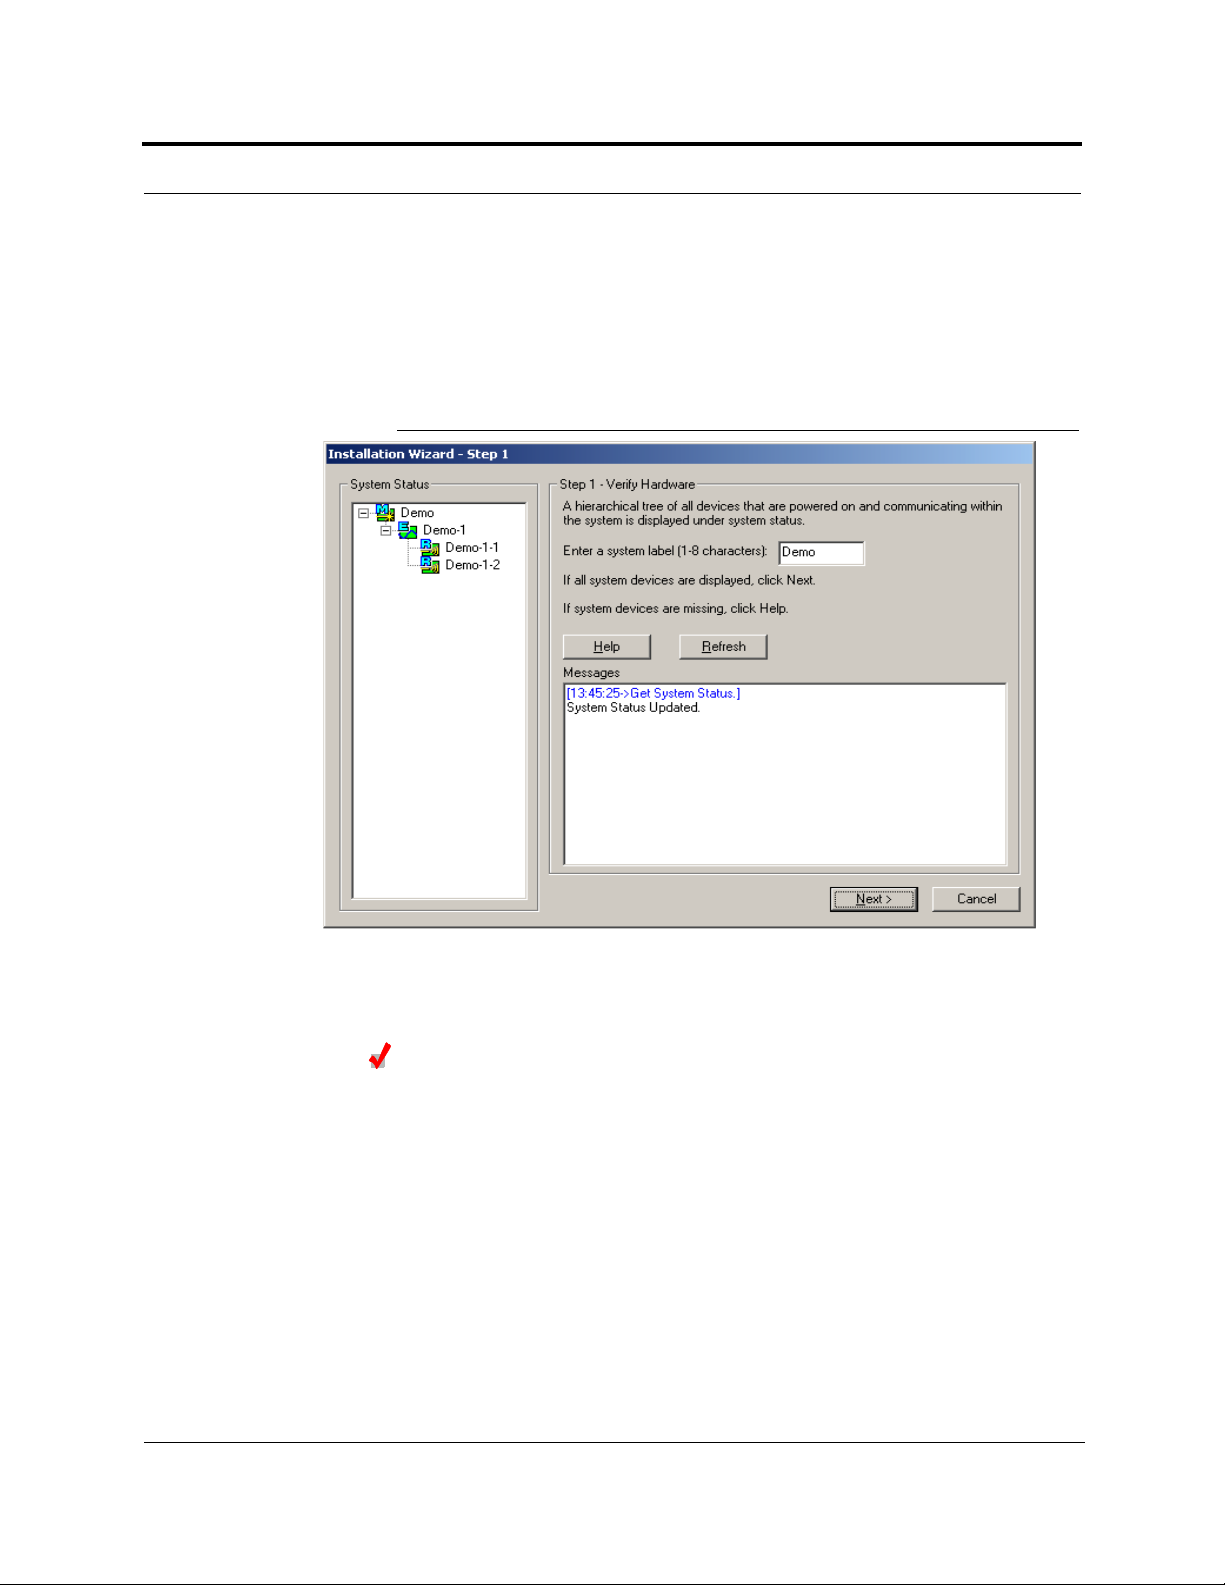
7.2.1 Step 1: Verify Hardware
During this step, the AdminManager software is in a listening mode. The Main Hub
detects downstream units (Expansi on Hubs and RAU s ) and automat ical ly repo rt s t he
system configuration, which AdminManager displays as a configuration tree in the
System Status pane of t he Step 1 panel.
Figure 7-3 Step 1: Verify Hardware Panel
Verify Hardware Configuration
1. Enter a system label (up to 8 characters) in the System Label text box.
This label is assigned to the Main Hub and appears in the System Status tree.
2. Click the NEXT button when the configuration is displayed correctly in the System
Status pane.
The Main Hub automatically reports any change in system status to the Admin-
Manager, which automatically updates the System Status tree.
7-14 InterReach Unison User Guide and Reference Manual
PN 8700-10
620003-0 Rev. A
Page 15

PRELIMINARY Step 1: Verify Hardware
7.2.1.1 Description of Step 1 Panel
Panes
• System Status
A hierarchical tree of detected system components is displayed in the System
Status pane. See Section 7.5 on page 7-39 for more information about the System
Status tree.
• Messages
Status and error messages are displayed in the Mes sages pane. I f the status is okay,
the
NEXT button is selectable.
Command Buttons
•Help
Clicking t he
•Refresh
Clicking t he
the System Status tree is updated. Also, any disconnect status is cleared. While the
Main Hub does report system status to the AdminManager automatically, you can
use this button to force an update if communications fail or if there has been a status change that is not showing in the System Status tree.
HELP button displays the Unison Hardware Troubleshooting Guide.
REFRESH button issues a query status command to the Main Hub and
•Next
Clicking t he
NEXT button displays the Installation Wizard Step 2 panel.
• Cancel
Clicking t he
CANCEL butt on quits the Installation Wizard and displays the Admin-
Manager Start window (Figure 7-2).
PN 8700-10 Help Hot Line (U.S. only): 1-800-530-9960 7-15
620003-0 Rev. A
Page 16
Installing and Using the AdminManager Software PRELIMINARY
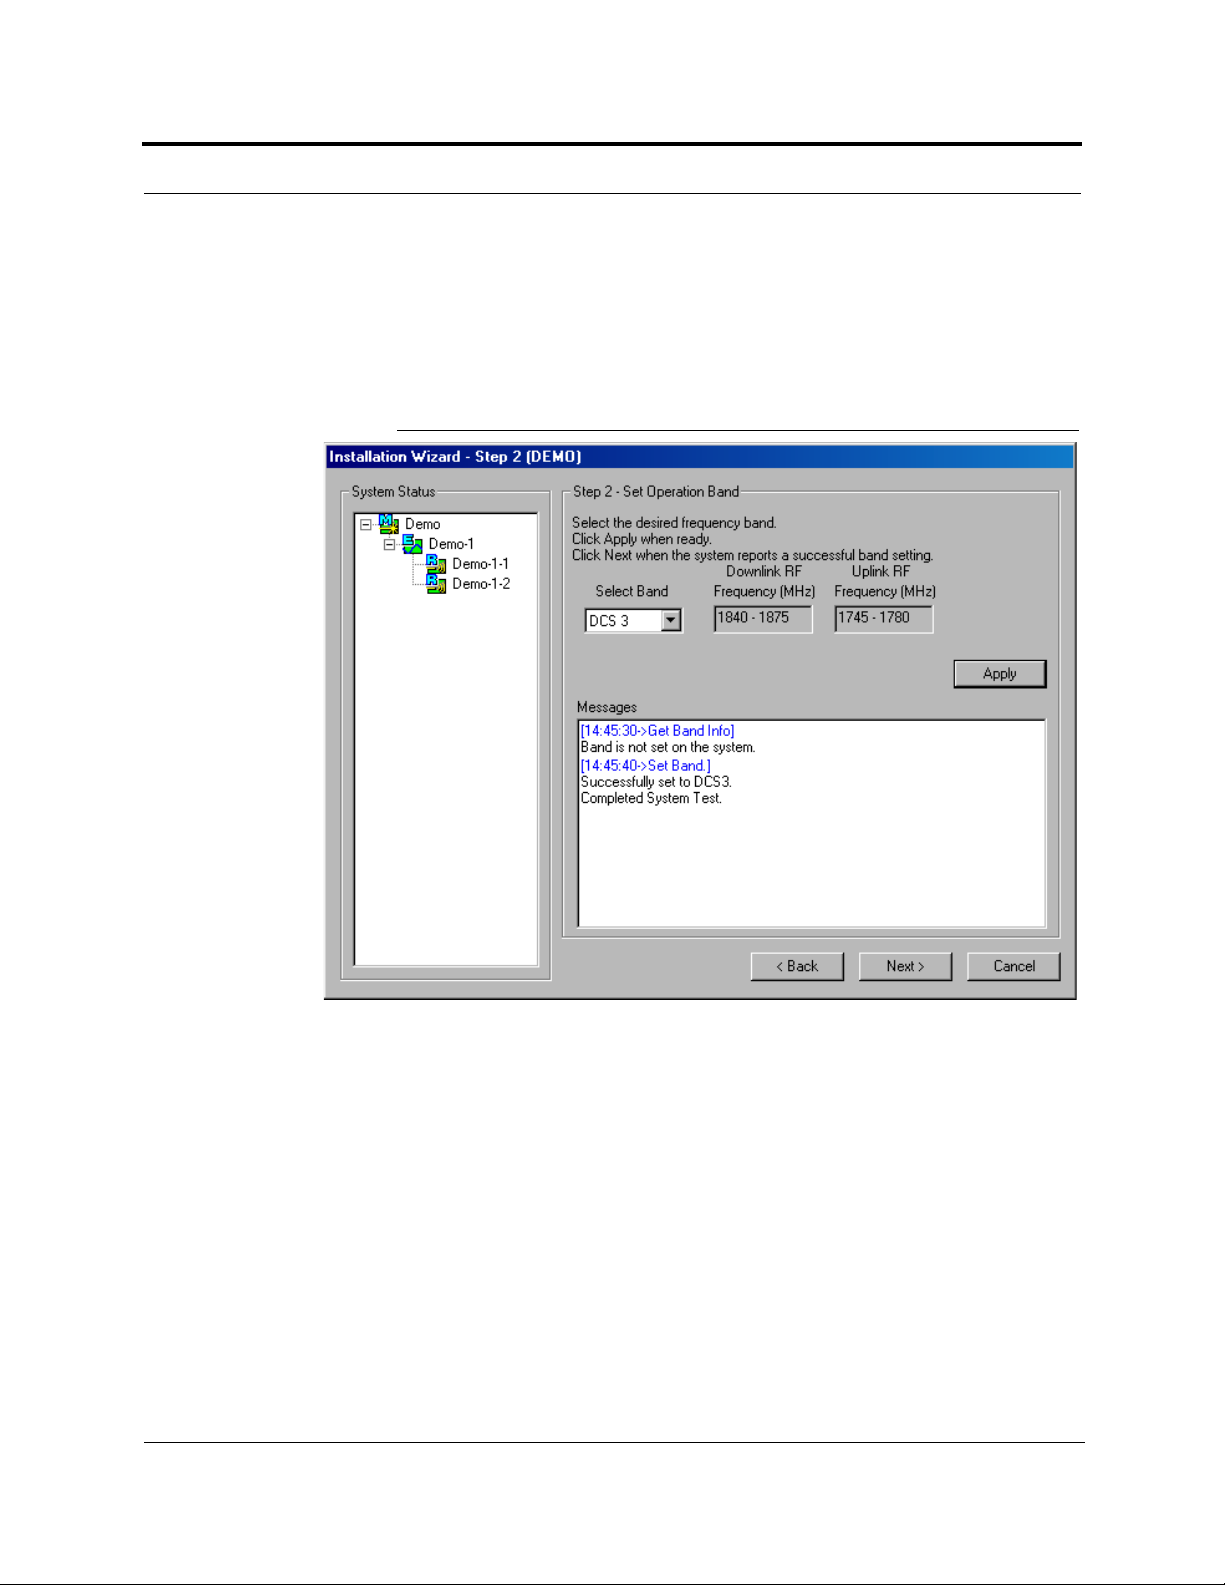
7.2.2 Step 2: Set Operation Band
The Main and Expansion Hubs are manufactured and shipped without a band of operation programmed into them. The RAUs, on the other hand, are manufactured to a specific band or set of bands. In order for the system to perform, you must p rogram t he
Main and Expansion Hubs to the band that the downstream RAUs are intended for.
Figure 7-4 Step 2: Set Operation Band
7-16 InterReach Unison User Guide and Reference Manual
PN 8700-10
620003-0 Rev. A
Page 17

PRELIMINARY Step 2: Set Operation Band
Set Operation Band
1. Select a band from the Select Band drop-down list box.
2. Click the APPLY button.
3. Click the NEXT button if:
a. The configuration is displayed correctly in the System Status pane.
b. There are no error messages in the Messages pane.
If a band setting error message is displayed, you can:
1. Disconnect the unit from the system.
2. Click the BACK button to return to Step 1.
3. Click the REFRESH button to clear the disconnected unit.
4. Click the NEXT button to continue to Step 2.
NOTE: “Band not initialized” faults can only be cleared by performing Step 2. The
Configuration & Maintenance panel does not provide a way to clear these faults.
PN 8700-10 Help Hot Line (U.S. only): 1-800-530-9960 7-17
620003-0 Rev. A
Page 18

Installing and Using the AdminManager Software PRELIMINARY
7.2.2.1 Description of Step 2 Panel
Panes
• System Status
A hierarchical tree of detected system components is displayed in the System Status pane. See Section 7.5 on page 7-39 for more information about the System Status tree.
•Messages
Status and error messages are displayed in the Messages pane. If the status is okay,
the
NEXT button is selectable.
Drop-Down List Box
• Select Band
Choose from:
RF Passband
Unison
Band
Cellular 869–894 824–849
DCS1 1805–1842.5 1710–1747.5
DCS2 1842.5–1880 1747.5–1785
DCS3 1840–1875 1745–1780
EGSM 925–960 880–915
GSM 935–960 890–915
iDEN 851–869 806–824
PCS A&D 1930–1950 1850–1870
PCS B&E 1945–1965 1865–1885
PCS D&B 1950–1970 1870–1890
PCS E&F 1965–1975 1885–1895
PCS F&C 1970–1990 1890–1910
UMTS 1 2110–2145 1920–1955
UMTS 2 2125–2160 1935–1970
UMTS 3 2135–2170 1945–1980
Downlink (MHz) Uplink (MHz)
7-18 InterReach Unison User Guide and Reference Manual
PN 8700-10
620003-0 Rev. A
Page 19

PRELIMINARY Step 2: Set Operation Band
Command Buttons
•Apply
Clicking t he
downstream components, and initiates a system test.
In order for the system to complete the band configu rati on, the fact or y-s et ba nd of
all the attached RAUs must match the band command issued by the AdminManager software. If the band command matches the RAU’s, then the system band is
set. If the band command do es not match, the command is r ejected and a “Set band
error” message for that RAU is displayed.
•Back
Clicking t he
•Next
Clicking the
is selectable only when the
• Cancel
Clicking t he
Manager Start window (Figure 7-2).
APPLY button issues the set band command to the Main Hub and all
BACK button returns AdminManager to the Step 1 panel.
NEXT button displays the Installati on W izard S tep 3 panel. This butt on
APPLY function is successful.
CANCEL butt on quits the Installation Wizard and displays the Admin-
PN 8700-10 Help Hot Line (U.S. only): 1-800-530-9960 7-19
620003-0 Rev. A
Page 20
Installing and Using the AdminManager Software PRELIMINARY
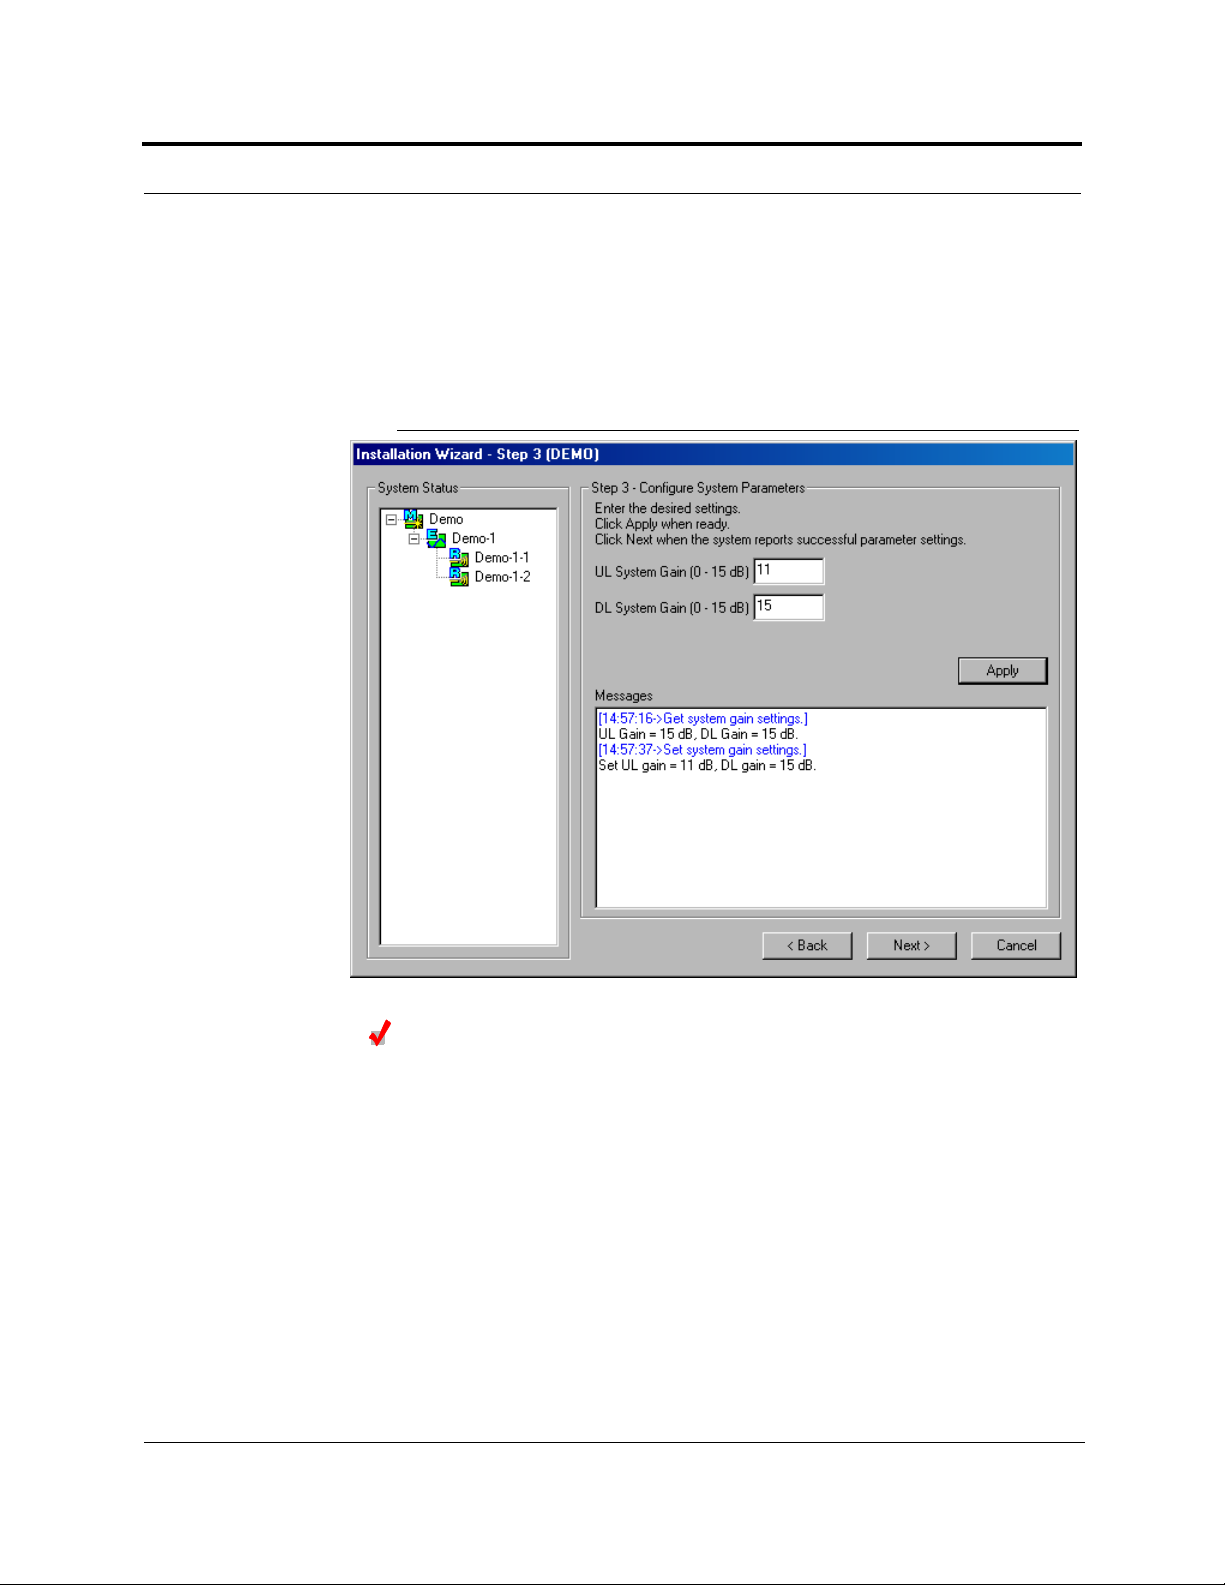
7.2.3 Step 3: Configure System Parameters
From this panel, you can set uplink and downlink system gain from 0 dB to 15 dB in
1 dB steps. By default, the UL and D L Syst em Gain is se t at 15 d B. Current hardware
settings are shown in the text boxes when the panel is first displayed. Figure 7-5
shows the display after the UL System Gain was changed to 11 dB.
Figure 7-5 Step 3: Configure System Parameters
Configure System Parameters
If you want to keep the values as they are initially displayed, click the NEXT button.
If you want to change the values:
1. Enter a value in the UL System Gain text box, if desired.
2. Enter a value in the DL System Gain text box, if desired.
3. Enter the callback number if a callback number text box is displayed.
If a callback number is set in the Main Hub, this panel displays an additional callback number text box, letting you change the number, if desired.
4. Click the APPLY button when you are ready.
5. Click the NEXT button if:
a. The configuration is displayed correctly in the System Status pane.
b. There are no error messages in the Messages pane.
7-20 InterReach Unison User Guide and Reference Manual
PN 8700-10
620003-0 Rev. A
Page 21

PRELIMINARY Step 3: Configure System Parameters
7.2.3.1 Description of Step 3 Panel
Panes
• System Status
A hierarchical tree of detected system components is displayed in the System Status pane. See Section 7.5 on page 7-39 for more information about the System Status tree.
• Messages
Status and error messages are displayed in the Mes sages pane. I f the status is okay,
the
NEXT button is selectable.
Text Boxes
• UL System Gain and DL System Gain
Both the uplink and the downlink system gain can be adjusted from 15 dB to 0 dB
in 1 dB increments using these text boxes.
Command Buttons
•Apply
Clicking t he
•Back
Clicking t he
•Next
Clicking t he
• Cancel
Clicking t he
Manager Start window (Figure 7-2).
APPLY button sets the selected value.
BACK button returns AdminManager to the Step 2 panel.
NEXT button displays the Installation Wizard Step 4 panel.
CANCEL butt on quits the Installation Wizard and displays the Admin-
PN 8700-10 Help Hot Line (U.S. only): 1-800-530-9960 7-21
620003-0 Rev. A
Page 22
Installing and Using the AdminManager Software PRELIMINARY
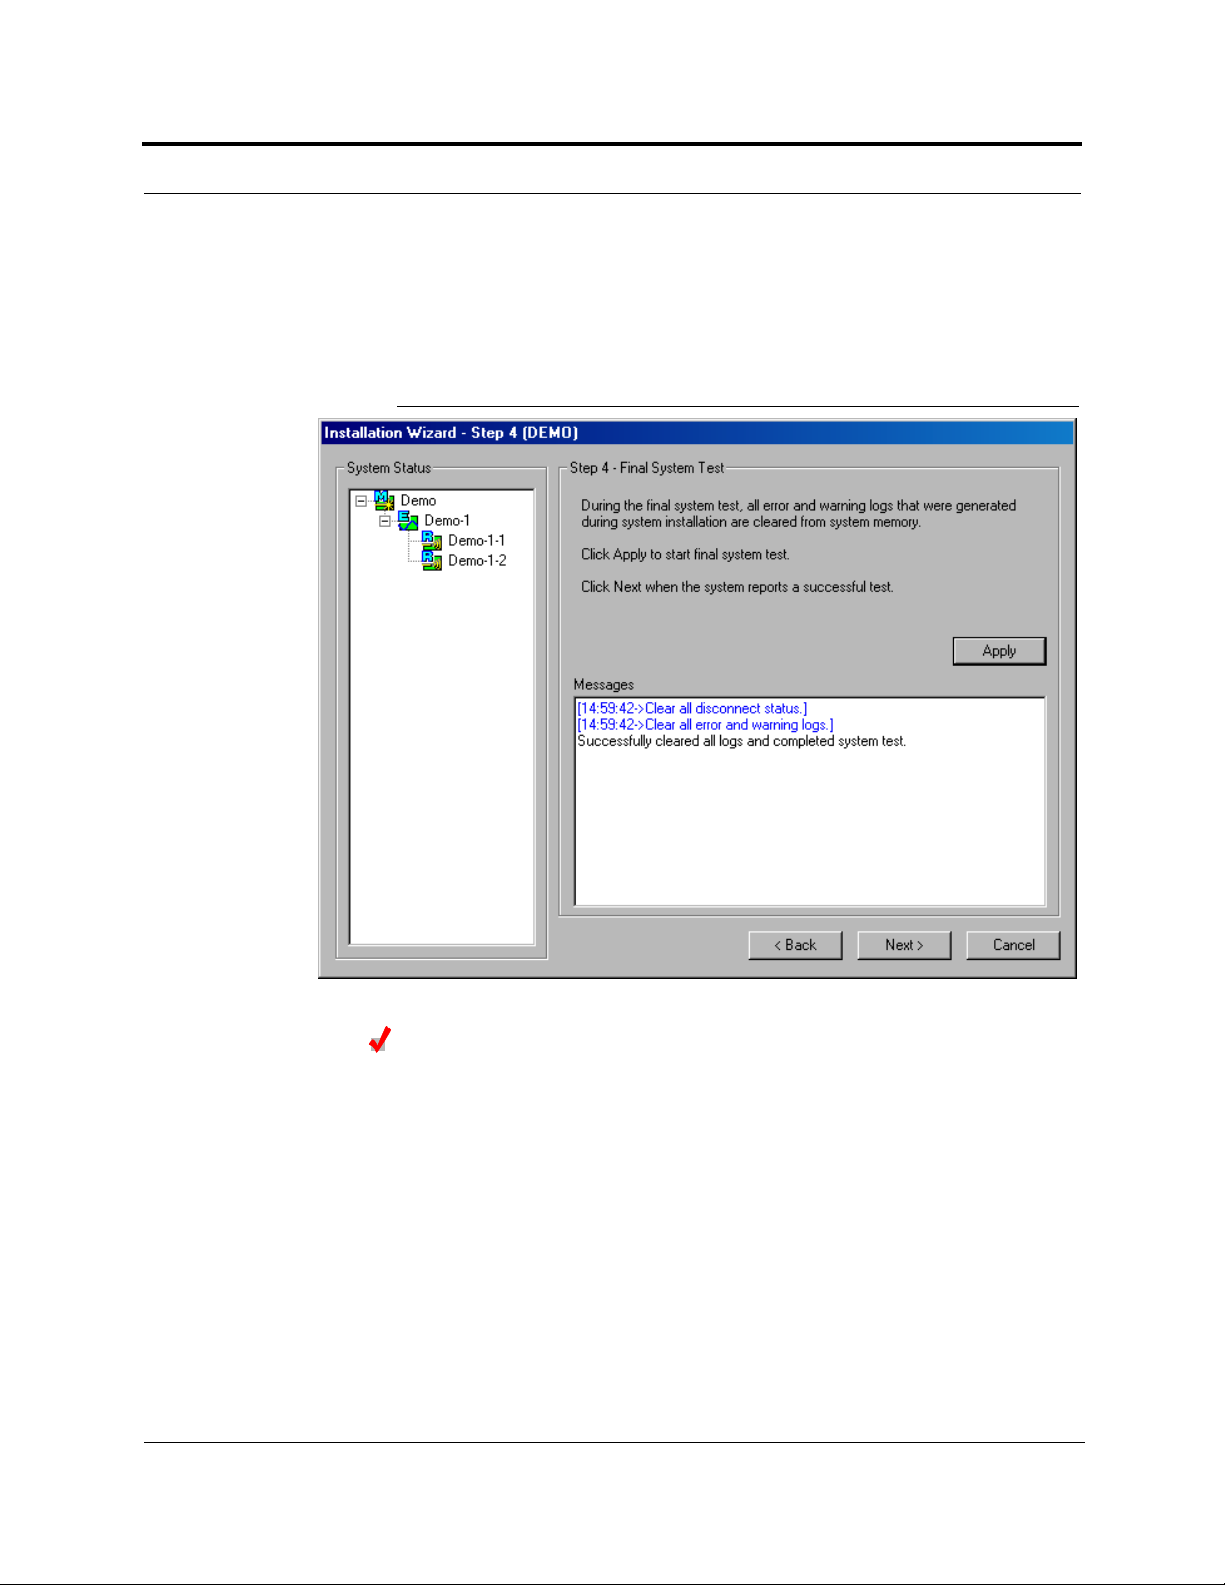
7.2.4 Step 4: Final System Test
This step performs an end-to-end RF path functional test that includes cable length
estimation and system gain refinement. Any disconnect status is cleared and all fault
logs are cleared.
Figure 7-6 Step 4: Final System Test
Perform Final System Test
1. Click the APPLY button if the configuration is displayed correctly in the System
Status pane.
For a fully loaded s ystem ( one Main Hub, f our Ex pansi on Hubs , and 32 RA Us), it
can take 1.5 minutes to complete the test.
2. Click the NEXT button when a successful test message is displayed in the Mes-
sages pane.
You can use the
is displayed in the Messages pane.
7-22 InterReach Unison User Guide and Reference Manual
BACK button to return to previous steps and make changes if an error
PN 8700-10
620003-0 Rev. A
Page 23

PRELIMINARY Step 4: Final System Test
7.2.4.1 Description of Step 4 Panel
Panes
• System Status
A hierarchical tree of detected system components is displayed in the System Status pane. See Section 7.5 on page 7-39 for more information about the System Status tree.
• Messages
Status and error messages are displayed in the Mes sages pane. I f the status is okay,
the
NEXT button is selectable.
Command Buttons
•Apply
Clicking t he
•Back
Clicking t he
APPLY button starts the final system test.
BACK button returns AdminManager to the Step 3 panel.
•Next
Clicking the
is selectable only when the
NEXT button displays the Inst allation Wizard Finish panel. This button
APPLY function is successful.
• Cancel
Clicking t he
CANCEL butt on quits the Installation Wizard and displays the Admin-
Manager Start window (Figure 7-2).
PN 8700-10 Help Hot Line (U.S. only): 1-800-530-9960 7-23
620003-0 Rev. A
Page 24
Installing and Using the AdminManager Software PRELIMINARY
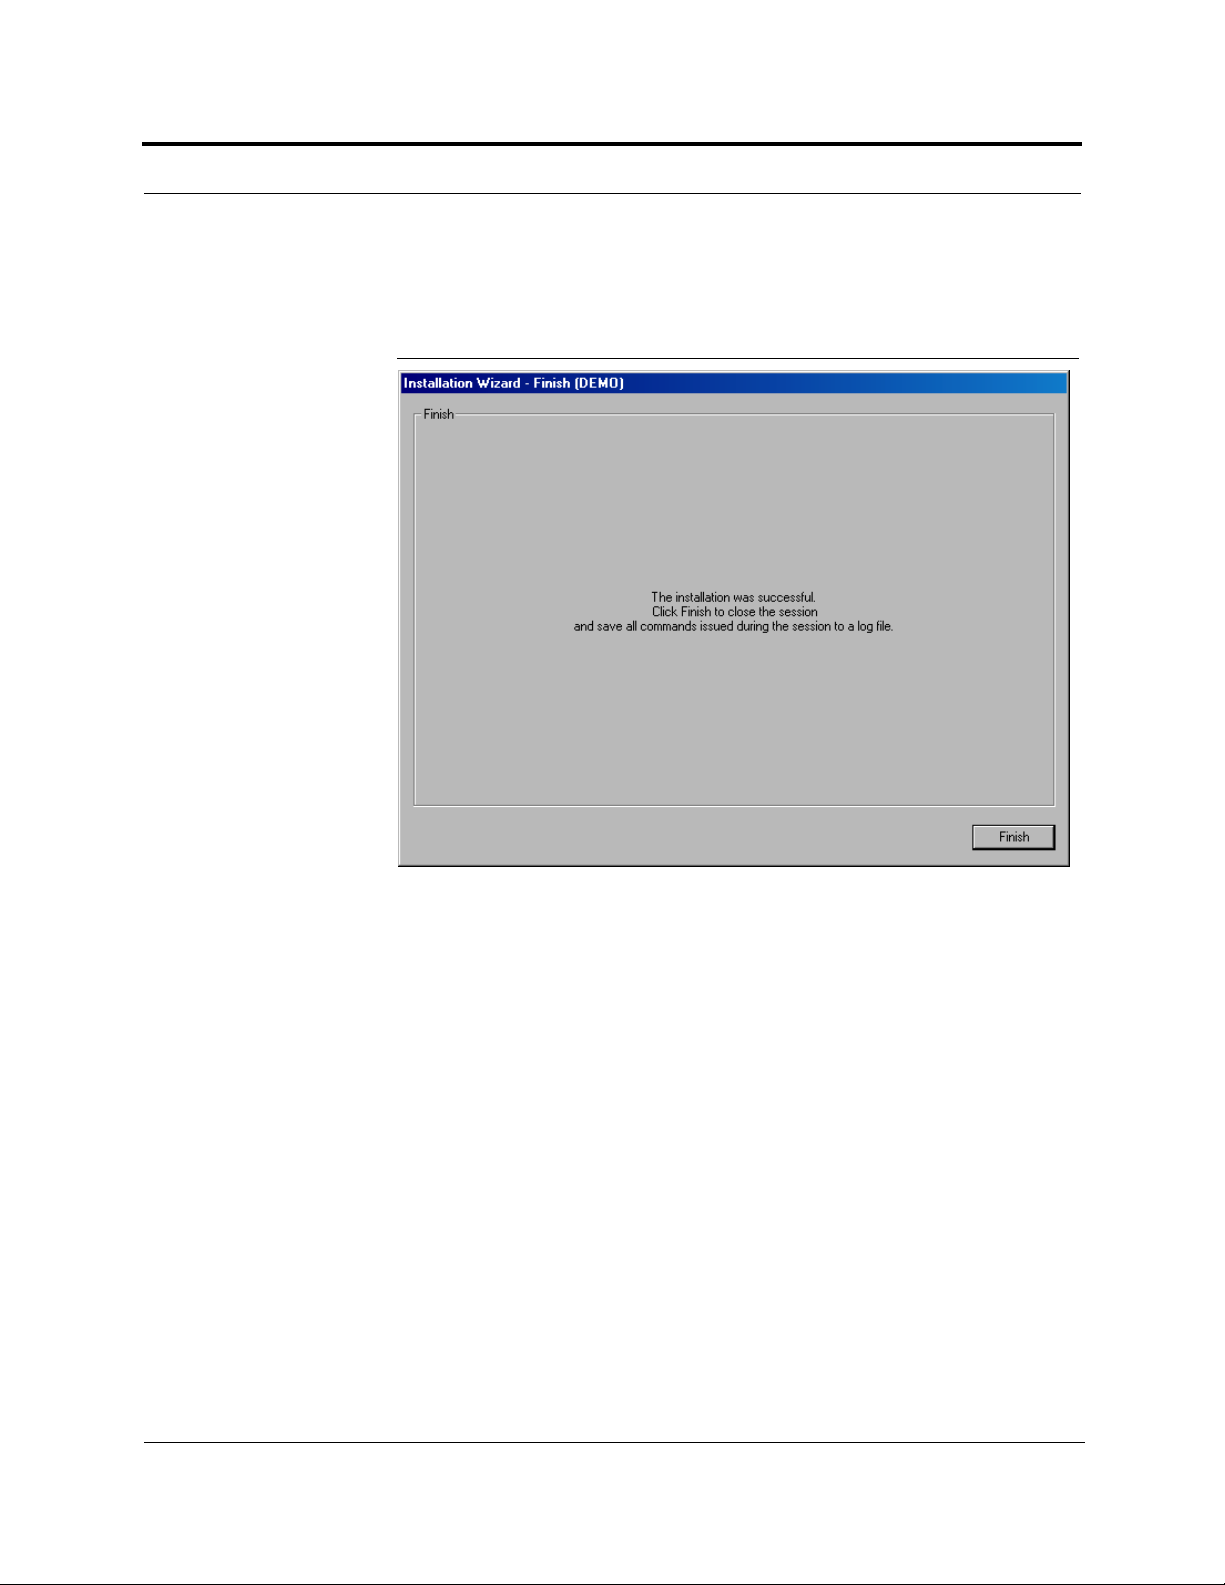
7.2.5 Finish Panel
The Finish panel is displayed when the final system test is successfully completed.
Figure 7-7 Finish Panel
1. Click the FINISH button.
A Save As di alog box is di splayed.
2. Specify a file name and where to save the command file.
All of the commands that were issued during the installation are saved in the command file.
7.2.5.1 Description of Finish Panel
Command Button
• Finish
Clicking the
tion file and then quits the session.
7-24 InterReach Unison User Guide and Reference Manual
FINISH button displays a Save As dialog box for saving the configura-
PN 8700-10
620003-0 Rev. A
Page 25
PRELIMINARY Configuration & Maintenance Panel
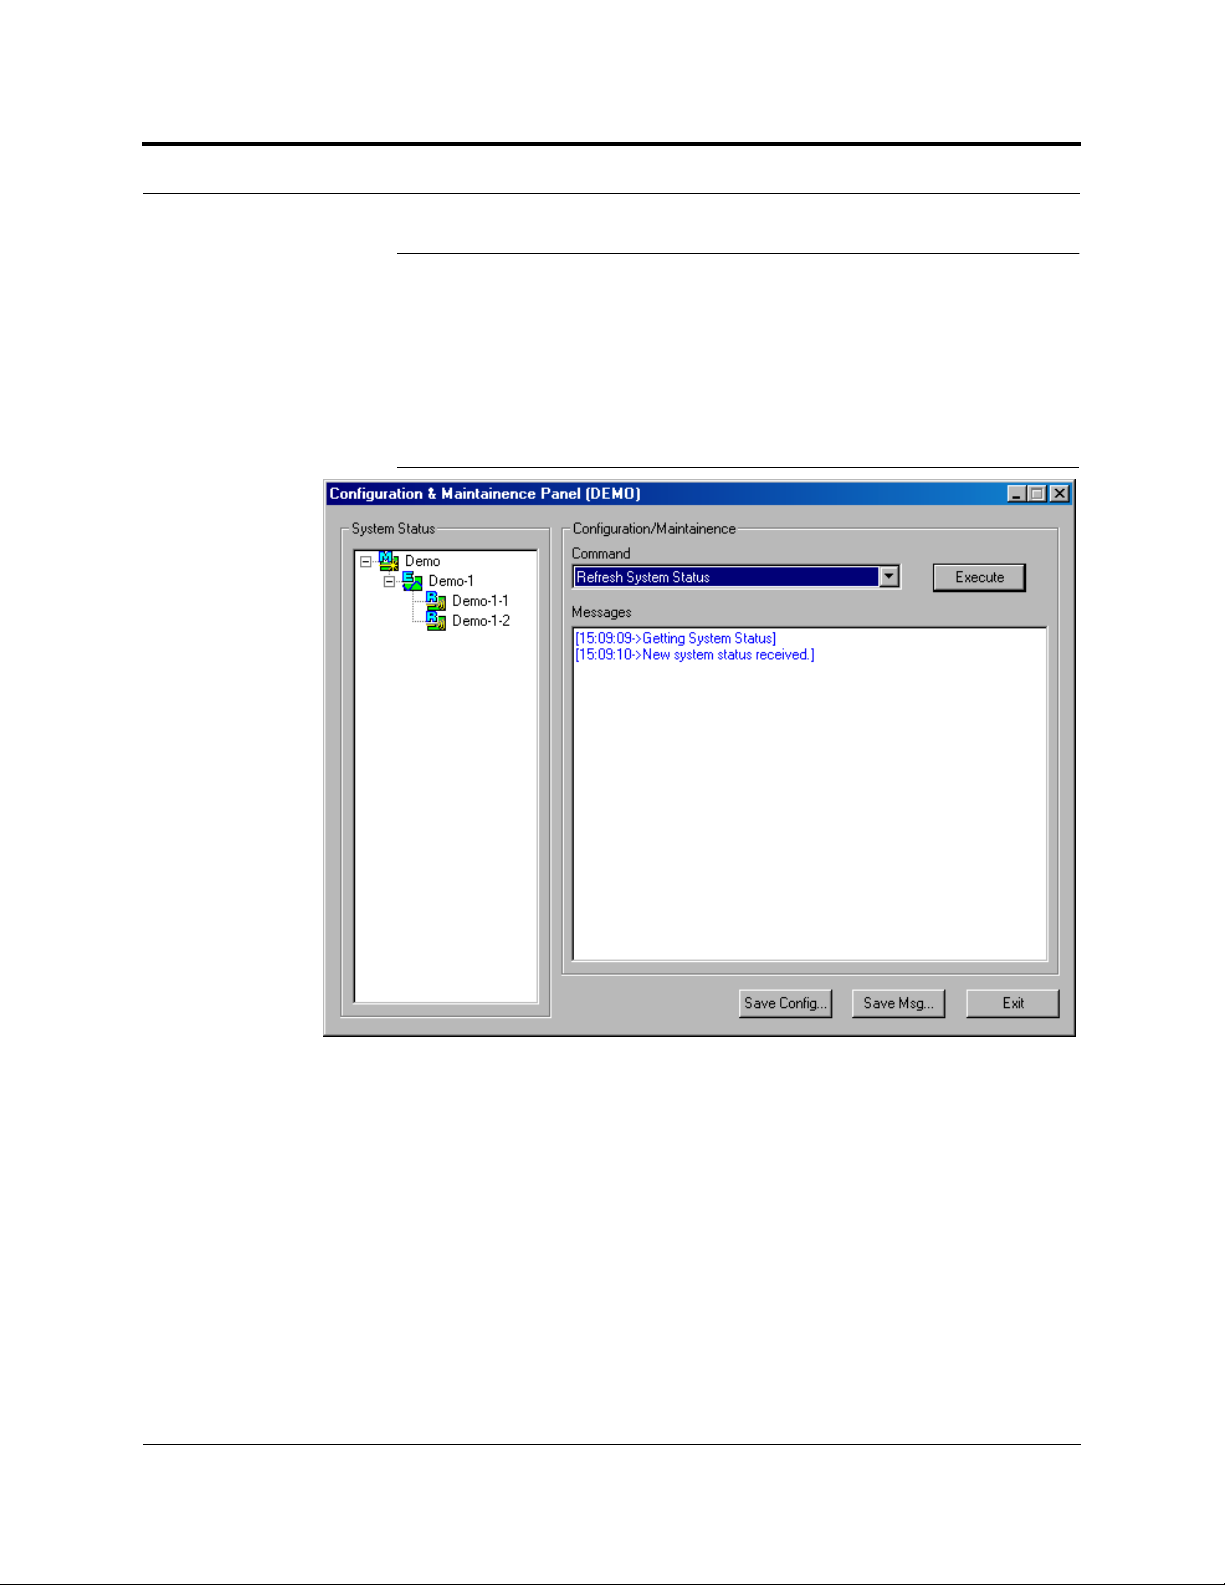
7.3 Configuration & Maintenance Panel
The Configuration & Maintenance Panel is used after the initial installation of a system. From this panel you can check status of the system, get current errors and warnings, get information about a particular unit in the system, set system parameters, and
perform a system test, for example.
Figure 7-8 Configuration & Maintenance Window
PN 8700-10 Help Hot Line (U.S. only): 1-800-530-9960 7-25
620003-0 Rev. A
Page 26

Installing and Using the AdminManager Software PRELIMINARY
7.3.1 Window Description
Panes
• System Status
A hierarchical tree of detected system components is displayed in the System Status pane. See Section 7.5 on page 7-39 for more information about the System Status tree.
•Messages
Status and error messages are displayed in the Messages pane.
Drop-Down List Box
Table 7-1 Configuration and Maintenance Window Opt ions
Connection
OptionLocal Remote
Advanced RAU Settings
Clear All Disconnect Status
Command Unit In-Service
Command Unit Out-of-Service
Get Current Errors
Get Current Warnings
Get System Parameters
Get Unit Info
Refresh System Status
Set Callback Number
Set Contact Sense Properties
Set System Parameters
System Test
7-26 InterReach Unison User Guide and Reference Manual
PN 8700-10
620003-0 Rev. A
Page 27

PRELIMINARY Window Description
Command Buttons
• Execute
Clicking t he
list box.
• Save Config
Clicking t he
box. Any additional information that you type into the text box is saved at the top
of the configuration file.
EXECUTE button starts the command that is selected in the Command
SAVE CONFIG button displays the Save Configuration Notes dialog
After you click
OK in this dialog box, the Save As dialog box is displayed, in
which you specify the name of the file and where to save the configuration file.
Following is an example configuration file that includes notes:
Begin Notes *******************************************
LGC HQ
05/23/01 MH configuration L010MH11
System configuration
End Notes *********************************************
Frequency Band is DCS Low.
System Gain: UL = 12 dB, DL=4dB.
Callback Number is 1234567.
System label is LGC.
Main Hub Information:
Serial Number: L010BMH1
Part Number: 7405101
Revision Number: 03
Firmware Revision: 010526
Expansion Hub LGC-1 Information:
Serial Number: L010BEH9
Part Number: 7405101
Revision Number: 03
Firmware Revision: 010513
RAU LGC-1-5 Information:
Serial Number: L010BRU1
Part Number: 7405101
Revision Number: 03
Firmware Revision: 010021
PN 8700-10 Help Hot Line (U.S. only): 1-800-530-9960 7-27
620003-0 Rev. A
Page 28

Installing and Using the AdminManager Software PRELIMINARY
•Save Msg
Selecting the
SAVE MSG button displays the S ave A s dial og b ox in whi ch y ou s pec-
ify the name of the file and where to save the contents of the Message text box.
•Exit
Selecting the
EXIT button quits the session and displays the AdminManager Start
window (Figure 7-2).
7-28 InterReach Unison User Guide and Reference Manual
PN 8700-10
620003-0 Rev. A
Page 29
PRELIMINARY Options when Connected Locally
7.3.2 Options when Connected Locally
When you are locally connected to the Main Hub, you can choose the following
options in addition to those listed in Section 7.3.3, “Read-Only Options when Connected Remotely,” on page 7-34 (also, see Table 7-1 on page 7-26).
Advanced RAU Settings
• Set uplink and downlink 10 dB attenuation for an individual RAU
Refer to “Using the 10 dB Attenuation Setting” on page 7-30 for a description
of this setting.
• Select a UL ALC setting for an individual RAU
Refer to “Using the Uplink ALC Setting” on page 7-31 fo r a descri ption of this
setting.
1. Ent e r the Expansion Hub number and the
RAU number in the text boxes on the RAU
Selection dialog bo x an d click OK.
The Advanced RAU Settings dialog box is
displayed.”
In the Advanced RAU Settings example
shown below, Demo-1-1 indicates that RAU
number 1 that is connected to Expansion
Hub number 1 in the “Demo” Main Hub system is selected.
2. Select the Uplink and Downlink check box
to enable the 10 dB attenuation setting.
3. Select a radio button from the UL ALC Set-
ting list.
PN 8700-10 Help Hot Line (U.S. only): 1-800-530-9960 7-29
620003-0 Rev. A
Page 30

Installing and Using the AdminManager Software PRELIMINARY
Using the 10 dB Attenuation Setting
By selecting the Uplink and Downlink checkbox in the Advanced RAU Settings dialog box, the uplink and downl i nk signals in the individual RAU, which y ou s peci f ied
in the RAU Selection dialog box, are both reduced by 10 dB. One reason you may
want to use this setting is to reduce the RAU’s output power when an RAU is located
near an exterior wall of a building and its RF signal is going beyond the wall to the
outside of the building, where it can negatively affect the outdoor macro system.
The following table shows some examples of how the 10 dB attenuation setting
affects coverage distance. These examples assume a 0 dB gain system, a 3 dBi gain
antenna, and the difference between a –85 dB and a –75 dB design.
Frequency Environment Reduction in Coverage Distance
800 MHz Open, like a parking garage 24 meters (80 feet)
800 MHz Heavily walled, like a Hospital 12.5 meters (41 feet)
1900 MHz Open, like a parking garage 24 meters (80 feet)
1900 MHz Heavily walled , li ke a H ospital 9 mete rs (3 0 feet )
You can use the following formula to calculate the reduction in distance covered.
•d
= original distance
orig
= new distance with 10 dB attenuation enabled
•d
new
• PLS = path loss slope [dB]
= (10
–10/PLS
)d
orig
d
new
Examples:
d
new
d
new
= 0.31 d
= 0.46 d
for PLS = 20 dB (free space)
orig
for PLS = 30 dB
orig
7-30 InterReach Unison User Guide and Reference Manual
PN 8700-10
620003-0 Rev. A
Page 31

PRELIMINARY Options when Connected Locally
Using the Uplink ALC Setting
Uplink automatic level control (UL ALC) circuitry within the RAU provides automatic level control on high-power signals in the uplink path. This functionality is
required to prevent compression caused by a single or multiple wireless devices that
are in very close proximity to an RAU. Compression causes signal degradation and,
ultimately, bit errors, and should be prevented. Two settings are available to optimize
UL ALC performance:
• Single Operator and Protocol: Use when only one operator and protocol is
on-the-air within the Unison system’s configured and adjacent frequency bands.
• Multiple Operators and/or Protocols: Use when more than one operator and/or
protocol is present in the Unison system’s frequency and adjacent frequency
bands.
The following table shows the frequency bands that are adjacent to the bands that the
system is configured for.
Table 7-2 Frequency Bands Adjacent to Syst em Configured Bands
System
Configuration Adjacent Bands
iDEN Cellular
Cellular iDEN
PCS AD PCS B
PCS DB PCS A, PCS E
PCS BE PCS D, PCS F
PCS EF PCS B, PCS C
PCS FC PCS E
GSM –
EGSM –
DCS 1 DCS 2
DCS 2 DCS 1, DCS 3
DCS 3 –
UMTS 1 UMTS 2, UMTS 3
UMTS 2 UMTS 1, UMTS 3
UMTS 3 UMTS 1, UMTS 2
PN 8700-10 Help Hot Line (U.S. only): 1-800-530-9960 7-31
620003-0 Rev. A
Page 32

Installing and Using the AdminManager Software PRELIMINARY
• Clear All Disconnect Status: clears a port disconnect fault when an Expansion
Hub or an RAU is disconnected and will not be re-connected.
• Command Un it In-Service: returns a unit to service that was previously removed
from service; restores a component to the system’s alarm monitoring; displays the
unit lock, unit not system tested, or normal operation icon.
• Command Unit Out-of-Service: removes a unit, and all of its downstream units,
from service, there is no RF transmission; lets you temporarily remove a component from the system’s alarm monitoring; displays unit “lock” icon.
• Set Callback Number: displays a dialog box in which you enter the phone num-
ber that the system uses to communicate with OpsConsole users. You can use up to
64 characters: 0 through 9, and the comma (,) for a pause. Leave the field blank if
you do not want the unit t o cal l out . R efer to your modem documentation for ot her
characters that you can use. To disable callback, leave the text box empty.
• Set Contact Sense Properties: enables/disables the external sensing of either nor-
mally open or normally closed contact closures; displays “contact sense alarm” or
“contact sense okay” icon.
7-32 InterReach Unison User Guide and Reference Manual
PN 8700-10
620003-0 Rev. A
Page 33

PRELIMINARY Options when Connected Locally
• Set System Parameters: displays a dialog box from which you select uplink and
downlink gain settings, and/or specify a system label. If the system label text box
is left empty, the System Status tree displays the default label “1”.
• System Test: An end-to-end RF path functional test that includes cable length esti-
mation and system gain refinement is performed during the system test. System
operation is suspended while the test is being performed. For a fully loaded system
(one Main Hub, four Expansion Hubs, and 32 RAUs), it can take 1.5 minutes to
complete the test.
PN 8700-10 Help Hot Line (U.S. only): 1-800-530-9960 7-33
620003-0 Rev. A
Page 34

Installing and Using the AdminManager Software PRELIMINARY
7.3.3 Read-Only Options when Connected Remotely
You can only choose read-only options and view system status when you are
remotely connected to the Main Hub. You cannot set parameters or change system
configuration remotely. (See Table 7-1 on page 7-26.)
• Get Current Errors: displays the highest priority error with a recommendation
for resolving it
7-34 InterReach Unison User Guide and Reference Manual
PN 8700-10
620003-0 Rev. A
Page 35

PRELIMINARY Read-Only Options when Connected Remotely
• Get Current Warnings: displays the highest priority warning with a recommen-
dation for resolving it
• Get System Parameters: displays the frequency band, callback number, uplink
and downlink system gain, and system label
PN 8700-10 Help Hot Line (U.S. only): 1-800-530-9960 7-35
620003-0 Rev. A
Page 36

Installing and Using the AdminManager Software PRELIMINARY
• Get Unit Info: displays the Options dialog box in which you select a unit.
Select a unit and click the
OK button to display that unit’s serial number, part num-
ber, revision number and firmware version. Additionally, the advanced settings for
the RAU are displayed when RAU information is requested.
7-36 InterReach Unison User Guide and Reference Manual
PN 8700-10
620003-0 Rev. A
Page 37

PRELIMINARY Read-Only Options when Connected Remotely
• Refresh System Status: requests system status and updates the System Status tree
PN 8700-10 Help Hot Line (U.S. only): 1-800-530-9960 7-37
620003-0 Rev. A
Page 38

Installing and Using the AdminManager Software PRELIMINARY
7.4 Upgrading Firmware
The firmware update program automatically detects which unit the firmware is
intended for and displays the firmware ID and version number in the Firmware
Update window, as shown in the following figure.
Figure 7-9 Firmware Update Window
Updating Firmware
1. Copy the firmware program to the PC.
2. Start AdminManager and select the Firmware Update radio button on the Start
window, and then click run.
An Open Fil e dialog box i s displayed.
3. Choose the .m19 file you want to open from the Open File dialog box and click
OPEN.
The firmware ID and version number are displayed in the Firmware Update window.
4. Click the PROGRAM button to start the download.
This button changes to
update.
5. Click the DONE button.
This button is enabled when the download is completed.
7-38 InterReach Unison User Guide and Reference Manual
CANCEL during the download, click it to stop the firmware
PN 8700-10
620003-0 Rev. A
Page 39

PRELIMINARY System Status Tree
7.5 System Status Tree
A hierarchical tree of the detected system components is displayed in the System Status pane.
7.5.1 System St atus Tree Icons
The following table shows the icons that may appear in the System Status tree.
Table 7-3 System Status Tree Icons
Icon Description
Main Hub normal ope r at ion
Main Hub fault
Main Hub lock (unit and all downstream units are out-of-service)
Main Hub has not been system tested
Main Hub warning
Expansion Hub normal operation
Expansion Hub fault
Expansion Hub lock (unit and all downstream RAUs ar e out-of-service)
Expansion Hub has not been system tested
Expansion Hub warning
RAU normal operation
RAU fault
RAU lock
RAU has not been system tested
RAU warning
No communication
Contact sense alarm
Contact sense okay
PN 8700-10 Help Hot Line (U.S. only): 1-800-530-9960 7-39
620003-0 Rev. A
Page 40

Installing and Using the AdminManager Software PRELIMINARY
7-40 InterReach Unison User Guide and Reference Manual
PN 8700-10
620003-0 Rev. A
Page 41

PRELIMINARY
SECTION 8
Designing a Unison Solution
Designing a Unison solution is ultimately a matter of determining coverage and
capacity needs. This requires the following steps:
1. Determine the wireless service provider’s requirements.
This information is usually supplied by the service provider:
• Frequency (i.e., 850 MHz)
• Band (i.e., “A” band in the Cellular spectrum)
• Protocol (i.e., TDMA, CDMA, GSM, iDEN)
• Peak capacity requirement (this, and whether or not the building will be split
into sectors, determines the number of carriers that the system will have to
transmit)
• Design goal (RSSI, received signal strength at the wireless handset,
i.e., –85 dBm)
The design goal is always a stronger signal than the cell phone needs. It
includes inherent factors which will affect performance (see Section 8.4.1 on
page 8-33).
• RF source (base station or BDA), type of equipment if possible
2. Determine the power per carrier and input power from the base station or
BDA into the Main Hub: Section 8.1, “Maximum Output Power per Carrier
at RAU,” on page 8-3.
The maximum power per carrier is a function of the number of RF carriers, the
carrier headroom requirement, signal quality issues, regulatory emissions requirements, and Unison’s RF performance. The power per carrier decreases as the
number of carriers increases.
3. Determine the in-building environment: Section 8.2, “Estimating RF Cover-
age,” on page 8-19.
• Determine which areas of the buildin g require coverage ( entire build ing, public
areas, parking levels, etc.)
PN 8700-10 InterReach Unison User Guide and Reference Manual 8-1
620003-0 Rev. A
Page 42

Designing a Unison Solution PRELIMINARY
• Obtain floor plans to determine floor space of building and the wall layout of
the proposed areas to be covered. Floor plans will also be useful when you are
selecting antenna locations.
• If possible, determine the building’s construction materials (sheetrock, metal,
concrete, etc.)
• Determine type of environment
– Open layout (e.g., a convention center)
– Dense, close walls (e.g., a hospital)
– Mixed use (e.g., an office building with hard wall offices and cubicles)
4. Develop an RF link budget: Section 8.4, “Link Budget Analysis,” on page
8-32.
Knowing the power per carrier , you can calcula te an RF link budg et which is used
to predict how much propagation loss can be allowed in the system, while still
providing satisfactory performance throughout the area being covered. The link
budget is a methodical way to derive a “design goal”. If the design goal is provided in advance, the link budget is simply: allowable RF loss = max. power per
carrier – design goal.
5. Determine the appropriate estimated path loss slope that corresponds to the
type of building and its layout, and estimate the coverage distance for each
RAU: Section 8.2, “Estimating RF Coverage,” on page 8-19.
The path loss slope (PLS), which gives a value to the RF propagation characteristics within the building, is used to convert the RF link budget into an estimate of
the coverage distance per antenna. This will help establish the Unison equipment
quantities you will need. The actual path loss slope that corresponds to the specific RF environment inside the building can also be determined empirically by
performing an RF site-survey of the building. This involves transmitting a calibrated tone for a fixed antenna and making measurements with a mobile antenna
throughout the area surrounding the transmitter.
6. Determine the items required to connect to the base station: Section 8.6,
“Connecting a Main Hub to a Base Station,” on page 8-46.
Once you know the quantities of Unison equipment you will use, you can determine the accessories (combiners/dividers, surge suppressors, repeaters, attenuators, circulators, etc.) that are required to connect the system to the base station.
The individual elements that must be considered in designing a Unison solution are
discussed in the following sections.
8-2 InterReach Unison User Guide and Reference Manual
PN 8700-10
620003-0 Rev. A
Page 43

PRELIMINARY Maximum Output Power per Carrier at RAU
8.1 Maximum Output Power per Carrier at RAU
The following tables show the recommended maximum power per carrier out of the
RAU SMA connector for different frequencies, formats, and numbers of carriers.
These limits are dictated by RF signal quality and regulatory emissions issues. The
maximum input power to the Main Hub is determined by subtracting the system gain
from the maximum output power of the RAU. System gain is software selectable
from 0 dB to 15 dB in 1 dB steps. Additionally, both the uplink and downlink RAU
gain can be reduced by 10 dB.
Therefore, when you connect a Main Hub to a base station or repeater, the RF power
per carrier usually needs to be attenuated in order to avoid exceeding Unison’s maximum output power recommendations.
Refer to Section 8.7, “Designing for a Neutral Host System,” on page 8-50 when
combining frequencies or protocols on a single Main Hub.
WARNING: Exceeding the maximum input power could cause permanent damage to the Main Hub.
PN 8700-10 Help Hot Line (U.S. only): 1-800-530-9960 8-3
620003-0 Rev. A
Page 44

Designing a Unison Solution PRELIMINARY
Table 8-1 800 MHz (AMPS) Power per Carrier
Power per
No. of
Carriers
Carrier
(dBm)
110.0
210.0
310.0
410.0
510.0
610.5
79.5
88.5
98.0
10 7.0
11 7.0
12 6.5
13 6.0
14 5.5
15 5.5
16 5.0
20 4.0
30 2.0
WARNING: For 800 MHz AMPS, do not exceed the maximum composite input pow er of 1W (+30 dBm) to the Main Hub at any time.
8-4 InterReach Unison User Guide and Reference Manual
PN 8700-10
620003-0 Rev. A
Page 45

PRELIMINARY Maximum Output Power per Carrier at RAU
Table 8-2 800 MHz (TDMA) Power per Carrier
Power per
No. of
Carriers
110.0
210.0
310.0
410.0
510.0
610.0
79.5
88.5
98.0
10 7.5
11 7.0
12 6.5
13 6.5
14 6.0
15 5.5
16 5.5
20 4.5
30 2.5
Carrier
(dBm)
WARNING: For 800 MHz TDMA, do not exceed the maximum compos-
ite input power of 1W (+30 dBm) to the Main Hub at any time.
PN 8700-10 Help Hot Line (U.S. only): 1-800-530-9960 8-5
620003-0 Rev. A
Page 46

Designing a Unison Solution PRELIMINARY
Table 8-3 800 MHz (CDMA) Power per Carrier
Power per
No. of
Carriers
Carrier
(dBm)
116.0
213.5
312.0
411.0
510.0
69.5
78.5
88.0
WARNING: For 800 MHz CDMA, do not exceed the maximum composite input power of 1W (+30 dBm) to the Main Hub at any time.
8-6 InterReach Unison User Guide and Reference Manual
PN 8700-10
620003-0 Rev. A
Page 47

PRELIMINARY Maximum Output Power per Carrier at RAU
Table 8-4 800 MHz (iDEN) Power per Carrier
Power per
No. of
Carriers
110.0
210.0
310.0
410.0
59.0
68.0
77.0
86.5
96.0
10 5.5
11 5.0
12 4.5
13 4.0
14 4.0
15 3.5
16 3.0
20 2.0
30 0.5
Carrier
(dBm)
WARNING: For 800 MHz iDEN, do not exceed the maximum compos-
ite input power of 1W (+30 dBm) to the Main Hub at any time.
PN 8700-10 Help Hot Line (U.S. only): 1-800-530-9960 8-7
620003-0 Rev. A
Page 48

Designing a Unison Solution PRELIMINARY
Table 8-5 900 MHz (GSM or EGSM) Power per Carrier
Power per
No. of
Carriers
Carrier
(dBm)
110.0
210.0
310.0
410.0
59.0
68.5
78.0
87.5
97.0
10 6.5
11 6.5
12 6.0
13 5.5
14 5.5
15 5.0
16 5.0
WARNING: For 900 MHz GSM or EGSM, do not exceed the maximum
composite input power of 1W (+30 dBm) to the M ain Hub at any time.
8-8 InterReach Unison User Guide and Reference Manual
PN 8700-10
620003-0 Rev. A
Page 49

PRELIMINARY Maximum Output Power per Carrier at RAU
Table 8-6 900 MHz (EDGE) Power per Carrier
Power per
No. of
Carriers
110.0
210.0
310.0
410.0
59.0
68.5
78.0
87.5
97.0
10 6.5
11 6.5
12 6.0
13 5.5
14 5.5
15 5.0
16 5.0
Carrier
(dBm)
WARNING: For 900 MHz EDGE, do not exceed the maximum compos-
ite input power of 1W (+30 dBm) to the Main Hub at any time.
PN 8700-10 Help Hot Line (U.S. only): 1-800-530-9960 8-9
620003-0 Rev. A
Page 50

Designing a Unison Solution PRELIMINARY
Table 8-7 1800 MHz (DCS) Power per Carrier
Power per
No. of
Carriers
Carrier
(dBm)
110.0
210.0
310.0
410.0
510.0
69.5
78.5
87.5
97.0
10 6.5
11 6.0
12 5.5
13 5.0
14 5.0
15 4.5
16 4.0
WARNING: For 1800 MHz DCS, do not exceed the maximum composite input pow er of 1W (+30 dBm) to the Main Hub at any time.
8-10 InterReach Unison User Guide and Reference Manual
PN 8700-10
620003-0 Rev. A
Page 51

PRELIMINARY Maximum Output Power per Carrier at RAU
Table 8-8 1800 MHz (EDGE) Power per Carrier
Power per
No. of
Carriers
110.0
210.0
310.0
410.0
59.0
68.0
77.5
86.5
96.0
10 5.5
11 5.0
12 4.5
13 4.5
14 4.0
15 3.5
16 3.5
Carrier
(dBm)
WARNING: For 1800 MHz EDGE, do not exceed the maximum com-
posite input power of 1W (+30 dBm) to the Main Hub at any time.
PN 8700-10 Help Hot Line (U.S. only): 1-800-530-9960 8-11
620003-0 Rev. A
Page 52

Designing a Unison Solution PRELIMINARY
Table 8-9 1800 MHz (CDMA Korea) Power per Carrier
Power per
No. of
Carriers
Carrier
(dBm)
114.5
212.0
310.5
49.5
58.5
68.0
77.0
86.5
WARNING: For 1800 MHz CDMA (Korea), do not exceed the maximum composite input power of 1W (+30 dBm) to the Main Hub at any
time.
8-12 InterReach Unison User Guide and Reference Manual
PN 8700-10
620003-0 Rev. A
Page 53

PRELIMINARY Maximum Output Power per Carrier at RAU
Table 8-10 1900 MHz (TDMA) Power per Carrier
Power per
No. of
Carriers
110.0
210.0
310.0
410.0
510.0
69.0
78.0
87.0
96.5
10 6.0
11 5.5
12 5.0
13 5.0
14 4.5
15 4.0
16 4.0
20 3.0
30 1.0
Carrier
(dBm)
WARNING: For 1900 MHz TDMA, do not exceed the maximum com-
posite input power of 1W (+30 dBm) to the Main Hub at any time.
PN 8700-10 Help Hot Line (U.S. only): 1-800-530-9960 8-13
620003-0 Rev. A
Page 54

Designing a Unison Solution PRELIMINARY
Table 8-11 1900 MHz (GSM) Power per Carrier
Power per
No. of
Carriers
Carrier
(dBm)
110.0
210.0
310.0
410.0
510.0
69.5
78.5
87.5
97.0
10 6.5
11 6.0
12 5.5
13 5.0
14 5.0
15 4.5
16 4.0
WARNING: For 1900 MHz GSM, do not exceed the maximum composite input pow er of 1W (+30 dBm) to the Main Hub at any time.
8-14 InterReach Unison User Guide and Reference Manual
PN 8700-10
620003-0 Rev. A
Page 55

PRELIMINARY Maximum Output Power per Carrier at RAU
Table 8-12 1900 MHz (CDMA) Power per Carrier
Power per
No. of
Carriers
Carrier
(dBm)
114.5
212.0
310.5
49.5
58.5
68.0
77.0
86.5
WARNING: For 1900 MHz CDMA, do not exceed the maximum composite input power of 1W (+30 dBm) to the Main Hub at any time.
PN 8700-10 Help Hot Line (U.S. only): 1-800-530-9960 8-15
620003-0 Rev. A
Page 56
Designing a Unison Solution PRELIMINARY
Table 8-13 1900 MHz (EDGE) Power per Carrier
Power per
No. of
Carriers
Carrier
(dBm)
110.0
210.0
310.0
410.0
59.0
68.0
77.5
86.5
96.0
10 5.5
11 5.0
12 4.5
13 4.5
14 4.0
15 3.5
16 3.5
WARNING: For 1900 MHz EDGE, do not exceed the maximum composite input power of 1W (+30 dBm) to the Main Hub at any time.
8-16 InterReach Unison User Guide and Reference Manual
PN 8700-10
620003-0 Rev. A
Page 57

PRELIMINARY Maximum Output Power per Carrier at RAU
Table 8-14 2.1 GHz (WCDMA) Power per Carrier
Power per
No. of
Carriers
Carrier
(dBm)
114.5
211.0
38.5
47.0
56.0
65.0
74.5
83.5
WARNING: For 2.1 GHz WCDMA, do not exceed the maximum composite input power of 1W (+30 dBm) to the Main Hub at any time.
PN 8700-10 Help Hot Line (U.S. only): 1-800-530-9960 8-17
620003-0 Rev. A
Page 58

Designing a Unison Solution PRELIMINARY
Allowing for Future Capacity Growth
Sometimes a Unison deployment initially is used to enhance coverage. Later that
same system may also need to provide increased capacity. Thus, the initial deployment might only transmit two carriers but need to transmit four carriers later. There
are two options for dealing with this scenario:
1. Desig n the initial coverage with a maximum power per carrier for four carriers.
2. Design the initial coverage for two carriers but leave Expansion Hub ports
unused. These ports can be used later if coverage holes are discovered once the
power per carrier is lowered to accommodate the two additional carriers.
8-18 InterReach Unison User Guide and Reference Manual
PN 8700-10
620003-0 Rev. A
Page 59

PRELIMINARY Estimating RF Coverage
8.2 Estimating RF Coverage
The maximum power per carrier (based on the number and type of RF carriers that
are being transmitted) and the minimum acceptable received power at the wireless
device (i.e., RSSI, the design goal) establish the RF link budget, and consequently the
maximum acceptable path loss between the antenna and the wireless device.
Figure 8-1 Determining Path Loss between the Antenna and the Wireless Device
Antenna and Gain (G)
RAU
P = power per
carrier from the RAU
d
RSSI = power at the
wireless device
(P + L
+ G) – RSSI = PL (1)
coax
The path loss (PL) is the loss in decibels (dB) between the antenna and the wireless
device. The distance, d, from the antenna cor responding to this path loss can b e calculated using the path loss equations in Section 8.2.1 and in Section 8.2.2.
The following table lists coaxial cable loss.
Table 8-15 Coaxial Cable Losses
Length of
Cable
0.9 m (3 ft) 0.4 0.6
1.8 m (6 ft) 0.9 1.4
3.0 m (10 ft) 1.5 2.4
Loss at
800 MHz
(dB)
Loss at
1900 MHz
(dB)
PN 8700-10 Help Hot Line (U.S. only): 1-800-530-9960 8-19
620003-0 Rev. A
Page 60

Designing a Unison Solution PRELIMINARY
8.2.1 Path Loss Equation
Indoor path loss obeys the distance power law1 in equation (2):
PL = 20log(4πd
f/c) + 10nlog(d/d0) + Χ
0
s
where:
• PL is the path loss at a distance, d, from the antenna (the distance between the
antenna that is connected to the RAU and the point where the RF signal
decreases to the minimum acceptable level at the wireless device).
•d
is usually taken as 1 meter of free-space.
0
• f is the operating frequency in hertz.
8
• c is the speed of light in a vacuum (3.0 × 10
m/sec).
• n is the path loss exponent and depends on the building “clutter”.
•
Χ
is a normal random variable that depends on partition losses inside the build-
s
ing, and therefore, depends on the frequency of operation.
As a reference, the following table gives estimates of signal loss for some RF barriers .
Table 8-16 Average Signal Loss of Common Building Materials
Partition Type
Metal wall 26 815
Aluminum siding 20 8 15
Foil insulation 4 815
Cubicle walls 1.4 900
Concrete block wall 13 1300
Concrete floor 10 1300
Sheetrock 1 to 2 1300
Light machinery 3 1300
General machiner y 7 1300
Heavy machinery 11 1300
Equipment racks 7 1300
Assembly line 6 1300
Ceiling duct 5 1300
Metal stairs 5 1300
Loss (dB)
@ <2 GHz Frequency (MHz)
(2)
1
1. Rappaport, Theodor e S. Wireless Communications, Principles, and Practice. Prentice Hall PTR, 1996.
8-20 InterReach Unison User Guide and Reference Manual
PN 8700-10
620003-0 Rev. A
Page 61

PRELIMINARY Coverage Distance
8.2.2 Coverage Distance
Equations (1) and (2), on pages 8-19 and 8-20, respectively, can be used to estimate
the distance from the antenna to where the RF signal decreases to the minimum
acceptable level at the wireless device.
Equation (2) can be simplified to:
PL(d) = 20log(4πf/c) + PLSlog(d) (3)
where PLS (path loss slope) is chosen to account for the building’s environment.
Because different frequencies penetrate partitions with different losses, the value of
PLS will vary depending on the frequency.
T able 8-17 shows estimated path loss slope (PLS) for various environments that have
different “clutter” (i.e., objects that attenuate the RF signals, such as walls, partitions,
stairwells, equipment racks, etc.)
Table 8-17 Estimated Path Loss Slope for Different In-Building Environments
Facility
Manufacturing 35 32
Hospital 39.4 38.1
Airport 35 32
Retail 36.1 33.1
Warehouse 35 32
Parking Garage 33.7 30.1
Office: 80% cubicle/20% hard wall 36.1 33.1
Office: 50% cubicle/50% hard wall 37.6 34.8
Office: 20% cubicle/80% hard wall 39.4 38.1
PLS for
800/900 MHz
PLS for
1800/1900 MHz
For simplicity, Equation (3) can be used to estimate the coverage distance of an
antenna that is connected to an RAU, for a given path loss, frequency, and type of
in-building environment.
PN 8700-10 Help Hot Line (U.S. only): 1-800-530-9960 8-21
620003-0 Rev. A
Page 62
Designing a Unison Solution PRELIMINARY
Table 8-18 gives the value of the first term of Equation (3) (i.e., (20log(4πf/c)) for
various frequency bands.
Table 8-18 Frequency Bands and the Value of the first Term in Equation (3)
Band (MHz)
Mid-Band
Frequency
(MHz) 20log(4πf/c)Uplink Downlink
800 MHz Cellular 824–849 869–894 859 31.1
800 MHz iDEN 806–824 851–869 837.5 30.9
900 MHz GSM 890–915 935–960 925 31.8
900 MHz EGSM 880–915 925–960 920 31.7
1800 MHz DCS 1710–1785 1805–1880 1795 37.5
1800 MHz CDMA (Korea) 1750–1780 1840–1870 1810 37.6
1900 MHz PCS 1850–1910 1930–1990 1920 38.1
2.1 GHz UMTS 1920–1980 2110–2170 2045 38.7
8-22 InterReach Unison User Guide and Reference Manual
PN 8700-10
620003-0 Rev. A
Page 63

PRELIMINARY Coverage Distance
For reference, Tables 8-19 through 8-25 show the di s tance cover e d by an anten na for
various in-building environments. The following assumptions were made:
• Path loss Equation (3)
• 6 dBm output per carrier at the RAU output
• 3 dBi antenna gain
• RSSI = –85 dBm (typical for narrowband protocols, but not for spread-spectrum protocols)
Table 8-19 Approximate Radiated Distance from Antenna
for 800 MHz Cellular Applications
Distance from Antenna
Facility
Manufacturing 63 205
Hospital 39 129
Airport 63 205
Retail 55 181
Warehouse 63 205
Parking Garage 73 241
Office: 80 % cubicle/20% har d w al l 55 181
Office: 50 % cubicle/50% har d w al l 47 154
Office: 20 % cubicle/80% har d w al l 39 129
Table 8-20 Approximate Radiated Distance from Antenna
Meters Feet
for 800 MHz iDEN Applications
Distance from Antenna
Facility
Manufacturing 64 208
Hospital 40 131
Airport 64 208
Retail 56 184
Warehouse 64 208
Parking Garage 75 244
Office: 80 % cubicle/20% har d w al l 56 184
Office: 50 % cubicle/50% har d w al l 48 156
Office: 20 % cubicle/80% har d w al l 40 131
Meters Feet
PN 8700-10 Help Hot Line (U.S. only): 1-800-530-9960 8-23
620003-0 Rev. A
Page 64

Designing a Unison Solution PRELIMINARY
Table 8-21 Approximate Radiated Distance from Antenna
for 900 MHz GSM Applications
Distance from Antenna
Facility
Meters Feet
Manufacturing 60 197
Hospital 38 125
Airport 60 197
Retail 53 174
Warehouse 60 197
Parking Garage 7 0 230
Office: 80% cubicle/20% hard wall 53 174
Office: 50% cubicle/50% hard wall 45 148
Office: 20% cubicle/80% hard wall 38 125
Table 8-22 Approximate Radiated Distance from Antenna
for 900 MHz EGSM Applications
Distance from Antenna
Facility
Manufacturing 60 197
Hospital 38 125
Airport 60 197
Retail 53 174
Warehouse 60 197
Parking Garage 7 0 231
Office: 80% cubicle/20% hard wall 53 174
Office: 50% cubicle/50% hard wall 45 149
Office: 20% cubicle/80% hard wall 38 125
Meters Feet
8-24 InterReach Unison User Guide and Reference Manual
PN 8700-10
620003-0 Rev. A
Page 65

PRELIMINARY Coverage Distance
Table 8-23 Approximate Radiated Distance from Antenna
for 1800 MHz DCS Applications
Distance from Antenna
Facility
Meters Feet
Manufacturing 58 191
Hospital 30 100
Airport 58 191
Retail 51 167
Warehouse 58 191
Parking Garage 75 246
Office: 80 % cubicle/20% har d w al l 50 166
Office: 50 % cubicle/50% har d w al l 42 137
Office: 20 % cubicle/80% har d w al l 30 100
Table 8-24 Approximate Radiated Distance from Antenna
for 1800 MHz CDMA (Korea) Applications
Distance from Antenna
Facility
Manufacturing 58 191
Hospital 30 100
Airport 58 191
Retail 51 167
Warehouse 58 191
Parking Garage 75 247
Office: 80 % cubicle/20% har d w al l 51 167
Office: 50 % cubicle/50% har d w al l 42 138
Office: 20 % cubicle/80% har d w al l 30 100
Meters Feet
PN 8700-10 Help Hot Line (U.S. only): 1-800-530-9960 8-25
620003-0 Rev. A
Page 66

Designing a Unison Solution PRELIMINARY
Table 8-25 Approximate Radiated Distance from Antenna
for 1900 MHz PCS Applications
Distance from Antenna
Facility
Meters Feet
Manufacturing 56 183
Hospital 29 96
Airport 56 183
Retail 49 160
Warehouse 56 183
Parking Garage 7 2 236
Office: 80% cubicle/20% hard wall 49 160
Office: 50% cubicle/50% hard wall 40 132
Office: 20% cubicle/80% hard wall 29 96
Table 8-26 Approximate Radiated Distance from Antenna
for 2.1 GHz UMTS Applications
Distance from Antenna
Facility
Manufacturing 54 176
Hospital 28 93
Airport 54 176
Retail 47 154
Warehouse 54 176
Parking Garage 6 9 226
Office: 80% cubicle/20% hard wall 47 154
Office: 50% cubicle/50% hard wall 39 128
Office: 20% cubicle/80% hard wall 28 93
Meters Feet
8-26 InterReach Unison User Guide and Reference Manual
PN 8700-10
620003-0 Rev. A
Page 67

PRELIMINARY Examples of Design Est imates
8.2.3 Examples of Design Estimates
Example Design Estimate for an 800 MHz TDMA Application
1. Design goals:
• Cellular (859 MHz = average of the lowest uplink and the highest downlink
frequency in 800 MHz Cellular band)
• TDMA provider
• 6 TDMA carriers in the system
• –85 dBm design goal (to 95% of the building) — the min imum received p ower
at the wireless device
• Base station with simplex RF connections
2. Power Per Carrier: The tables in Section 8.1, “Maximum Output Power per Car-
rier at RAU,” on page 8-3 provide maximum power per carrier information. The
800 MHz TDMA table (on page 8-5) indicates that Unison can support 6 carriers
with a recommended maximum power per carrier of 10.5 dBm. The input power
should be set to the desired output power minus the system gain.
3. Building information:
• 8 floor b uilding with 9,290 sq. met ers (100,0 00 sq. ft.) per floor; total 74,322
sq. meters (800,000 sq. ft.)
• Walls are sheetrock construction; suspended ceiling tiles
• Antennas used will be omni-directional, ceiling mounted
• Standard office environment, 50% hard wall offices and 50% cubicles
4. Link Budget: In this example, a design goal of –85 dBm is used. Suppose 3 dBi
omni-directional antennas are used in the design. Then, the maximum RF propagation loss should be no more than 98.5 dB (10.5 dBm + 3 dBi + 85 dBm) over
95% of the area being covered. It is important to note that a design goal such as
–85 dBm is usually derived taking into account multipath fading and log-normal
shadowing characteristics. Thus, this design goal will only be met “on average”
over 95% of the area being covered. At any given point, a fade may bring the signal level underneath the design goal.
Note that this method of calculating a link budget is only for the downlink path.
For information to calculate link budgets for both the downli nk and upli nk paths,
see Section 8.4 on page 8-32.
5. Path Loss Slope: For a rough estimate, Table8-17, “Estimated Path Loss Slope for
Different In-Building Enviro nments” on page 8-21, sh ows that a building with 50%
hard wall offices and 50% cubi cles, at 859 MHz, has an appro ximate path loss slope
(PLS) of 37.6. Given the RF link budget of 98.5 dB, the distance of coverage from
each RAU will be 62 meters (203 ft). This corre sponds to a coverage area of
12,079 sq. meters (129,952 sq. ft.) per RAU (see Section 8.2.1 for details on path
loss estimation). For this case we assumed a circular radiation pattern, though the
actual area covered will depend upon the pattern of the antenna and the obstructions
in the facility.
PN 8700-10 Help Hot Line (U.S. only): 1-800-530-9960 8-27
620003-0 Rev. A
Page 68

Designing a Unison Solution PRELIMINARY
Equipment Required: Since you know the building size, you can now estimate
the Unison equipment quantities that will be needed. Before any RF levels are
tested in the building, you can estimate that 2 antennas per level will be needed.
a. 1 antenna per floor × 8 floors = 8 RAUs
b. 8 RAUs ÷ 8 (max 8 RAUs per Expansion Hub) = 1 Expansion Hub
c. 1 Expansion Hubs ÷ 4 (max 4 Expansion Hubs per Main Hub) = 1 Main Hub
Check that the MMF and Cat-5 cable distances are as recommended. If the distances differ, use the tables in Section 8.3, “System Gain,” on page 8-31 to determine system gains or losses. The path loss may need to be recalculated to assure
adequate signal levels in the required coverage distance.
The above estimates assume that all cable length requirements are met. If Expansion
Hubs cannot be placed so that the RAUs are within the distance requirement, additional Expansion Hubs may need to be placed closer to the required RAUs locations.
An RF Site Survey and Building Evaluation is required to accurately establish the
Unison equipment quantities required for the building. The site survey measures the
RF losses within the building to determine the actual PLS, which will be used in the
final path loss formula to determine the actual requirements of the Unison system.
8-28 InterReach Unison User Guide and Reference Manual
PN 8700-10
620003-0 Rev. A
Page 69

PRELIMINARY Examples of Design Est imates
Example Design Estimate for an 1900 MHz CDMA Application
1. Design goals:
• PCS (1920 MHz = average of the lowest uplink and the highest downlink frequency in 1900 MHz PCS band)
• CDMA provider
• 8 CDMA carriers in the system
• –85 dBm design goal (to 95% of the building) — the min imum received p ower
at the wireless device
• Base station with simplex RF connections
2. Power Per Carrier: The tables in Section 8.1, “Maximum Output Power per Car-
rier at RAU,” on page 8-3 provide maximum power per carrier information. The
1900 MHz CDMA table (on page 8-15) indicates that Unison can support 8 carriers with a recommended maximum power per carrier of 6.5 dBm. The input
power should be set to the desired output power minus the system gain.
3. Building information:
• 16 floor building with 9,290 sq. meters (100,000 sq. ft.) per floor; total
148,640 sq. meters (1,600,000 sq. ft.)
• Walls are sheetrock construction; suspended ceiling tiles
• Antennas used will be omni-directional, ceiling mounted
• Standard office environment, 80% hard wall offices and 20% cubicles
4. Link Budget: In this example, a design goal of –85 dBm is used. Suppose 3 dBi
omni-directional antennas are used in the design. Then, the maximum RF propagation loss should be no more than 94.5 dB (6.5 dBm + 3 dBi + 85 dBm) over
95% of the area being covered. It is important to note that a design goal such as
–85 dBm is usually derived taking into account multipath fading and log-normal
shadowing characteristics. Thus, this design goal will only be met “on average”
over 95% of the area being covered. At any given point, a fade may bring the signal level underneath the design goal.
Note that this method of calculating a link budget is only for the downlink path.
For information to calculate link budgets for both the downli nk and upli nk paths,
see Section 8.4 on page 8-32.
5. Path Loss Slope: For a rough estimate, Table8-17, “Estimated Path Loss Slope for
Different In-Building Enviro nments” on page 8-21, sh ows that a building with 80%
hard wall offices and 20% cubicles, at 1920 MHz, ha s an appro ximate path loss
slope (PLS) of 38.1. Given the RF link budget of 94.5dB, the distance of coverage
from each RAU will be 50 meters (166 ft). This corresponds to a coverage area of
8,031 sq. meters (86,404 sq. ft.) per RAU (see Section 8.2.1 for details on path loss
estimation). For this case we assumed a circular radiation pattern, though the actual
area covered will depend upon the pattern of the antenna and the obstructions i n the
facility.
PN 8700-10 Help Hot Line (U.S. only): 1-800-530-9960 8-29
620003-0 Rev. A
Page 70

Designing a Unison Solution PRELIMINARY
6. Equipment Required: Since you know the building size, you can now estimate
the Unison equipment quantities that will be needed. Before any RF levels are
tested in the building, you can estimate that 2 antennas per level will be needed.
a. 2 antennas per floor × 16 floors = 32 RAUs
b. 32 RAUs ÷ 8 (max 8 RAUs per Expansion Hub) = 4 Expansion Hubs
c. 4 Expansion Hubs ÷ 4 (max 4 Expansion Hubs per Main Hub) = 1 Main Hub
Check that the MMF and Cat-5 cable distances are as recommended. If the distances differ, use the tables in Section 8.3, “System Gain,” on page 8-31 to determine system gains or losses. The path loss may need to be recalculated to assure
adequate signal levels in the required coverage distance.
The above estimates assume that all cable length requirements are met. If Expansion
Hubs cannot be placed so that the RAUs are within the distance requirement, additional Expansion Hubs may need to be placed closer to the required RAUs locations.
An RF Site Survey and Building Evaluation is required to accurately establish the
Unison equipment quantities required for the building. The site survey measures the
RF losses within the building to determine the actual PLS, which will be used in the
final path loss formula to determine the actual requirements of the Unison system.
8-30 InterReach Unison User Guide and Reference Manual
PN 8700-10
620003-0 Rev. A
Page 71

PRELIMINARY System Gain
8.3 System Gain
The system gain can be decreased from 15 dB to 0 dB gain in 1 dB increments and
the uplink and downlink gain of any RAU can be decreased by 10 dB in one step
using AdminManager or OpsConsole.
8.3.1 System Gain (Loss) Relative to ScTP Cable Length
The recommended minimum length of ScTP cab le is 2 0 meters (66 ft) and the recommended maximum length is 100 meters (328 ft). If the ScTP cable is less than 10
meters (33 ft), system performance may not meet specifications. If the ScTP cable is
longer than 100 meters (328 ft), the gain of the system will decrease, as shown in
Table 8-27.
Table 8-27 System Gain (Loss) Relative to ScTP Cable Length
Typical change in system gain (dB)
ScTP Cable
Length
800 MHz TDMA/AMPS and CDMA; 900 MHz GSM and
EGSM; and iDEN
110 m / 361 ft –1.0 –0.7
120 m / 394 ft –3.2 –2.4
130 m / 426 ft –5.3 –4.1
140 m / 459 ft –7.5 –5.8
150 m / 492 ft –9.7 –7.6
1800 MHz GSM (DCS); 1900 MHz TDMA, CDMA, and GSM
110 m / 361 ft –1.0 –0.7
120 m / 394 ft –4.0 –2.4
130 m / 426 ft –6.4 –4.1
140 m / 459 ft –8.8 –5.8
150 m / 492 ft –11.3 –7.6
2.1 GHz UMTS
110 m / 361 ft –1.0 –0.7
120 m / 394 ft –3.2 –2.4
130 m / 426 ft –5.3 –4.1
140 m / 459 ft –7.5 –5.8
150 m / 492 ft –9.7 –7.6
Downlink Uplink
PN 8700-10 Help Hot Line (U.S. only): 1-800-530-9960 8-31
620003-0 Rev. A
Page 72
Designing a Unison Solution PRELIMINARY
8.4 Link Budget Analysis
A link budget is a methodical way to account for th e gains and losses in an RF system
so that the quality of coverage can be predicted. The end result can often be stated as
a “design goal” in which the coverage is determined by the maximum distance from
each RAU before the signal strength falls beneath that goal.
One key feature of the link budget is the maximum power per carrier discussed in
Section 8.1. While the maximum power per carrier is important as far as emissions
and signal quality requirements are concerned, it is critical that the maximum signal
into the Main Hub never exceed 1W (+30 dBm). Composite power levels above this
limit will cause damage to the Main Hub.
WARNING: Exceeding the maximum input power of 1W (+30 dBm)
could cause permanent damage to the Main Hub.
8-32 InterReach Unison User Guide and Reference Manual
PN 8700-10
620003-0 Rev. A
Page 73

PRELIMINARY Elements of a Link Budget for Narrowband Standards
8.4.1 Elements of a Link Budget for Narrowband Standards
The link budget represents a typical calculation that might be used to determine how
much path loss can be afforded in a Unison desi gn. This link budget analy zes both the
downlink and uplink paths. For most configurations, the downlink requires lower
path loss and is therefore the limiting factor in the system design. It is for this reason
that a predetermined “design goal” for the downlink is sufficient to predict coverage
distance.
The link budget is organized in a simple manner: the transmitted power is calculated,
the airlink losses due to fading and body loss are summed, and the receiver sensitivity
(minimum level a signal can be received for acceptable call quality) is calcula ted. The
maximum allowable path loss (in dB) is the difference between the transmitted
power, less the airlink losses, and the receiver sensitivity. From the path loss, the
maximum coverage distance can be estimated using the path loss formula presented
in Section 8.2.1.
Table 8-28 provides link budget considerations for narrowband systems.
Table 8-28 Link Budget Considerations for Narrowband Sys tem s
Consideration Description
BTS Transmit Power The power per carrier transmitted from the base station output
Attenuation between
BTS and Unison
Antenna Gain The radiated outp ut power includes antenna gain. F or example, if you use a 3 dBi antenna at the
BTS Noise Figure This is the effective noise floor of the base station input (usually base station sensitivity is this effec-
Unison Noise Figure This is Unison’s uplink noise figure, which varies depending on the number of Expansion Hubs and
This includes all losses: cable, attenuator, splitter/combiner, and so forth.
On the downlink, attenuation must be chosen so that the maximum power per carrier going into the
Main Hub does not exceed the levels given in Section 8.1.
On the uplink, attenuation is cho se n to kee p th e max im um up lin k si gn a l and no ise leve l lo w eno ug h
to prevent base station alarms but small enough not to cause degradation in the system sensitivity.
If the Unison noise figure minus the attenuation is at least 10 dB higher than the BTS noise figure,
the system noise figure will be approximately that of Unison alone. See Section 8.6 for ways to independently set the uplink and downlink attenuations between the base station and Unison.
RAU that is transmitting 0 dBm per carrier, the effective radiated power (relative to an isotropic
radiator) is 3 dBm per carrier.
tive noise floor plus a certain C/I ratio).
RAUs, and the frequency band. Unison’s uplink noise figure is spe c ified for a 1-1-4 configuration.
Thus, the noise figure for a Unison system (or multiple systems whose uplink ports are power combined) will be NF(1-1-4) + 10*log(# of Expansion Hubs). This represents an upper-bound because
the noise figure is lower if any of the Expansion Hub’s RAU ports are not used.
PN 8700-10 Help Hot Line (U.S. only): 1-800-530-9960 8-33
620003-0 Rev. A
Page 74
Designing a Unison Solution PRELIMINARY
Table 8-28 Link Budget Considerations for Narrowband Systems (continued)
Consideration Description
Thermal Noise This is the noise level in the signal bandwidth (BW).
Thermal noise power = –174 dBm/Hz + 10Log(BW).
Protocol
Signal
Bandwidth
Thermal
Noise
TDMA 30 kHz –129 dBm
GSM 200 kHz –121 dBm
iDEN 25 kHz –130 dBm
Required C/I ratio For each wire le ss st andard a certain C/I (carrier to interference) ratio is needed to obtain acceptable
demodulation performance. For narrowband systems, (TDMA, GSM, EDGE, iDEN, AMPS) this
level varies fr om about 9 dB to 20 dB.
Mobile Transmit
The maximum power the mobile can transmit (power transmitted at highest power level setting).
Power
Multipath Fade
Margin
This margin allows for a certain level of fading due to multipath interference. Inside buildings there
is often one or more fairly strong signals and many weaker signals arriving from reflections and diffraction. Signals arriving from multiple paths add constructively or destructively. This margin
accounts for the possibility of destructive multip ath in ter feren ce. In RF site surveys this margin will
not appear because it will be averaged out over power level samples tak en over many locations.
Log-normal Fade
Margin
This margin adds an allowance for RF shadowing due to objects obstructing the direct path between
the mobile equipment and the RAU. In RF site surveys, this shadowing will not appear because it
will be averaged out over power level samples taken over many locations.
Body Loss This accounts for RF att e nuation caused by th e user’s head and body.
Minimum Received
Signal Level
This is also ref e rr e d t o a s the “design goal”. The link budget sa ys th at you can achieve adequate cov-
erage if the signal level is, on average, above this level over 95% of the area covered, for example.
8-34 InterReach Unison User Guide and Reference Manual
PN 8700-10
620003-0 Rev. A
Page 75

PRELIMINARY Narrowband Link Budget Analy s is for a Microcell Applicatio n
8.4.2 Narrowband Link Budget Analysis for a Microcell Applicat ion
Narrowband Link Budget Analysis: Downlink
Line Downlink
Tra nsmitter
a. BTS transmit power per carrier (dBm) 33
b. Attenuation between BTS and Unison (dB) –23
c. Power into Unison (dBm) 10
d. Unison gain (dB) 0
e. Antenna gain (dBi ) 3
f. Radiated power per carrier (dBm) 13
Airlink
g. Multipath fade margin (dB) 6
h. Log-normal fade margin with 8 dB std. deviation, edge reliability 90%
(dB)
i. Body loss (dB) 3
j. Airlink losses (not including facility path loss) 19
10
Receiver
k. Thermal noise (dBm/30 kHz) –129
l. Mobile noise figure (dB) 7
m. Required C/I ratio (dB) 12
n. Minimum received signal (dBm) –110
p. Maximum path loss (dB) 104
• c = a + b
• f = c + d + e
• j = g + h + i
• n = k + l + m
• k: in this example, k represents the thermal noise for a TDMA signal, which
has a bandwidth of 30 kHz
•p = f – j – n
PN 8700-10 Help Hot Line (U.S. only): 1-800-530-9960 8-35
620003-0 Rev. A
Page 76

Designing a Unison Solution PRELIMINARY
Narrowband Link Budget Analysis: Uplink
Line Uplink
Receiver
a. BTS noise figure (dB) 4
b. Attenuation between BTS and Unison (dB) –10
c. Unison gain (dB) 0
d. Unison noise figure (dB) 1-4-32 22
e. System noise figure (dB) 22.6
f. Thermal noise (dBm/30 kHz) –129
g. Required C/I ratio (dB) 12
h. Antenna gain (dBi) 3
i. Receive sensitivity (dBm) –97.4
Airlink
j. Multipath fade margin (dB) 6
k. Log-norm al fad e ma r g in with 8 d B std. d e via tio n , edg e reliability 90%
(dB)
l. Body loss (dB) 3
m. Airlink losses (not including facility path loss) 19
10
Transmitter
n. Mobile transmit power (dBm) 28
p. Maximum path loss (dB) 106.4
• e: enter the noise figure and gain of e ach syst em component (a, b, c, and d ) into
the standard cascaded noise figure formula
– 1
F
F
= F1 + + + ....
sys
where
F = 10
G = 10
(See Rappaport, Theodore S. Wireless Communications, Principles, and Practice. Prentice Hall PTR, 1996.)
2
G
(Noise Figure/10)
(Gain/10)
F3 – 1
G
1
1G2
• i = f + e + g – h
• m = j + k + l
• p = n – m – i
8-36 InterReach Unison User Guide and Reference Manual
PN 8700-10
620003-0 Rev. A
Page 77

PRELIMINARY Elements of a Link Bu dge t for CDMA Standards
8.4.3 Elements of a Link Budget for CDMA Standards
A CDMA link budget is slightly more complicated because the spread spectrum
nature of CDMA must be considered. Unlike narrowband standards such as TDMA
and GSM, CDMA signals are spread over a relatively wide frequency band. Upon
reception, the CDMA signal is de-spread. In the de-spreading process the power in
the received signal becomes concentrated into a narrow ban d, whereas the no ise level
remains unchanged. Hence, the signal-to-noise ratio of the de-spread signal is higher
than that of the CDMA signal before de-spreading . This increase is called processing
gain. For IS-95 and J-STD-008, the processing gain is 21 dB or 19 dB depending on
the user data rate (9.6 Kbps for rate set 1 and 14.4 Kbps for rate set 2, respectively).
Because of the processing gain, a CDMA sig nal (comprising on e Walsh code channel
within the composite CDMA signal) can be received at a lower level than that
required for narrowband signals. A reasonable level is –95 dBm, which results in
about –85 dBm composite as shown below.
An important issue to keep in mind is that the downlink CDMA signal is composed of
many orthogonal channels: pilot, paging, sync, and traffic. The composite power
level is the sum of the powers from the individual channels. An example is given in
the following table.
Table 8-29 Distribution of Power within a CDMA Signal
Channel Walsh Code Number Relative Power Level
Pilot 0 20% –7.0 dB
Sync 32 5% –13.3 dB
Primary Paging 1 19% –7.3 dB
Traffic 8–31, 33–63 9% (per traffic channel) –10.3 dB
This table assumes that there are 15 active traffic channels operating with 50% voice
activity (so that the total power adds up to 100%). Notice that the pilot and sync channels together contribute about 25% of the power. When measuring the power in a
CDMA signal you must be aware that if only the pilot and sync channels are active,
the power level will be about 6 to 7 dB lower than the maximum power level you can
expect when all voice channels are active. The implication is that if only the pilot and
sync channels are active, and the maximum power per carrier table says that you
should not exceed 10 dBm for a CDMA signal, for example, then you should set the
attenuation between the base station and the Main Hub so that the Main Hub receives
3 dBm (assuming 0 dB sy stem gain).
An additional consideration for CDMA systems is that the uplink and downlink paths
should be gain and noise balanced. This is requi red for pr oper operati on of sof t -han doff to the outdoor network as well as preventing excess interference that is caused by
mobiles on the indoor system transmitting at power levels that are not coordinated
with the outdoor mobiles. This balance is achieved if the power level transmitted by
the mobiles under close-loop power control is similar to the power level transmitted
under open-loop power control. The open-loop power control equation is
P
+ PRX = –73 dBm (for Cellular, IS-95)
TX
+ PRX = –76 dBm (for PCS, J-STD-008)
P
TX
PN 8700-10 Help Hot Line (U.S. only): 1-800-530-9960 8-37
620003-0 Rev. A
Page 78

Designing a Unison Solution PRELIMINARY
where PTX is the mobile’s transmitted power and PRX is the power received by the
mobile.
The power level transmitted under closed-loop power control is adjusted by the base
station to achieve a certain E
ence between these power levels, ∆
ated from the RAU, P
∆
= P
P
downink
+ P
downink
uplink
(explained in Table 8-30 on page 8-38 ). The differ-
b/N0
, can be estimated by comparing the power radi-
P
, to the minimum received signal, P
, at the RAU:
uplink
+ 73 dBm (for Cellular)
= P
∆
P
It’s a good idea to keep –12 dB < ∆
downink
+ P
+ 76 dBm (for PCS)
uplink
P
< 12 dB.
Table 8-30 provides link budget considerations for CDMA systems.
Table 8-30 Additional Link Budget Considerations for CDMA
Consideration Description
Multipath Fade
Margin
Power per carrier, downlink
Information Rate Th is is simply
Process Gain The process of de-spreading the de sired signal boosts that si gnal relative to the noi s e and interference.
The multipath fade margin can be reduced (by at least 3 dB) by using different lengths of optical fiber (this
is called “delay diversity”). Th e delay over fiber is approximately 5µS /km. If the difference in fiber
lengths to Expansi on Hubs with overlapping coverage areas produces at least 1 chip (0.8µS) delay of one
path relative to the othe r, then the multipaths’ signals can be resolved and p roc essed in dep ende n tly by th e
base station’s rake receiver. A CDMA signal traveling through 163 meters of MMF cable will be delayed
by approximatel y on e ch ip .
This depends on how many channels are active. For example, the signal will be about 7 dB lower if only
the pilot, sync, and paging channels are active compared to a fully-loaded CDMA signal. Furthermore, in
the CDMA forward link, voice channels are turned off when the user is not speaking. On average this is
assumed to be about 50% of the time. So, in the spreadsheet, both the power per Walsh code channel (representing how much signal a mobile will receive on the Walsh code that it is de-spreading) and the total
power are use d.
The channel power is needed to determine the maximum path loss, and the total power is needed to determine how hard the Unison system is being driven.
The total power for a fully-loaded CDMA signal is given by (approximately):
total power =
voice channel power + 13 dB + 10log
10
(50%)
= voice channel power + 10 dB
10log
(9.6 Kbps) = 40 dB for rate set 1
10
(14.4 Kbps) = 42 dB for rate set 2
10log
10
This gain needs to be included in the link budget. In the following formulas, P
P
= 10log10(1.25 MHz / 9.6 Kbps) = 21 dB rate set 1
G
= 10log10(1.25 MHz / 14.4 Kbps) = 19 dB rate set 2
P
G
Note that the process gain can also be expressed as 10log
(CDMA bandwidth) minus the information
10
= process gain:
G
rate.
8-38 InterReach Unison User Guide and Reference Manual
PN 8700-10
620003-0 Rev. A
Page 79

PRELIMINARY Elements of a Link Bu dge t for CDMA Standards
Table 8-30 Additional Link Budget Considerat ions for CDMA (continued)
Consideration Description
Eb/No This is the energy-per-bit divided by the received noise and interference. It’s the CDMA equivalent of sig-
nal-to-noise ratio (SNR). This figure depends on the mobile’ s recei ver and the multipat h environment. Fo r
example, the multipath delays inside a building are usually too small for a rake receiver in the mobile (or
base station) to resolve and coherently c ombine multipath c ompone nts. However, if artificial delay can be
introduced by, for instance, using different lengths of cable, then the required Eb/No will be lower and the
multipath fade m argin in the link budget can be reduced in some case s .
If the receiver noise figure is NF (dB), then the receive sensitivity (dBm) is given by:
= NF + Eb/No + thermal noise in a 1.25 MHz band – P
P
sensitivity
= NF + E
– 113 (dBm/1.25 MHz) – P
b/No
G
Noise Rise On the uplink, the noise floor is determined not only by the Unison system, but also by the number of
mobiles that are transmittin g. This is because when the base station attempts to de-spread a particular
mobile’s signal, all other mobile signals appear to be noise. Because the noise floor rises as more mobiles
try to communicate with a base stati on, the more mobile s th ere are , t he more p ower th e y have to tran smit .
Hence, the noise floor rises rapidly:
noise rise = 10log
(1 / (1 – loading))
10
where loading is the number of users as a percentage of the the oret i cal maximum number of users.
Typically, a base station is set to limit the loading to 75%. This noise ratio must be included in the link
budget as a worst-case condition for uplink sensitivity. If there are less users than 75% of the maximum,
then the uplink coverage will be better than predicted.
Hand-off Gain CDMA supports soft hand-off, a process by which the mobile communicates simultaneously with more
than one base station or more than one sector of a base station. Soft ha nd-off provides improv ed receive
sensitivity because there are two or more receivers or transmitters involved. A line for hand-off gain is
included in the CDMA link budgets worksheet although the gain is set to 0 dB because the in-building
system will probably be designed to limit soft-handoff.
G
Other CDMA Issues
• Never combine multiple sectors (more than one CDMA signal at the same frequency) into a Unison system. The combined CDMA signals will interfere with
each other.
• Try to minimize overlap between in-building coverage areas that utilize different
sectors, as well as in-building coverage and outd oor coverag e areas. This is important because any area in which more than one dominant pilot signal (at the same
frequency) is measured by the mobile will result in soft-handoff. Soft-handoff
decreases the overall network capacity by allocating multiple channel resources to
a single mobile phone.
PN 8700-10 Help Hot Line (U.S. only): 1-800-530-9960 8-39
620003-0 Rev. A
Page 80

Designing a Unison Solution PRELIMINARY
8.4.4 Spread Spectrum Link Budget Analysis for a Microcell
Application
Spread Spectrum Link Budget Analysis: Downlink
Line Downlink
Transmitter
a. BTS transmit power per traffic channel (dBm) 30.0
b. Voice activity factor 50%
c. Composite power (dBm) 40.0
d. Attenuation between BTS and Unison (dB) –24
e. Power per channel into Unison (dBm) 9.0
f. Composite power into Unison (dBm) 16.0
g. Unison gain (dB) 0.0
h. Antenna gain (dBi) 3.0
i. Radiated power per channel (dBm) 12.0
j. Co mposite radiated power (dBm) 19.0
Airlink
k. Handoff gain (dB) 0.0
l. Multipath fade margin (dB) 6.0
m. Log-normal fade margin with 8 dB std. deviation, edge reliability
90% (dB)
n. Additional loss (dB) 0.0
o. Body loss (dB) 3.0
p. Airlink losses (not including facility path loss) 19.0
Receiver
q. Mobile noise figure (d B) 7.0
r. Thermal noise (dBm/Hz) –174.0
s. Receiver interference density (dBm/Hz) –167.0
t. Information ratio (dB/Hz) 41.6
u. Required Eb/(N
v. Receive Sensitivity (dBm) –118.4
w. Minimum received signal (dBm) –99.4
x. Maximum path loss (d B) –99.4
)7.0
o+lo
10.0
8-40 InterReach Unison User Guide and Reference Manual
PN 8700-10
620003-0 Rev. A
Page 81

PRELIMINARY Spread Spectrum Link Budge t Analysis for a Microcell Applica tion
• b and c: see notes in Table 8-30 regarding power per carrier, downlink
• e = a + d
•f = c + d
• i = e + g + h
• j = f + g + h
• p = –k + l + m + n + o
• s = q + r
• v = s + t + u
• w = p + v
•x = j – w
• y = j (downlink) + m (uplink) + P
where
P = Ptx + Prx = –73 dB for Cellular
–76 dB for PCS
PN 8700-10 Help Hot Line (U.S. only): 1-800-530-9960 8-41
620003-0 Rev. A
Page 82

Designing a Unison Solution PRELIMINARY
Spread Spectrum Link Budget Analysis: Uplink
Line Uplink
Receiver
a. BTS noise figure (dB) 3.0
b. Attenuation between BTS and Unison (dB) –30.0
c. Unison gain (dB) 0.0
d. Unison noise figure (dB) 22.0
e. System noise figure (dB) 33.3
f. Thermal noise (dBm/Hz) –174.0
g. Noise rise 75% loading (dB) 6.0
h. Receiver interference density (dBm/Hz) –134.6
i. Information rate (dB/Hz) 41.6
j. Required Eb/(N
k. Handoff gain (dB) 0.0
l. Antenna gain (dBi) 3.0
m. Minimum received signal (dBm) –91.1
)5.0
o+lo
Airlink
n. Multipath fade margin (dB) 6.0
o. Log-normal fade margin with 8 dB std. deviation, edge reliability
10.0
90% (dB)
p. Additional loss (dB) 0.0
q. Body loss (dB) 3.0
r. Airlink losses (not including facility path loss) 19.0
Transmitter
s. Mobile transmit power (dBm) 28.0
t. Maximum path loss (dB) 100.1
8-42 InterReach Unison User Guide and Reference Manual
PN 8700-10
620003-0 Rev. A
Page 83

PRELIMINARY Spread Spectrum Link Budge t Analysis for a Microcell Applica tion
• e: enter the noise figure and gain of each system compo nent (a, b , c, and d) into
the standard cascaded noise figure formula
F
= F1 + + + ....
sys
where
F = 10
G = 10
(See Rappaport, Theodore S. Wireless Communications, Principles, and Practice. Prentice Hall PTR, 1996.)
F2 – 1
G
(Noise Figure/10)
(Gain/10)
F3 – 1
G
1
1G2
• h = e + f + g
• m = h + i + j –k – l
• r = n + o + p + q
• t = s – r – m
PN 8700-10 Help Hot Line (U.S. only): 1-800-530-9960 8-43
620003-0 Rev. A
Page 84

Designing a Unison Solution PRELIMINARY
8.4.5 Considerations for Re-Radiation (over-the-air) Systems
The Unison can be used to extend th e coverage of the outd oor network by co nnecting
to a roof-top donor antenna that is pointed to ward an out door base station. Add itional
considerations for such an application of the Unison are:
• Sizing the gain and output power requirements for a bi-directional amplifier
(repeater).
• Ensuring that noise radiated on the uplink from the in-building system does not
cause the outdoor base station to become desensitized to wireless handsets in the
outdoor network.
• Filtering out signals that lie in adjacent frequency bands. For instance, if you are
providing coverage for Cellular B-band operation it may be necessary to filter out
the A, A’ and A” bands which may contain strong signals from other outdoor base
stations.
Further information on these issues can be found in LGC Wireless’ application notes
for re-radiation applications.
8-44 InterReach Unison User Guide and Reference Manual
PN 8700-10
620003-0 Rev. A
Page 85

PRELIMINARY Optical Power Budget
8.5 Optical Power Budget
Unison uses SC/APC connectors. The connector losses associated with mating to
these connectors is accounted for in the design and should not be included as elements of the optical power budget. The reason is that when the optical power budget
is defined, measurements are taken with these connectors in place.
The Unison optical power budget for both multimode and single-mode fiber cable is
3.0 dB (optical).
The maximum loss through the fiber can not exceed 3 dB (optical). The maximum
lengths of the fiber cable should not exceed 1.5 km
(19,685 ft) for single-mode. Both the optical budget and the maximum cable length
must be taken into consideration when designing the system.
(4,921 ft) for multimode and 6 km
PN 8700-10 Help Hot Line (U.S. only): 1-800-530-9960 8-45
620003-0 Rev. A
Page 86

Designing a Unison Solution PRELIMINARY
8.6 Connecting a Main Hub to a Base Station
The first consideration when connecting Unison Main Hubs to a base station is to
ensure there is an equal amount of loss through cables, combiners, etc. from the base
station to the Main Hubs. For this example, assume that the base station will have
simplex connections, one uplink and one downlink. Each of these connections will
need to be divided to equilibrate power for each Main Hub. For example, two Main
Hubs will require a 2×1 combiner/divider; four Main Hubs will require a 4×1 combiner/divider; and so on.
Figure 8-2 Connecting Main Hubs to a Simplex Base Station
2 × 1 combiner/divider
Downlink/Forward
Base Station
Uplink/Reverse
When connecting a Unison Main Hub to a base station, also consider the following:
Main Hub 1
Main Hub 2
1. The downlink power from the base station must be attenuated enough so that the
power radiated by the RAU does not exceed the maximum power per carrier listed
in Section 8.1, “Maximum Output Power per Carrier at RAU,” on page 8-3.
2. The uplink attenuatio n should be small enough that the sensitivity of the overall
system is limited by Unison, not by the attenuator. However, some base stations
will trigger alarms if the noise or signal levels are too high. In this case the attenuation will have to be large enough to prevent this from happening.
If, in an area covered by Unison, a mobile phone indicates good signal strength but
consistently has difficulty completing calls, it is possible that the attenuation between
Unison and the base station needs to be adjusted. In other words, it is possible that if
the uplink is over-at tenuated, t he downlink po wer will prov ide good cov erage, but th e
uplink coverage distance will be small.
When there is an excessive amount of loss between the Main Hub uplink and the ba se
station, the uplink system gain can be increased to as much as 15 dB to prevent a
reduction in the overall system sensitivity.
8-46 InterReach Unison User Guide and Reference Manual
PN 8700-10
620003-0 Rev. A
Page 87

PRELIMINARY Attenuation
8.6.1 Attenuation
Figure 8-3 shows a typical setup wherein a duplex base station is connected to a Main
Hub. For a simplex base station, eliminate the circulator and connect the simplex
ports of the base station to the simplex ports of the Main Hub. Add attenuators to regulate the power appropriately.
Figure 8-3 Main Hub to Duplex Base Station or Repeater Connections
A1
Duplex
Base Station
or
Repeater
• A typical circulator has an IP3 of +70dBm. If you drive the circulator too hard it will produce
intermods that are bigger than the intermods produced by Unison. The IP3 at the Forward
port input of the Main Hub is approximately +38 dBm. The IP3 of the circulator at that same
point (i.e., following attenuator A1) is +70dBm – A1. Thus, to keep the system IP3 from
being adversely affected by the circulator, attenuator A1 should be no more than approximately +30 dB.
• A filter diplexer can be used in place of the circulator. The IP3 of the diplexer can be
assumed to be greater than +100 dBm. If a diplexer is used, A3 can be omitted.
• A1+A3 should be chosen so that the output power per carrier at the RAU’s output is correct
for the number of carriers being transmitted. Suppose the base station transmits 36 dBm
per carrier and it is desired that the RAU output be 6 dBm per carrier and the forward port
gain is 0 dB. Then A1+A3=30 dB.
• A2+A3 should, ideally, be at least 10 dB less than the noise figure plus the gain of the Uni-
son system. For example, if the reverse port has a 0 dB gain and if there are 32 RAUs, the
noise figure is approximately 22 dB. So A2+A3 should be about 10 dB. If A2+A3 is too
large, the uplink coverage can be severely reduced.
• Given these three equations:
we could choose A1=20 dB, A2=0 d B, A3=10 dB
A3
A2
A1 < 30 dB
A1+A3 = 30 dB (in this example)
A2+A3 < 10 dB (in this example)
Forward
Main Hub
Reverse
PN 8700-10 Help Hot Line (U.S. only): 1-800-530-9960 8-47
620003-0 Rev. A
Page 88

Designing a Unison Solution PRELIMINARY
8.6.2 Uplink Attenuation
The attenuation between the Main Hub’s reverse port and the base station does two
things:
1. It attenuates the noise coming out of Unison.
2. It attenuates the desired signals coming out of Unison.
Setting the attenuation on the uplink is a trade-off between keeping the noise and
maximum signal levels transmitted from Unison to the base station receiver low
while not reducing the SNR (signal-to-noise ratio) of the path from the RAU inputs to
the base station inputs. This SNR can not be better than the SNR of Unison by itself,
although it can be significantly worse.
For example, suppose we have a GSM Unison system consisting of one Main Hub,
four Expansion Hubs, and 3 2 RAUs (1 -4-32) wi th upl ink NF=2 2 dB. (See Table 8-30
on page 8-38.) If we use 30 dB of attenuation between the Main Hub’s reverse port
and the base station (which has its own noise figure of about 4 dB), the overall noise
figure will be 34.3 dB (refer to the formula on page 8-36) which is 12.3 dB worse
than Unison by itself. That causes a 12.3 dB reduction in the uplink coverage distance. Now, if the attenuation instead is 10 dB, the cascaded noise figure is
NF=22.6 d B, which implies that the uplink sensitivity is limited by Unison, a desirable condition.
Rule of Thumb
A good rule of thumb is to set the uplink attenuation, A2+A3 in Figure 8-3 on
page 8-47, as follows:
A2+A3 ≈ Uni son upli nk NF + upl ink gai n ( 0 dB for reverse port) – BTS NF – 10dB
and round A2 down to the nearest convenient attenuation value.
8-48 InterReach Unison User Guide and Reference Manual
PN 8700-10
620003-0 Rev. A
Page 89

PRELIMINARY Uplink Attenuation
8.6.2.1 Uplink Attenuation Exception: CDMA
In CDMA systems, the power transmitted by the mobile is determined by the characteristics of both the uplink and downlink paths. The power transmitted by the mobile
should be similar in open-loop control (as determined by the downlink path) as during closed-loop control (as determined by the uplink and downlink paths). In addition, the mobile’s transmit power when it communicates with a base station through
Unison should be similar to the power transmitted when it communicates with a base
station in the outdoor network (during soft hand-off). Because of these considerations, you should not allow the downlink and uplink gains to vary widely.
Open-loop power control:
P
= –76 dBm (for PCS) – P
TX
where PTX is the power transmitted and PRX is the power received by the mobile. If
PL is the path loss (in dB) between the RAU and the mobile, and P
power radiated by the RAU, then
P
= –76 dBm (for PCS) – PDN + PL
TX
Closed-loop power control:
RX
is the downlink
DN
P
= noise floor + uplink NF – process gain + Eb/No + PL
TX
= –113 dBm/1.25 Mhz + NF – 19 dB + 7 dB + PL
where Eb/No = 7 dB is a rough estimate, and NF is the cascaded noise figure of the
Unison uplink, the uplink atte nuation, and the base station no ise figure. Eq uating P
TX
for the open-loop and closed-loop we see that
NF = 49 – P
DN
where PDN is determined by the downlink attenuation. Since PDN for Unison is about
10 dBm, we see that the cascaded noise figure is about 39 dB, which is considerably
higher than that of Unison itself. This implies that we should use a fairly large attenuation on the uplink. This case suggests using as much attenuation on the downlink as
on the uplink. The drawback of doing this is that the uplink coverage sensitivity is
reduced. A link budget analysis will clarify these issues. Typically, the uplink attenuation between the Main Hub and the base station will be the same as, or maybe 10 dB
less than, the downlink attenuation.
PN 8700-10 Help Hot Line (U.S. only): 1-800-530-9960 8-49
620003-0 Rev. A
Page 90

Designing a Unison Solution PRELIMINARY
8.7 Designing for a Neutral Host System
Designing for a neutral host system uses the same design rules previously discussed.
Since a neutral host system typically uses multiple syst e m s in parallel, we find it best
to design for the worst case system so that there will not be holes in the covered area
and the economies of a single installation can be achieved. For example, as indicated
Section 7.1, the 1900 MHz RF signa ls do not prop agate thro ughout a buil ding as wel l
as the 800 MHz systems, therefore, we design to the 1900 MHz path loss formula.
8.7.1 Capacity of the Unison Neutral Host System
Each Main Hub can support more than one sub-band of the Cellular or PCS bands.
The exception to this is the iDEN Main Hub, because the SMR band is not split into
sub-bands.
The 800 MHz Main Hub can support bot h the A band and th e B band s imult ane ously.
Also, the 1800 MHz and 1900 MHz Main Hubs can support two bands each (as the
frequencies currently are allocated).
For example, a neutral host system that consists of one iDEN, one 800 MHz, and two
1900 MHz systems can support up to seven separate service providers:
•1 on iDEN
• 2 on 800 MHz, A band and B band
• 2 in each 1900 MHz
8-50 InterReach Unison User Guide and Reference Manual
PN 8700-10
620003-0 Rev. A
Page 91

PRELIMINARY Example Unison Neutral Host System
8.7.2 Example Unison Neutral Host System
The following example configuration assumes:
• 3 dBm per carrier output
• Each System supports two bands, and therefore, two Operators
(Exception: iDEN supports one Operator)
Example Configuration:
• 800 MHz iDEN: 16 channels
• 800 MHz Ce llular
TDMA Band: 16 channels
CDMA Band: 3 channels
• 1900 MHz PCS
TDMA Band: 16 channels
CDMA Band: 3 channels
GSM Band: 6 channels
PN 8700-10 Help Hot Line (U.S. only): 1-800-530-9960 8-51
620003-0 Rev. A
Page 92

Designing a Unison Solution PRELIMINARY
8-52 InterReach Unison User Guide and Reference Manual
PN 8700-10
620003-0 Rev. A
Page 93

PRELIMINARY
SECTION 9
Replacing Unison Component s
in an Operating System
9.1 Replacing an RAU
Be aware that the new RAU must be the same band as the one you are replacing. If
you replace an RAU with one that is of the wrong band, it will not work.
The Main Hub automatically checks the band of a replaced RAU. There is no need to
issue commands directly from the Main Hub. Therefo re, as lon g as the RA U is of the
correct band, the system will operate properly.
Replacing an RAU
1. Use AdminManager or refer to the As-Built Document to review the current
RAU’s configuration.
2. Disconnect the Cat-5/6 cable and antenna from the unit to be replaced.
3. Install the new RAU.
4. Connect the antenna and then the Cat-5/6 cable to the new RAU
AdminManager Tasks
• Use the Advanced RAU Settings option on the Configuration & Maintenance
panel to set the RAU’s 10 dB attenuation and UL ALC settings.
• When convenient, perform System Test to optimize performance.
During System Test, the entire system is temporarily off-line and no RF is
being transmitted. For a fully loaded system (one Main Hub, four Expansion
Hubs, and 32 RAUs), it can take 1.5 minutes to complete the test.
PN 8700-10 InterReach Unison User Guide and Reference Manual 9-1
620003-0 Rev. A
Page 94

Replacing Unison Components in an Operating System PRELIMINARY
Checking the RAU’s LEDs
1. The RAU’s LINK and ALARM LEDs should blink (green/red) on power up.
• If the LEDs do not blink on power up, replace the RAU.
2. After several seconds both LEDs should change to green, wh ich in dicates that the
unit has been successfully replaced, there is communication with the Expansion
Hub, and the RAU band is correct.
a. If the LINK LED remains green and the ALARM LED remains red, verify that
the RAU model is correct for the intended frequency band.
– Disconnect the cable and then reconnect it once; doing this more than once
will not change the result.
b. If both LEDs still don’t change to green, use the AdminManager to determ ine
the exact nature of the fault and see a recommendation of how to correct it.
c. If both LEDs turn red (after 45 seconds), the Expansion Hub has terminated
communications.
9-2 InterReach Unison User Guide and Reference Manual
PN 8700-10
620003-0 Rev. A
Page 95

PRELIMINARY Replacing an Expansion Hub
9.2 Replacing an Expansion Hub
Replacing an Expansion Hub
1. Turn off the power to the Expansion Hub.
2. Disconnect all Cat-5/6 cables, both fiber cables, and the AC power cord.
3. Replace the Expansion Hub with a new one.
4. Connect the AC power cord, all Cat-5/6 cables, and both fiber cables – remember-
ing to clean and correctly connect the uplink and downlink fiber.
5. Turn on the power to the Expansion Hub.
AdminManager Tasks
• The Main Hub automatically issues the band setting.
• When convenient, perform System Test to optimize performance.
During System Test, the entire system is temporarily off-line and no RF is
being transmitted. For a fully loaded system (one Main Hub, four Expansion
Hubs, and 32 RAUs), it can take 1.5 minutes to complete the test.
Checking the Expansion Hub’s LEDs
• The LEDs should blink through all states on power up.
• If the LEDs do not blink on power up, replace the Expansion Hub.
• If the LEDs do not illuminate at all, make sure the AC power cable is connected.
•The
UL STATUS and DL STATUS LEDs should be green.
•The
E-HUB STATUS and POWER LEDs should be green.
• For each RJ-45 port that has an RAU connected:
•The
E-HUB/RAU LEDs should be green.
•The
LINK LEDs should be green.
It can take several seconds for each Cat-5/6 connection for the LEDs to display
properly.
NOTE: Refer to Section 10 for troubleshooting using the LEDs.
PN 8700-10 Help Hot Line (U.S. only): 1-800-530-9960 9-3
620003-0 Rev. A
Page 96

Replacing Unison Components in an Operating System PRELIMINARY
9.3 Replacing a Main Hub
Yo u must record the system configuration settings from the old Main Hub’s memory
before replacing the unit. You will program the new Main Hub with this information.
If the Main Hub is programmed incorrectly, the system will not work. If the Main
Hub is not functioning, get the configuration settings from the As-Built Document
that was created as part of the original installation.
Get System Configuration Settings
1. Connect th e null m odem cable to th e PC and the Main Hub.
2. Start the AdminManager software.
3. Select th e Configuratio n & Maintenance Panel option from the introductory win-
dow.
4. Click the SAVE CONFIG button.
The Save Configuration Notes dialog box is displayed.
5. Type any notes you want to save with the configuration settings into the dialog
box and click
The configuration settings are saved in a text file, for example:
OK.
Begin Notes *******************************************
LGC HQ
05/23/01 MH configuration L010MH11
System configuration
End Notes *********************************************
Frequency Band is DCS Low.
SystemGain:UL=12dB,DL=4dB.
Callback Number is 1234567.
System label is LGC.
Main Hub Information:
Serial Number: L010BMH1
Part Number: 7405101
Revision Number: 03
Firmware Revision: 010526
Expansion Hub LGC-1 Information:
Serial Number: L010BEH9
Part Number: 7405101
Revision Number: 03
Firmware Revision: 010513
RAU LGC-1-5 Information:
Serial Number: L010BRU1
Part Number: 7405101
Revision Number: 03
Firmware Revision: 010021
9-4 InterReach Unison User Guide and Reference Manual
PN 8700-10
620003-0 Rev. A
Page 97

PRELIMINARY Replacing a Main Hub
Replacing a Main Hub
1. Turn off the power to the Main Hub.
2. Disconnect all fiber cables and the AC power cord.
3. Replace the Main Hub with a new one.
4. Connect the AC power cord and all fiber cables – remembering to clean and cor-
rectly connect the uplink and downlink fiber cables.
5. Connect the null modem cable to the PC and then to the Main Hub’s front panel
DB-9 serial connector.
6. Start the AdminManager software.
7. Select the Installation Wizard option from the introductory window.
8. Turn on the power to the Main Hub.
AdminManager Tasks
• Use the Installation Wizard to:
• Set the Operation Band
• Use the Configuration & Maintenance panel to:
• Set Callback Number
• Set Contact Sense Properties
• Set System Parameters
• Perform System Test
During System Test, the entire system is temporarily off-line and no RF is
being transmitted. For a fully loaded system (one Main Hub, four Expansion
Hubs, and 32 RAUs), it can take 1.5 minutes to complete the test.
PN 8700-10 Help Hot Line (U.S. only): 1-800-530-9960 9-5
620003-0 Rev. A
Page 98

Replacing Unison Components in an Operating System PRELIMINARY
Checking the Main Hub’s LEDs
• The LEDs should blink through all states on power up.
• If the LEDs do not blink on power up, replace the Main Hub.
• If the LEDs do not illuminate at all, make sure the AC power cable is connected.
• For each fiber optic port that has a Main Hub connected:
•The
LINK LED should be green.
•The
E-HUB/RAU LED should be:
– Green if the
– Red if the
•The
MAIN HUB STATUS LED should be:
MAIN HUB STATUS is green.
MAIN HUB STATUS is red.
• Red if the Main Hub is new from the factory and a band has not been programmed, or if the wrong band is programmed.
• Green if the Main Hub was previously programmed with a correct band
(matches the RAUs in the system).
NOTE: If there is communication between the Main Hub and the Expansion Hubs,
use the AdminManager software’ s Conf iguration & Maintenance p anel to isolate system problems.
9-6 InterReach Unison User Guide and Reference Manual
PN 8700-10
620003-0 Rev. A
Page 99

PRELIMINARY
SECTION 10
Maintenance, T roubleshooting,
and Technical Assist ance
There are no user-serviceable parts in any of the Unison compon ents. Faulty or failed
components are fully replaceable through LGC Wireless.
Address 2540 Junction Avenue
San Jose, California
95134-1902 USA
Phone 1-408-952-2400
Fax 1-408-952-2410
Help Hot Line 1-800-530-9960 (U.S. only)
Web Address http:// www.lgcwireless.com
e-mail service@lgcwireless.com
10.1 Maintenance
No periodic maintenance of the Unison equipment is required.
+1-408-952-2400 (International)
+44(0) 1223 597812 (Europe)
PN 8700-10 InterReach Unison User Guide and Reference Manual 10-1
620003-0 Rev. A
Page 100

Maintenance, Troubleshooting, and Technical Assistance PRELIMINARY
10.2 Troubleshooting
NOTE: Unison has no user-serviceable parts. Faulty or failed units are fully
replaceable through LGC Wireless.
Sources of potential problems include:
• Malfunction of one or more Unison components
• Faulty cabling/connector
• Antenna, base station, or repeater problem
• External RF interface
NOTE: Faulty cabling is the cause of a vast majority of problems. All
Cat-5/6 cable should be tested to TIA/EIA 568-A specifications.
It is recommended that you use the AdminManager for troubleshooting the system,
and use the LEDs as backup or for confirmation. However, if there are communication problems within the system, the LEDs may provide additional information that is
not available using AdminManager.
To begin troubleshooting, use the AdminManager software to determine the current
faults and warnings for all of the units in the system. To troubleshoot, start with the
Main Hub’s faults and warnings, then proceed to each of the Expansion Hubs, finishing with each of the RAUs.
If you do not have a PC with AdminManager available, the LEDs provide a minimal
set of diagnostic information.
If you cannot determine the cause of a problem after following the recommended procedures, call LGC Wireless customer help hot line:
1-800-530-9960 (U.S. only)
+1-408-952-2400 (International)
+44(0) 1223 597812 (Europe)
10-2 InterReach Unison User Guide and Reference Manual
PN 8700-10
620003-0 Rev. A
 Loading...