

Page 1
CLUE Sensor Plotter in CircuitPython
Created by Kevin Walters
Last updated on 2021-02-08 06:58:19 PM EST
Page 2

2
4
4
6
7
7
9
9
11
11
12
14
14
16
17
17
19
19
19
19
20
20
20
20
25
31
45
45
47
47
49
52
52
53
53
53
53
54
54
56
56
57
58
58
59
59
62
63
63
65
66
Guide Contents
Guide Contents
Overview
Parts
Design
Main Program
User Interface with Two Buttons
PlotSource Class
Data Sources for Plotting
Plotter Class
Accessibility
Auto-scaling Algorithm
Efficient Use of displayio
Scrolling
Resolution and Scaling
CircuitPython on CLUE
Set up CircuitPython Quick Start!
CircuitPython
Libraries
Libraries for Sensor Plotter
Development Testing
Sensor Plotter
Example Video
Code
code.py
plot_source.py
plotter.py
Code Discussion
IlluminatedColorPlotSource class
Units and Interfaces
Setting Properties and Pass by ...
Signal/Colour Generator
Sensors
Temperature
Pressure
Humidity
Volume
Colour Sensitivity
Proximity
Magnetometer
Testing
TemperaturePlotSource class
Code Review
Unit Testing
Mocking
Bug 1
Finding the Bug
Fixing the Bug
Bug 2
More Than One Bug
Number Representation
Python 3
© Adafruit Industries https://learn.adafruit.com/clue-sensor-plotter-circuitpython Page 2 of 77
Page 3

66
66
67
67
67
67
69
69
69
69
71
71
72
72
73
74
74
74
74
CircuitPython
Small Boards
Large Boards
C/Arduino
Zuse Z1
Decimal Precision
Time in CircuitPython
CircuitPython time functions
time.monotonic()
time.monotonic_ns()
Making Large Numbers Readable
Performance Variability
Demonstration of time.monotonic() Granularity
Ten Minutes
Two Days
Going Further
Ideas for Areas to Explore
Related Projects
Further Reading
© Adafruit Industries https://learn.adafruit.com/clue-sensor-plotter-circuitpython Page 3 of 77
Page 4
Overview
This project demonstrates plotting the CLUE's wide variety of onboard sensors (https://adafru.it/K7b) and
the analogue input pads (https://adafru.it/K7b) in CircuitPython 5 and above using the displayio
library (https://adafru.it/EGh).
A similar plotting program in C/Arduino from the Adafruit examples is shown alongside the CircuitPython
one.
Note: the Design (https://adafru.it/Kbj), Testing (https://adafru.it/Kbk) and Number
Representation (https://adafru.it/Kbl) sections are rather detailed and primarily intended for students.
Parts
Your browser does not support the video tag.
Adafruit CLUE - nRF52840 Express with Bluetooth LE
Do you feel like you just don't have a CLUE? Well, we can help with that - get a CLUE here at Adafruit by
picking up this sensor-packed development board. We wanted to build some...
$39.95
In Stock
Add to Cart
© Adafruit Industries https://learn.adafruit.com/clue-sensor-plotter-circuitpython Page 4 of 77
Page 5
USB cable - USB A to Micro-B
This here is your standard A to micro-B USB cable, for USB 1.1 or 2.0. Perfect for connecting a PC to your
Metro, Feather, Raspberry Pi or other dev-board or...
$2.95
In Stock
Add to Cart
© Adafruit Industries https://learn.adafruit.com/clue-sensor-plotter-circuitpython Page 5 of 77
Page 6
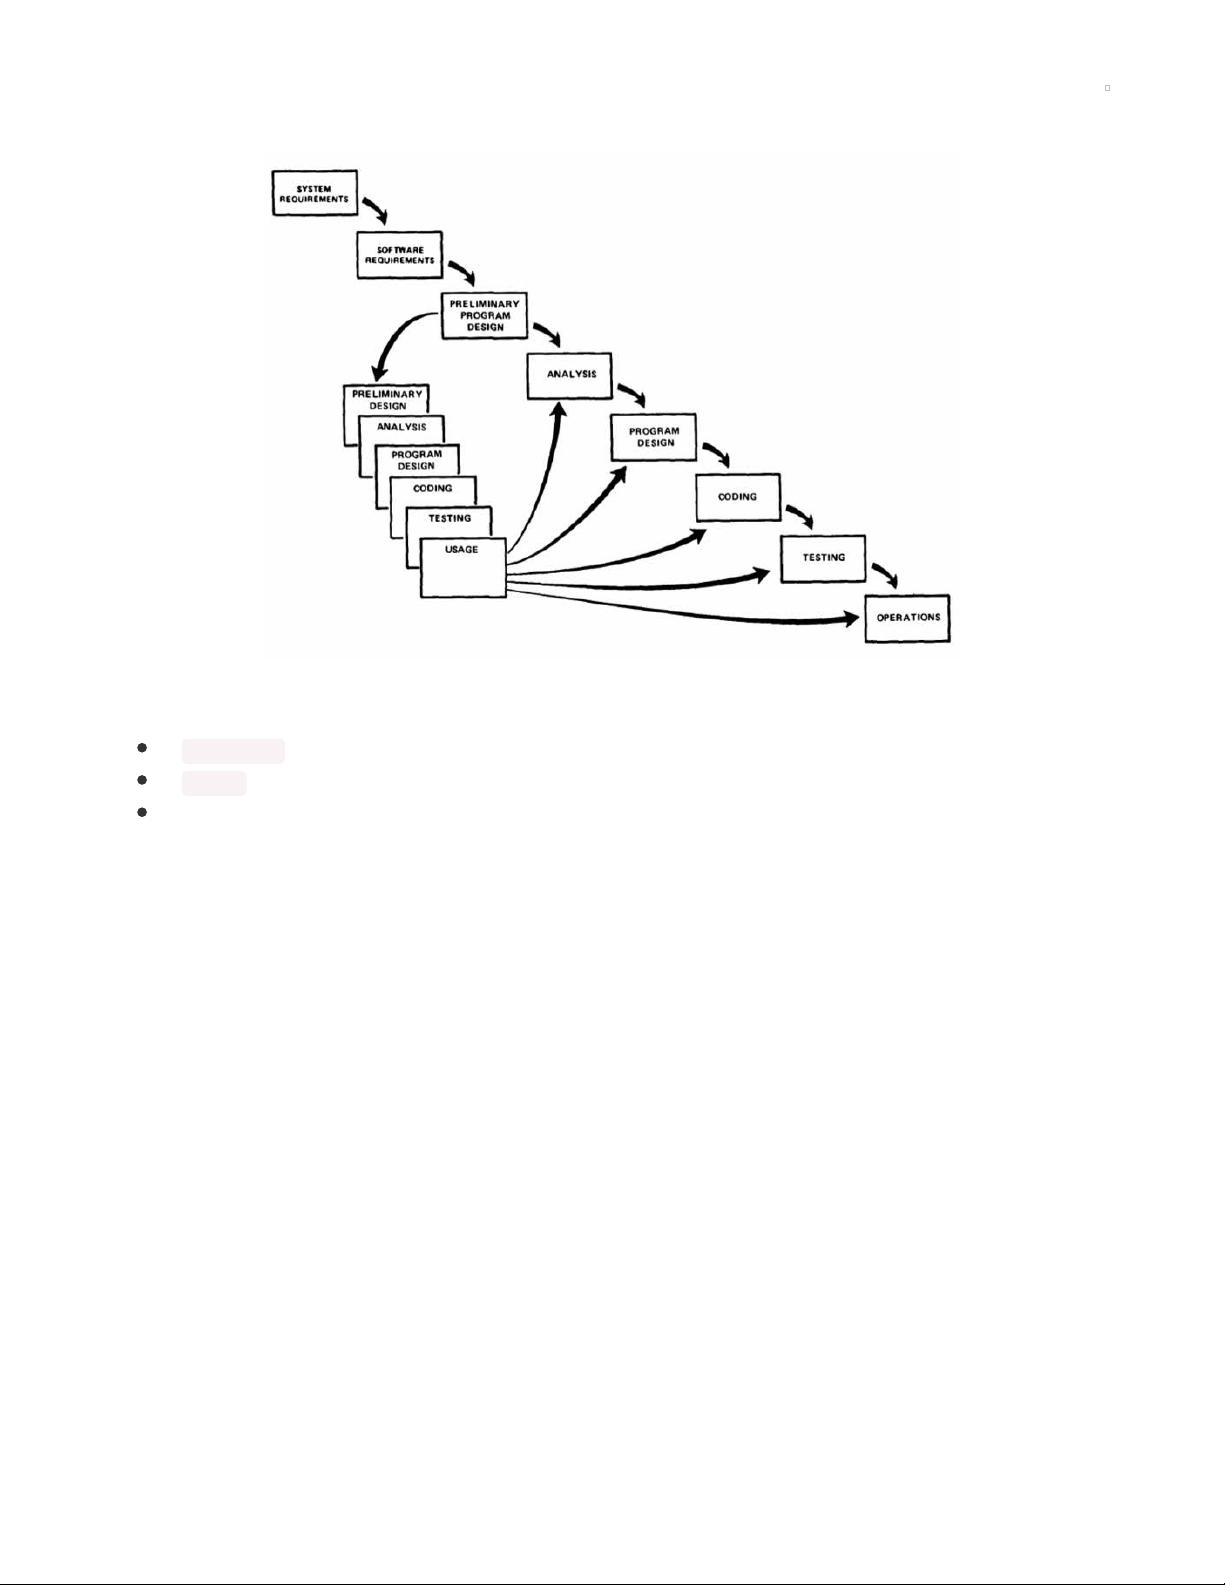
Design
The design of the CircuitPython version of the CLUE sensor plotter separates the program into three
components using object-oriented programming (OOP) (https://adafru.it/K7f):
A PlotSource class with derived classes for each sensor to represent the 10 data sources.
A Plotter class to take the data and draw the graph on the LCD screen.
The main program which manages the interactions with the user and uses the aforementioned
classes to read the data from the sensors and plot it to the screen.
A class (https://adafru.it/K7A) brings together related code and data to create a new
type (https://adafru.it/K7B). Variables created based on the class type are referred to as
objects (https://adafru.it/K7C). Procedures are called methods (https://adafru.it/IkD) when they are part of a
class. Python and C++, the basis for CircuitPython and Arduino programming respectively, both have OO
features.
The following pages in this section look at a few aspects of the design.
© Adafruit Industries https://learn.adafruit.com/clue-sensor-plotter-circuitpython Page 6 of 77
Page 7

Main Program
The flow diagram above shows a simplified view of the main program. There are multiple Sources
representing the different sensors and the pads and one Plotter object. One omitted action is the
invocation of the start() and stop() methods on the source when the source is first used or changed.
The flow diagram is unusual in not having a Stop symbol. In this case the program has an intentional
infinite loop (https://adafru.it/K7D) and runs perpetually. Turning the power off is the only way to terminate
the program. This is fairly common for embedded systems (https://adafru.it/K7E). Regulatory
changes (https://adafru.it/K7F) have affected some designs in the last decade initiating and improving
power saving when idle.
The diagram doesn't show the detail of exactly how the button inputs are processed. This is described in
detail in the next section.
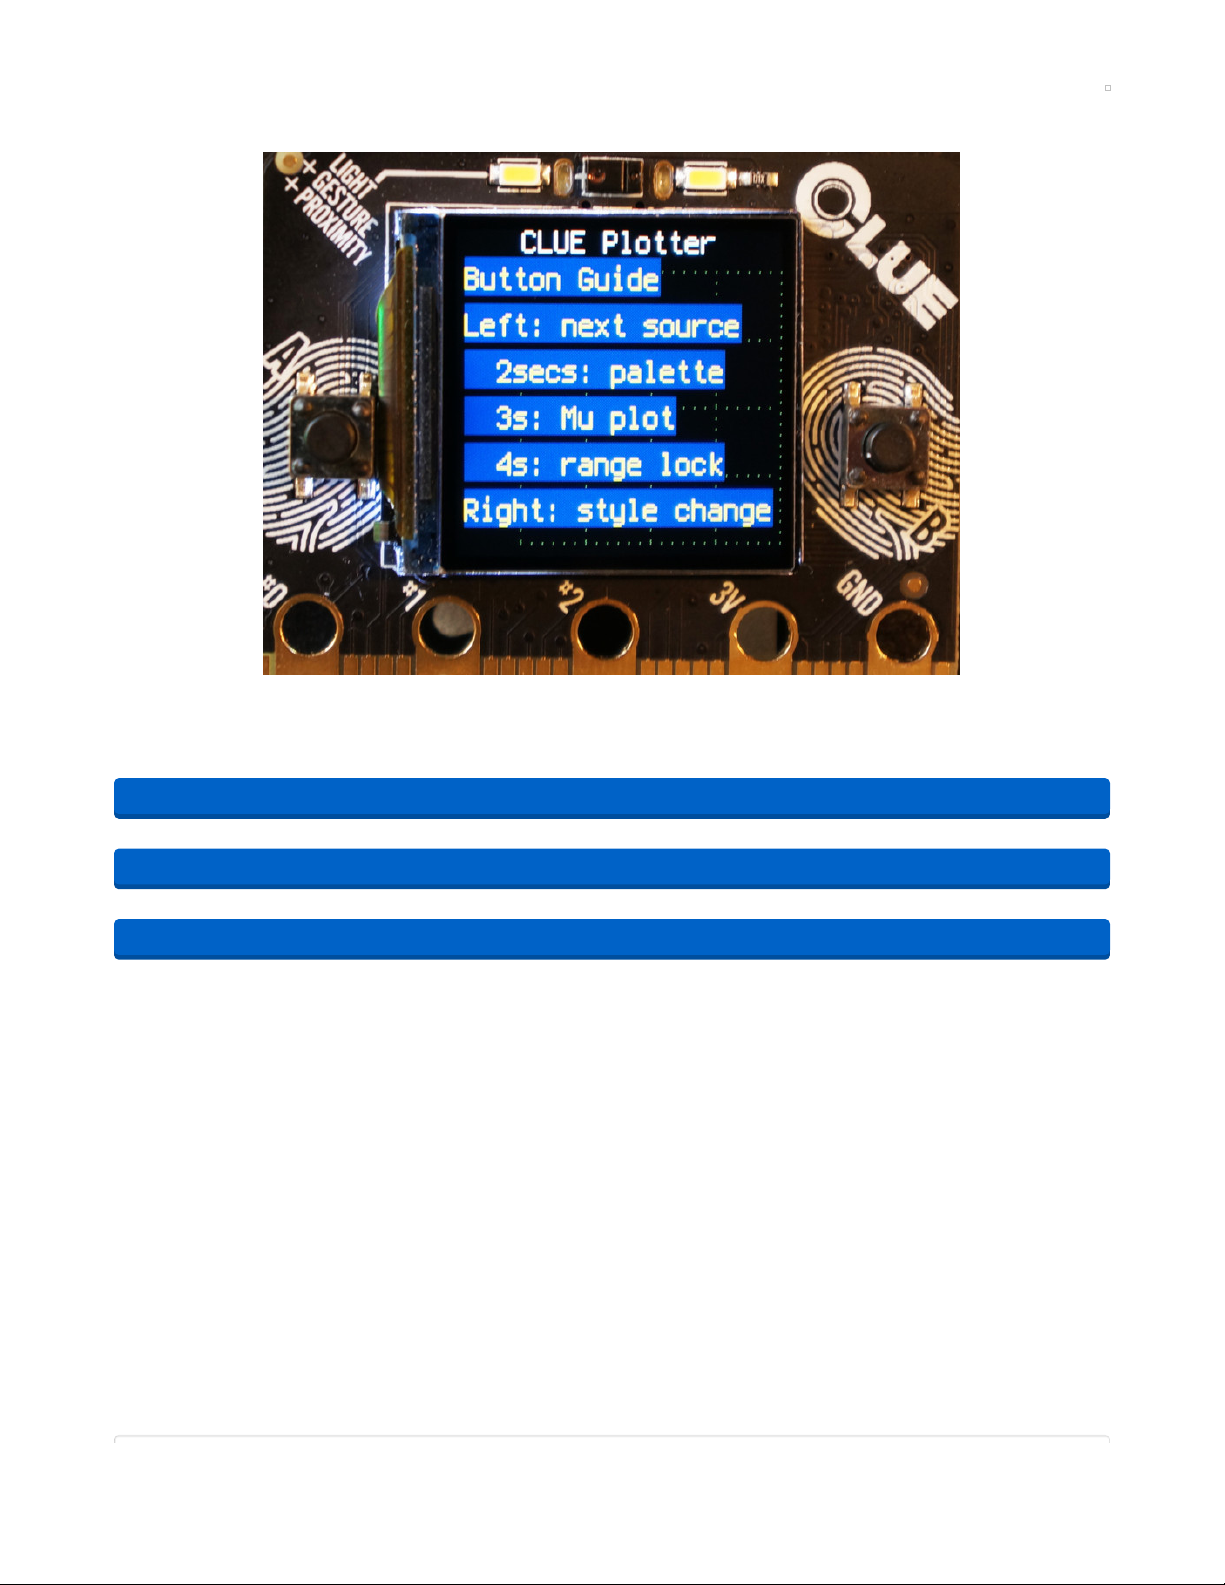
User Interface with Two Buttons
The CLUE follows the design of the BBC micro:bit and only has two buttons for user input. The three large
pads on the edge connector can be used as touch pads (https://adafru.it/K7b) but in this program they are
used as analogue inputs which prevents touch pad use, at least when the analogue inputs are being
plotted.
Any button can be used for more than just simple clicks. The action can be varied based on waiting for a
double-click or measuring the duration of the press. The latter approach is used with the following actions:
Left (A) button:
0-2 seconds: change to the next plotting source.
2-4s: toggle between palette from the PlotSource and a default palette.
4-6s: toggle data output on/off to serial console in a format suitable for plotting in
Mu (https://adafru.it/ANO).
© Adafruit Industries https://learn.adafruit.com/clue-sensor-plotter-circuitpython Page 7 of 77
Page 8
>6s: toggle range lock on the y axis scale to inhibit auto-scaling.
Right (B) button: change to a different plot style/mode.
Another option, not used here, would be for the two buttons to have a different action when both are
pressed at the same time.
The first design timed the button press duration and then displayed the action on screen to the user. This
meant the user had to mentally time the presses and could select the wrong option. A simple redesign
changed this to cycle through the actions on screen as time passes. This allows the user to release the
button reliably on the desired option.
© Adafruit Industries https://learn.adafruit.com/clue-sensor-plotter-circuitpython Page 8 of 77
Page 9
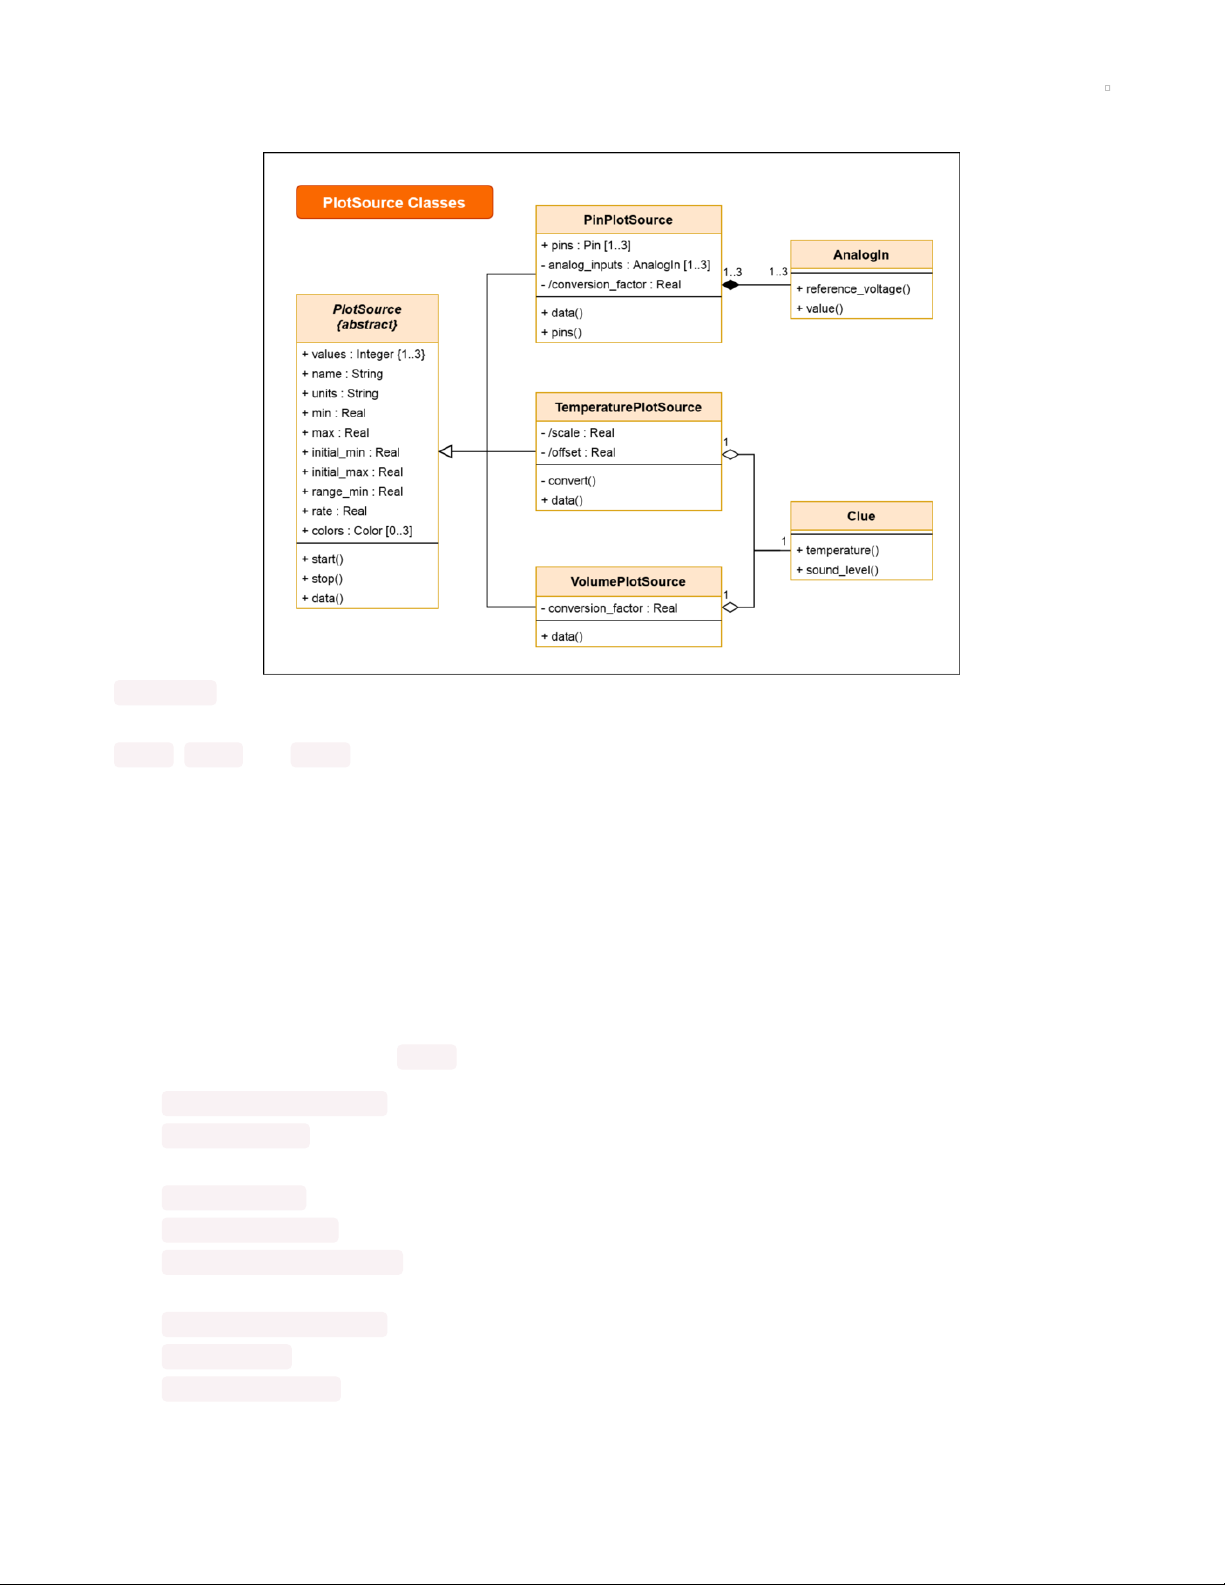
PlotSource Class
PlotSource is an abstract class (https://adafru.it/K8a). This means that it is not intended for direct use but
exists as a parent for sub-classes. It is also defining the interface (https://adafru.it/K8b) for children with the
start() , stop() and data() operations (https://adafru.it/K8c) (a UML term encompassing methods).
Data Sources for Plotting
The CLUE board has many sensors and inputs which can be used as data sources for plotting. The data
output from all of these sensors and analogue input(s) are ultimately represented by either one number or
a list of numbers per sample read. This commonality suggests they can be represented by a single class
providing the interface to the rest of the program. The per-sensor code can be implemented in a sub-class
derived from a base class using inheritance (https://adafru.it/K8d). UML (https://adafru.it/K8e) diagrams
depict inheritance with an unfilled, triangular arrow head.
The sub-classes are listed below with their name together with with any processing performed, the
number of values returned by data() and the units for values:
1. AccelerometerPlotSource - none - 3 values - ms .
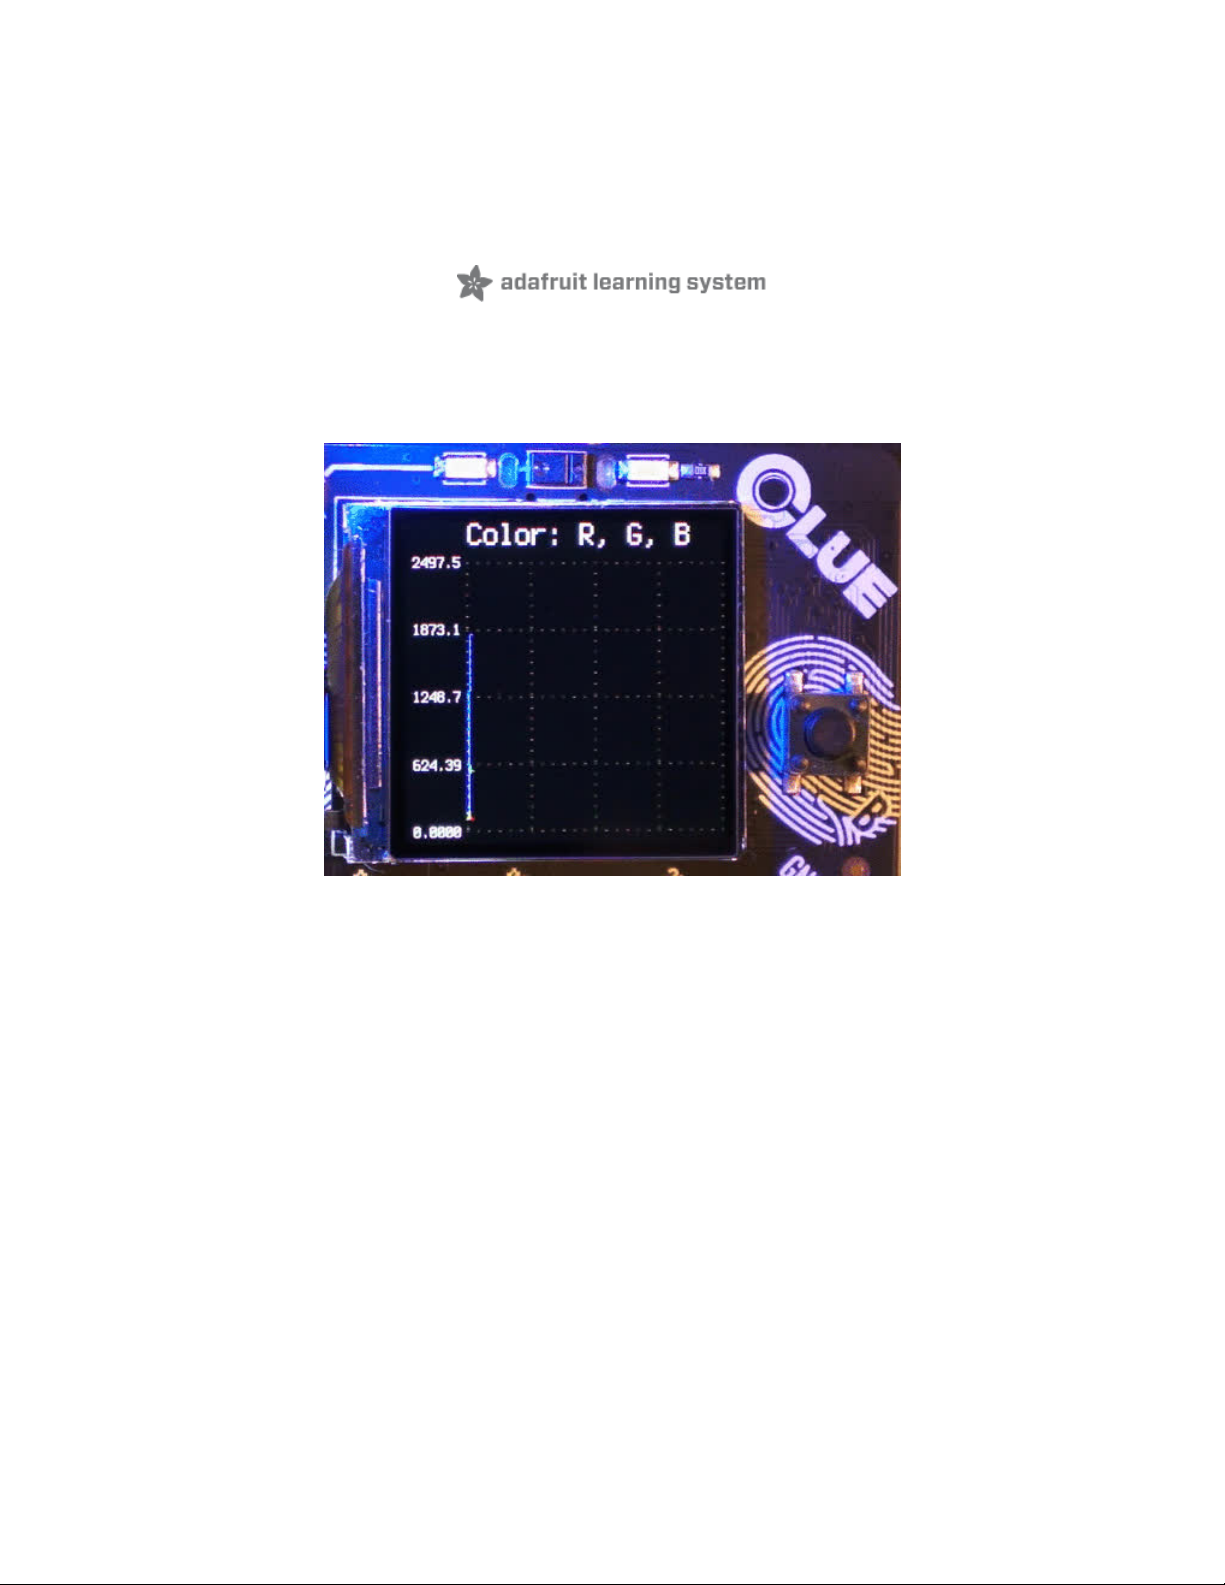
2. ColorPlotSource - discard data from clear sensor leaving red, green and blue values - 3 values integer.
3. GyroPlotSource - none - 3 values - degrees per second (dps).
4. HumidityPlotSource - none - 1 value - percentage.
5. IlluminatedColorPlotSource - only pass a single value from sensor selected at instantiation - 1 value integer.
6. MagnetometerPlotSource - none - 3 values - uT.
7. PinPlotSource - converted to voltage - 1 value per pin, maximum of 3 - V.
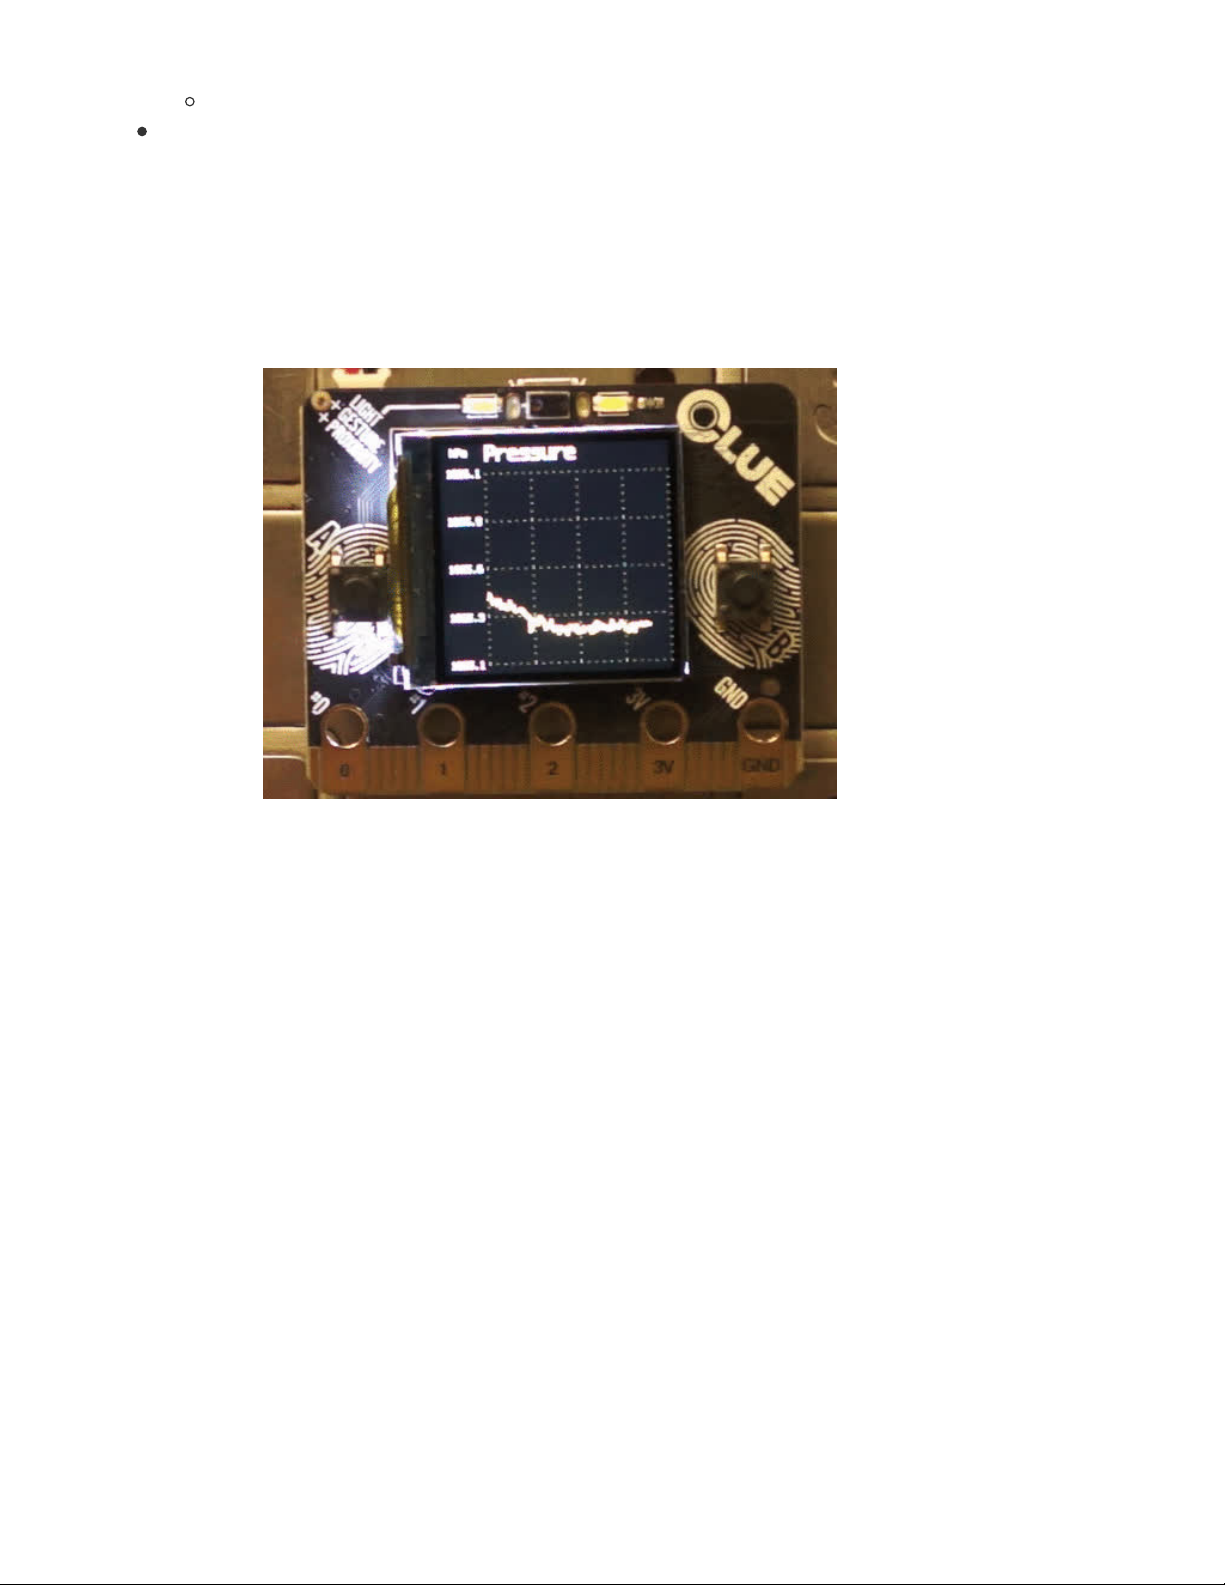
8. PressurePlotSource - optionally converted to inches of mercury (https://adafru.it/K8f) - 1 value - hPa or
inHg.
-2
© Adafruit Industries https://learn.adafruit.com/clue-sensor-plotter-circuitpython Page 9 of 77
Page 10

9. ProximityPlotSource - none - 1 value - integer.
10. TemperaturePlotSource - optionally converted to Fahrenheit - 1 value - degrees Celsius or Fahrenheit.
11. VolumePlotSource - conversion to decibel (https://adafru.it/K8A) scale - 1 value - dB.
The colour sensor here is actually represented by
two
classes. There are different ways to design the
illuminated vs the non-illuminated colour plot source.
1. The variation in behaviour can be achieved with conditional logic inside a
single
class. The selection
of the desired behaviour can be achieved in many ways:
1. creation of two objects with the variety passed as a parameter as the object is constructed;
2. a single object with additional methods extending the interface;
3. a single object with an optional parameter to the existing data() method.
2. Increased use of inheritance with two or three classes, e.g. IlluminatedColorPlotSource could be
derived from ColorPlotSource and optionally a NonIlluminatedColorPlotSource could be created.
3. Two classes derived from PlotSource .
The final option was the one chosen with the IlluminatedColorPlotSource using the start() and stop()
methods to turn on the CLUE's pair of bright, white, forward-facing LEDs for the duration of the illuminated
plotting. The sensor's gain is also set a little higher.
© Adafruit Industries https://learn.adafruit.com/clue-sensor-plotter-circuitpython Page 10 of 77
Page 11
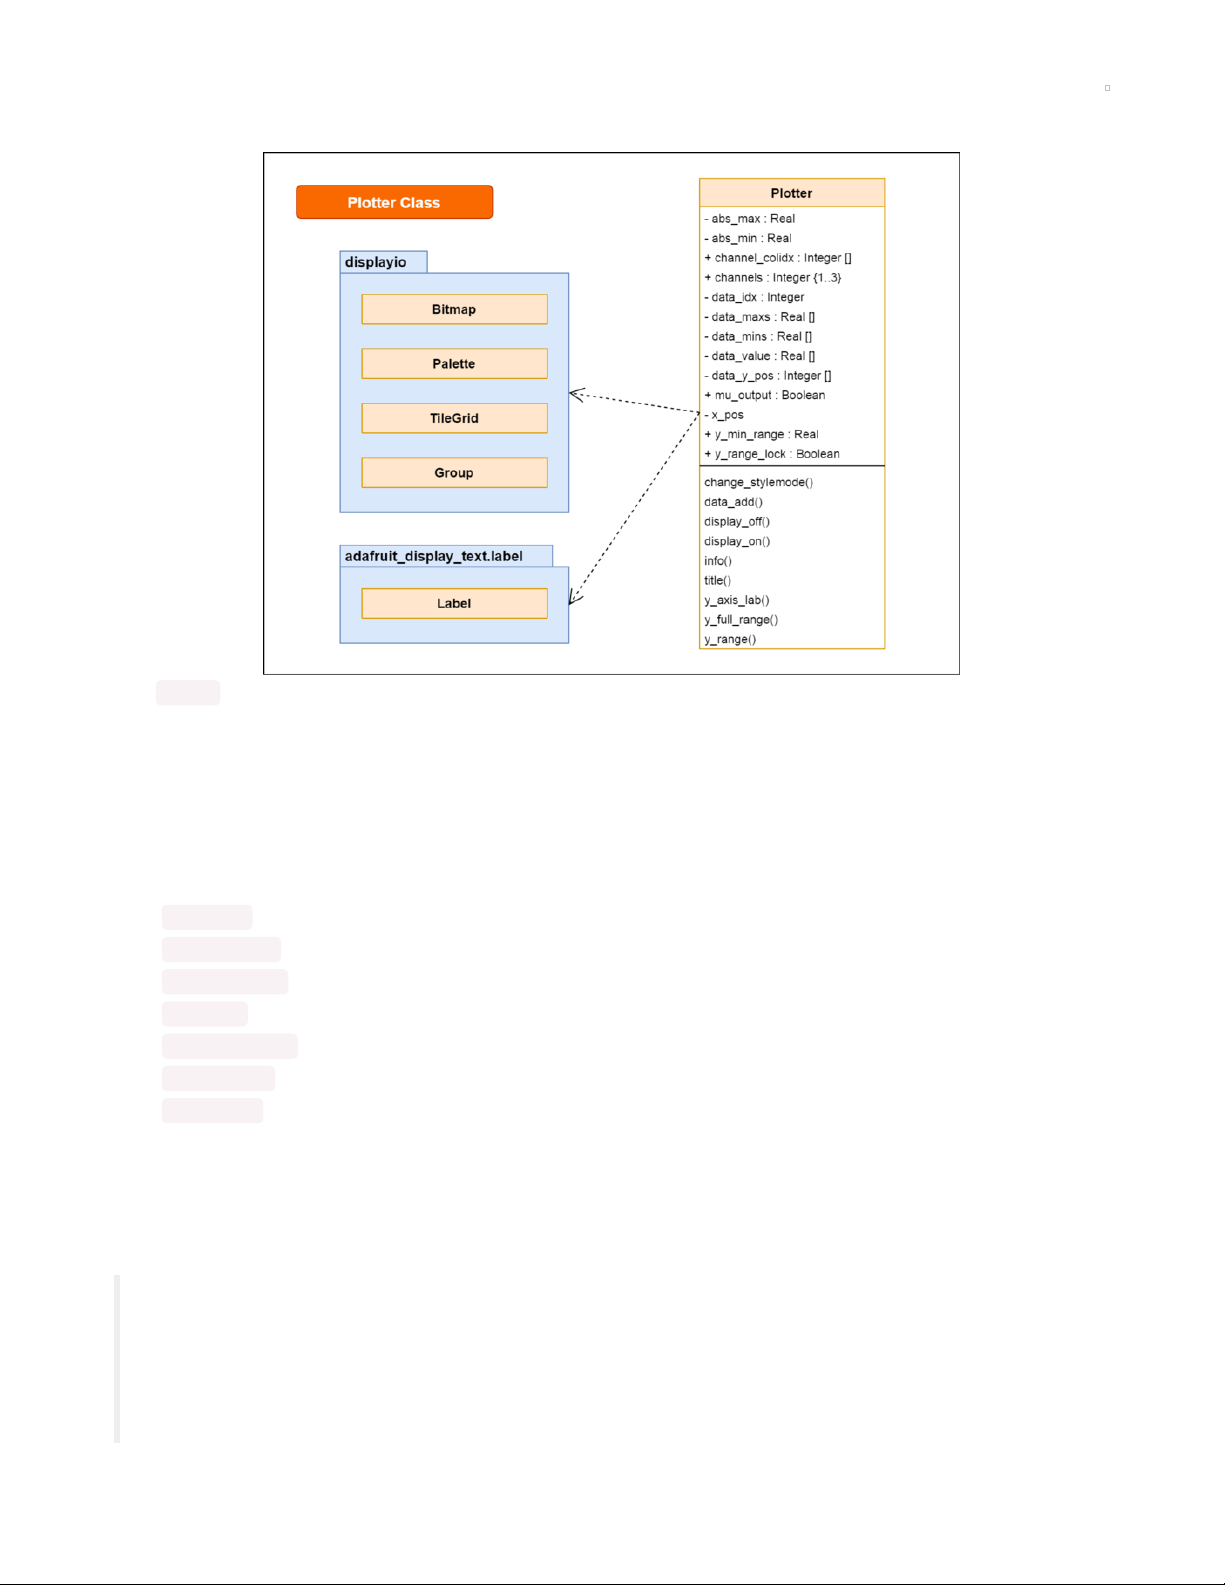
Plotter Class
The Plotter class takes the data and plots it on the screen with optional output to the serial console for
plotting by Mu or general data collection.
The full class diagram would reveal a lot of attributes and operations suggesting it's a bulky, complex
class. Sometimes this is indicative that the design could benefit from some further
decomposition (https://adafru.it/K8B) and refinement.
The expected usage after instantiation of the object is:
1. y_range() - set the initial range on the plot.
2. y_min_range - optional but limits the degree of zoom in.
3. y_full_range() - set the absolute range for data from sensor.
4. channels - set number of elements of data per sample.
5. channel_colidx - set colours to use in for of sequence of palette numbers.
6. display_on() - initialize display - once only.
7. data_add() - use repeatedly to draw new points or lines based on the settings - this will also
eventually scroll or wrap.
8. Goto 7.
Accessibility
From The Role of Accessibility in a Universal Web (https://adafru.it/K8C):
"Universal design" is the process of creating products that are usable by
people with the widest possible range of abilities, operating within the widest
possible range of situations; whereas "accessibility" primarily refers to design
© Adafruit Industries https://learn.adafruit.com/clue-sensor-plotter-circuitpython Page 11 of 77
Page 12
for people with disabilities. While the focus of accessibility is disabilities,
research and development in accessibility brings benefits to everyone,
particularly users with situational limitations, including device limitations and
environmental limitations.
Small devices like the CLUE with its 1.3" (33mm) screen are, by their nature, limited for the visual aspects of
accessibility but we can still consider:
contrast (https://adafru.it/K8D) for foreground/background colours of text,
thoughtful colour selection (https://adafru.it/K8E).
It's common and very tempting to represent (x,y,z) values
using the three primary colours: red, green and blue.
Unfortunately this combination clashes with common forms of
colour blindess (https://adafru.it/K8F).
The RGB palette is used in the sensor plotter for many of the sensors but the user can also
override
this
with a "default palette". This is loosely based on common digital storage oscilloscopes:
1. Yellow ( 0xffff00 ),
2. Cyan ( 0x00ffff ),
3. "Almost Pink" ( 0xff0080 ).
These can be tested on a colour simulator but it's best to test with some real people.
Auto-scaling Algorithm
The PlotSource object has methods to provide the absolute minimum and maximum values for the data
from that source. A typical feature would be to set the y axis scale based on the observed data values to
get a more detailed view.
The current algorithm is shown below in two flow charts, the second is a sub routine used in the first one.
© Adafruit Industries https://learn.adafruit.com/clue-sensor-plotter-circuitpython Page 12 of 77
Page 13
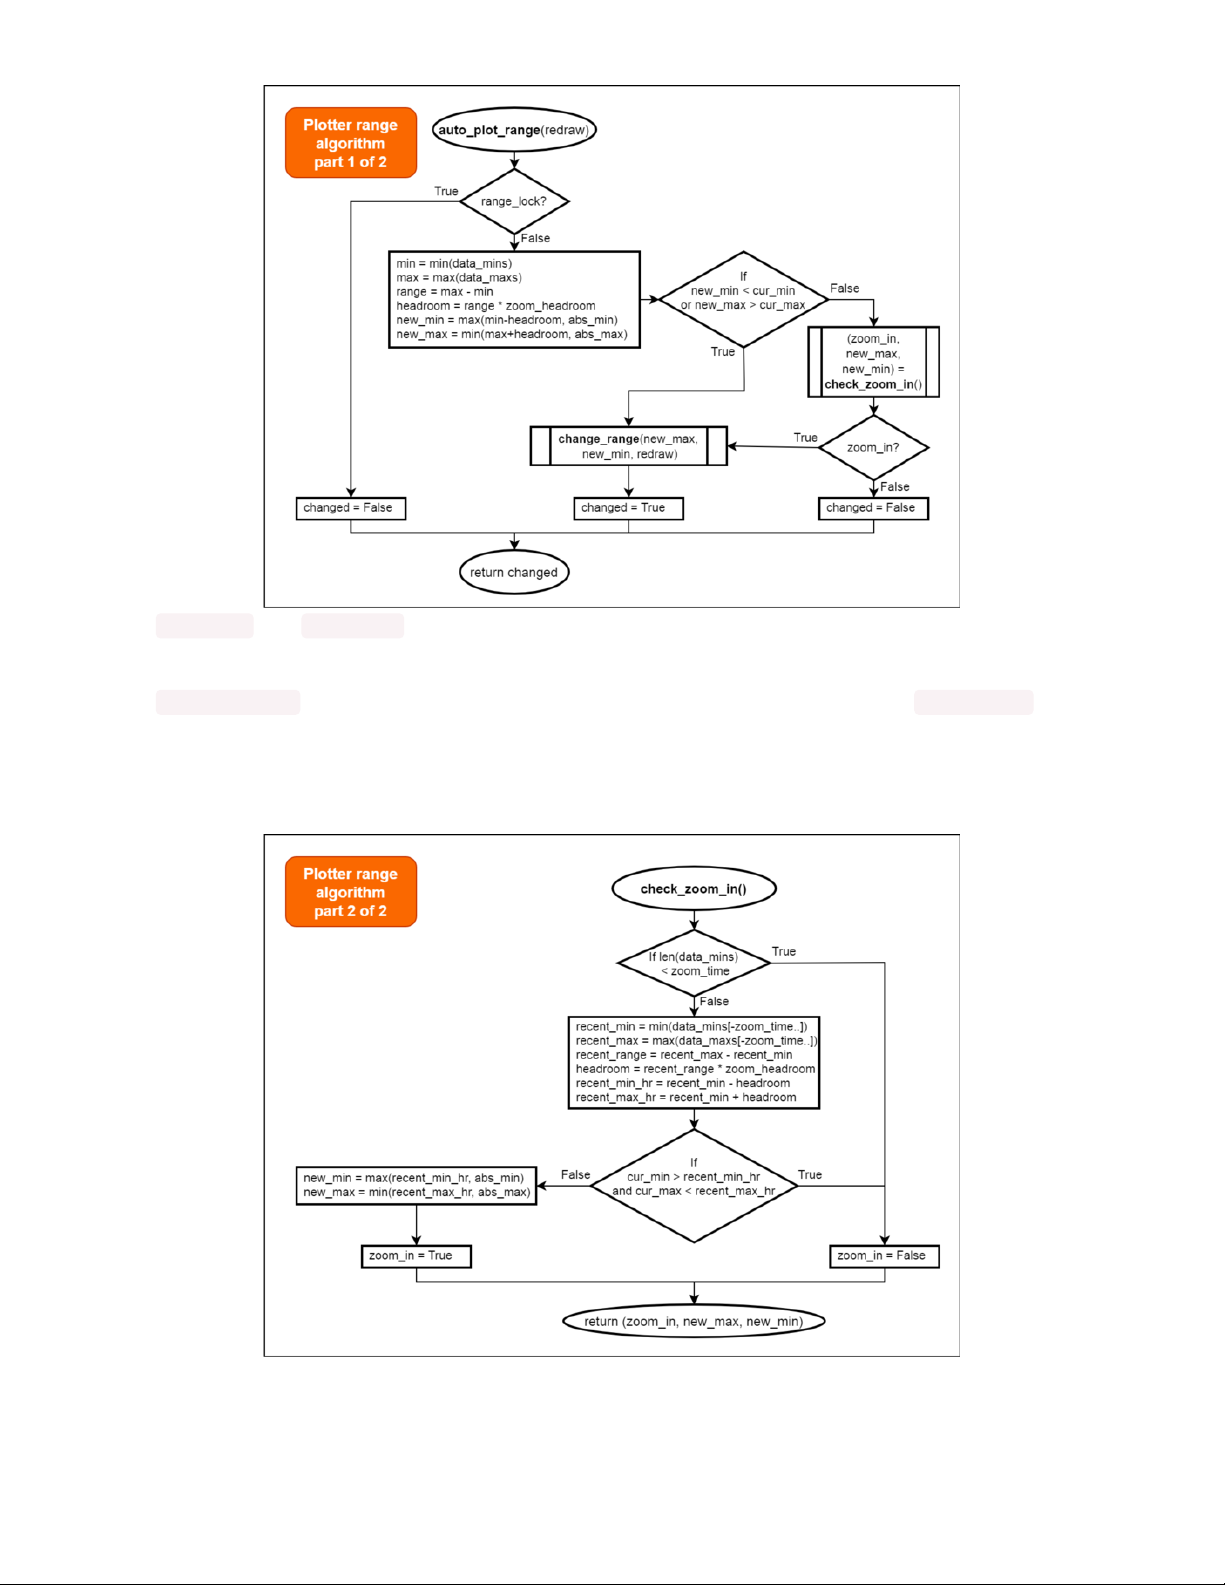
The data_mins and data_maxs are lists of the recent minimum and maximums for approximate 1 second
periods retained for a configurable number of seconds.
The change_range() sub routine (implemented as a method) implements the optional y_min_range feature.
This prevents zooming in excessively showing uninteresting, random noise from some sensors.
The zoom out will always occur if the data is off the current range, i.e. off screen. The zoom in is a little
more cautious.
There's one extra feature to reduce the frequency of zooming in not shown in the diagrams. A timestamp
is recorded whenever a zoom in takes place and this is used to prevent zooming in again until N seconds
© Adafruit Industries https://learn.adafruit.com/clue-sensor-plotter-circuitpython Page 13 of 77
Page 14

has passed.
Based on acceptance testing, the zooming still occurs when it looks unnecessary. This algorithm needs
further improvement perhaps using a hysterisis (https://adafru.it/K9a)-based approach.
Efficient Use of displayio
The displayio (https://adafru.it/EFr) library for CircuitPython (or Adafruit_GFX (https://adafru.it/K9b) for
Arduino) provides a single library which can be used with a variety of different size LED, LCD and ePaper
screens. This abstraction (https://adafru.it/K9c) is very useful and removes the need to directly program the
CLUE's ST7789 LCD display (https://adafru.it/K9d). The only details the programmer needs to know for low
update rates are:
the resolution of the screen (240x240) and
whether it has enough colour depth to render the desired colours sufficiently accurately (16bit).
These small LCD screens are not designed for high frame rates. If the screen needs to be updated
frequently then the performance needs to be explored. The displayio library is implemented in
compiled (https://adafru.it/K9e) code to improve the performance but it needs to be thoughtfully used from
CircuitPython since this is slower due to being executed on an interpreter (https://adafru.it/K9f).
Scrolling
A plotter needs to do something when the points/lines reach the edge of the screen. It can either
wrap like an oscilloscope or
scroll the existing data to the left.
The Bitmap (https://adafru.it/EFs) class does not currently provide clear, fill or scroll methods. Some early
exploratory programming (https://adafru.it/K9A)revealed that slice assignment isn't supported and
clearing a
large
Bitmap pixel by pixel is a
very slow
process. Some simple code to time clearing a Bitmap
is shown below.
# Quick benchmark of clearing a displayio Bitmap using for loops
# See https://github.com/adafruit/circuitpython/issues/2688
import time
import board, displayio
WIDTH = 201
HEIGHT = 200
display = board.DISPLAY
# eight colours is 3 bits per pixel when packed
bitmap = displayio.Bitmap(WIDTH, HEIGHT, 8)
palette = displayio.Palette(8)
palette[0] = 0x000000
palette[1] = 0xff0000
palette[2] = 0x00ff00
palette[3] = 0x0000ff
tile_grid = displayio.TileGrid(bitmap, pixel_shader=palette)
group = displayio.Group()
group.append(tile_grid)
© Adafruit Industries https://learn.adafruit.com/clue-sensor-plotter-circuitpython Page 14 of 77
Page 15

display.auto_refresh=False
display.show(group)
def refresh_screen(disp):
while True:
refreshed = False
try:
refreshed = disp.refresh(minimum_frames_per_second=0)
except Exception:
pass
if refreshed:
break
def fillscreen1(bmp, col_idx):
for x in range(WIDTH):
for y in range(HEIGHT):
bmp[x, y] = col_idx
def fillscreen2(bmp, col_idx):
for y in range(HEIGHT):
for x in range(WIDTH):
bmp[x, y] = col_idx
def fillscreen3(bmp, col_idx):
for idx in range(WIDTH * HEIGHT):
bmp[idx] = col_idx
# "Big" Python has a timeit library but not present on CircuitPython
# so it's time for some for loops
for func in (fillscreen1, fillscreen2, fillscreen3):
for _ in range(2):
for colour_idx in (0, 0, 0, 1, 2, 3):
t1 = time.monotonic_ns()
func(bitmap, colour_idx)
refresh_screen(display)
t2 = time.monotonic_ns()
func_name = str(func).split(" ")[1]
print(func_name,
colour_idx,
"{:.3f}s".format((t2 - t1) / 1e9))
time.sleep(0.5)
This simple benchmark (https://adafru.it/K9B) could be improved as it both updates the Bitmap data and
performs a single refresh of the screen. It would be informative to observe the performance of the two
actions individually.
The output is shown below. fillscreen1 takes 1.25 seconds, fillscreen3 is faster at 0.75 seconds, fillscreen2
isn't shown as it was same as fillscreen1 .
© Adafruit Industries https://learn.adafruit.com/clue-sensor-plotter-circuitpython Page 15 of 77
Page 16

fillscreen1 0 1.252s
fillscreen1 0 1.250s
fillscreen1 0 1.250s
fillscreen1 1 1.251s
fillscreen1 2 1.251s
fillscreen1 3 1.249s
fillscreen1 0 1.250s
fillscreen1 0 1.251s
fillscreen1 0 1.251s
fillscreen1 1 1.249s
fillscreen1 2 1.250s
fillscreen1 3 1.251s
fillscreen3 0 0.753s
fillscreen3 0 0.754s
fillscreen3 0 0.755s
fillscreen3 1 0.755s
fillscreen3 2 0.753s
fillscreen3 3 0.754s
fillscreen3 0 0.755s
fillscreen3 0 0.753s
fillscreen3 0 0.754s
fillscreen3 1 0.754s
fillscreen3 2 0.755s
fillscreen3 3 0.753s
These numbers would mean the screen would barely be able to update once per second. It's also slower
if two bitmaps are overlaid which is a tempting solution to providing a static background.
This benchmarking lead to a change in design to use a more complex "un-drawing" technique. This
reduces the number of pixel changes dramatically decreasing the time to clear the screen. The downside
is the added complexity in storing the data and in the procedure to draw over the existing plot with
background colour pixels.
Further testing revealed this undraw was still fairly slow. This lead to another iteration of the design.
Reducing the frequency of scrolling was required and this could be achieved with a "jump" scroll - scrolling
the data by more than one pixel at a time.
Resolution and Scaling
The final implementation of the Plotter class uses a Bitmap with a resolution of 192x201 pixels for the plot.
The width was reduced to allow an extra character on the y axis tick labels.
Group has a feature to scale objects by an integer amount. This is implemented in C and is likely to be
efficient. Another potential option to speed up the code would be to lower the resolution and use scale=2
to display it - a trade-off between resolution and performance. This could be implemented as a user-
selected option.
© Adafruit Industries https://learn.adafruit.com/clue-sensor-plotter-circuitpython Page 16 of 77
Page 17

CircuitPython on CLUE
CircuitPython (https://adafru.it/tB7) is a derivative of MicroPython (https://adafru.it/BeZ) designed to simplify
experimentation and education on low-cost microcontrollers. It makes it easier than ever to get
prototyping by requiring no upfront desktop software downloads. Simply copy and edit files on the
CIRCUITPY flash drive to iterate.
The following instructions will show you how to install CircuitPython. If you've already installed
CircuitPython but are looking to update it or reinstall it, the same steps work for that as well!
Set up CircuitPython Quick Start!
Follow this quick step-by-step for super-fast Python power :)
https://adafru.it/IHF
Click the link above to download the latest version of
CircuitPython for the CLUE.
Download and save it to your desktop (or wherever is handy).
Plug your CLUE into your computer using a known-good USB
cable.
A lot of people end up using charge-only USB cables and it is
very frustrating! So make sure you have a USB cable you
know is good for data sync.
Double-click the Reset button on the top (magenta arrow) on
your board, and you will see the NeoPixel RGB LED (green
arrow) turn green. If it turns red, check the USB cable, try
another USB port, etc. Note: The little red LED next to the
USB connector will pulse red. That's ok!
If double-clicking doesn't work the first time, try again.
Sometimes it can take a few tries to get the rhythm right!
https://adafru.it/IHF
© Adafruit Industries https://learn.adafruit.com/clue-sensor-plotter-circuitpython Page 17 of 77
Page 18
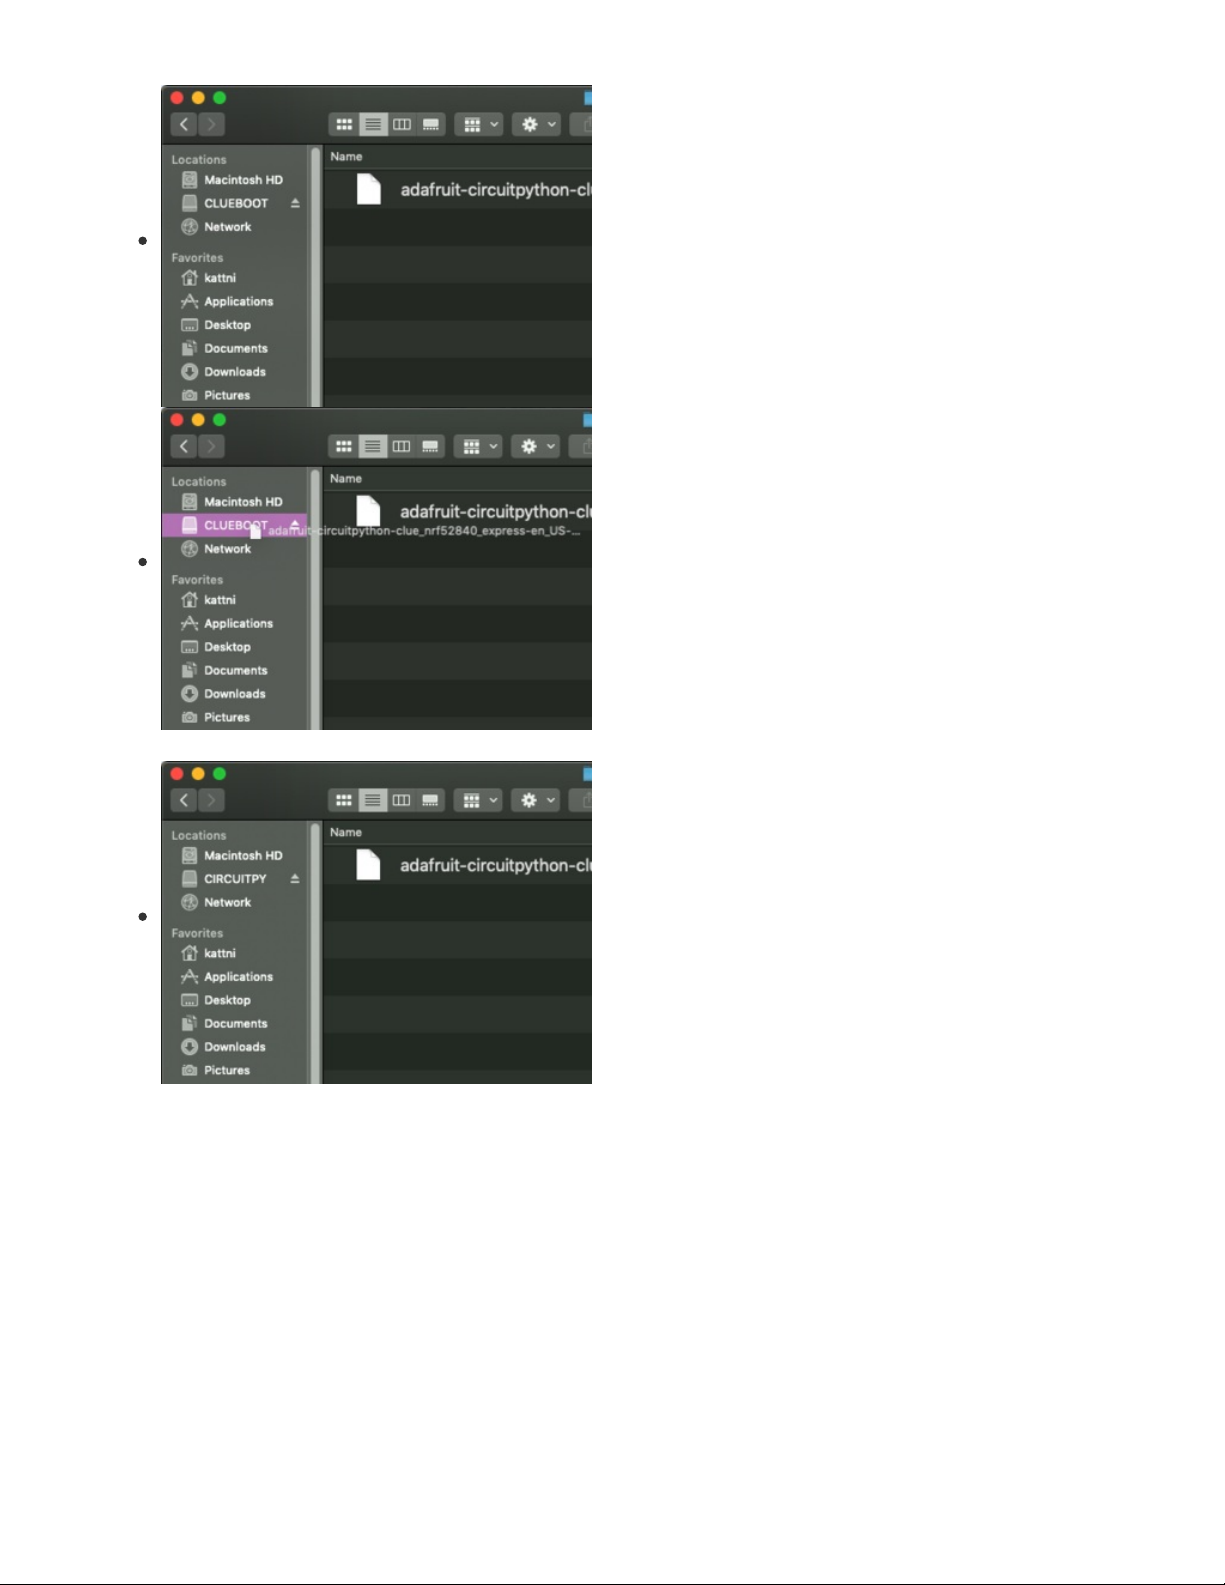
You will see a new disk drive appear called CLUEBOOT.
Drag the adafruit-circuitpython-clue-etc.uf2 file to
CLUEBOOT.
The LED will flash. Then, the CLUEBOOT drive will disappear
and a new disk drive called CIRCUITPY will appear.
If this is the first time you're installing CircuitPython or you're
doing a completely fresh install after erasing the filesystem,
you will have two files - boot_out.txt, and code.py, and one
folder - lib on your CIRCUITPY drive.
If CircuitPython was already installed, the files present before
reloading CircuitPython should still be present on your
CIRCUITPY drive. Loading CircuitPython will not create new
files if there was already a CircuitPython filesystem present.
That's it, you're done! :)
© Adafruit Industries https://learn.adafruit.com/clue-sensor-plotter-circuitpython Page 18 of 77
Page 19

CircuitPython
Libraries
Once you've gotten CircuitPython onto your Circuit Playground Bluefruit boards, it's time to add some
libraries. You can follow this guide page (https://adafru.it/GdM) for the basics of downloading and
transferring libraries to the board.
https://adafru.it/ENC
Libraries for Sensor Plotter
From the library bundle you downloaded in that guide page, transfer the following libraries onto the CLUE
board's /lib directory:
adafruit_register
adafruit_apds9960
adafruit_bus_device
adafruit_display_notification
adafruit_display_shapes
adafruit_display_text
adafruit_bmp280.mpy
adafruit_clue.mpy
adafruit_lis3mdl.mpy
adafruit_sht31d.mpy
adafruit_slideshow.mpy
neopixel.mpy
adafruit_lsm6ds.mpy
Take care with selecting the correct library, there are many that have similar names.
Development Testing
During development, the application was tested on a CLUE using CircuitPython 5.0.0 with libraries from
the adafruit-circuitpython-bundle-5.x-mpy-20200327.zip bundle. It should work on subsequent versions,
the latest version is recommended (https://adafru.it/FNK).
https://adafru.it/ENC
© Adafruit Industries https://learn.adafruit.com/clue-sensor-plotter-circuitpython Page 19 of 77
Page 20
Sensor Plotter
Download the three CircuitPython files below renaming the clue-plotter.py to code.py by clicking on the
links and then using Save as... / Save link as... in the browser. The files are hosted on Adafruit's GitHub
repo for this project (https://adafru.it/Kaw).
https://adafru.it/KaW
https://adafru.it/KaX
https://adafru.it/KaY
Plug your CLUE board into your computer via a known-good USB data cable. A flash drive named
CIRCUITPY should appear in your file explorer/finder program. Copy the three files t o the CIRCUITPY
drive ensuring the clue-plotter.py is renamed to code.py. (https://adafru.it/EL3)
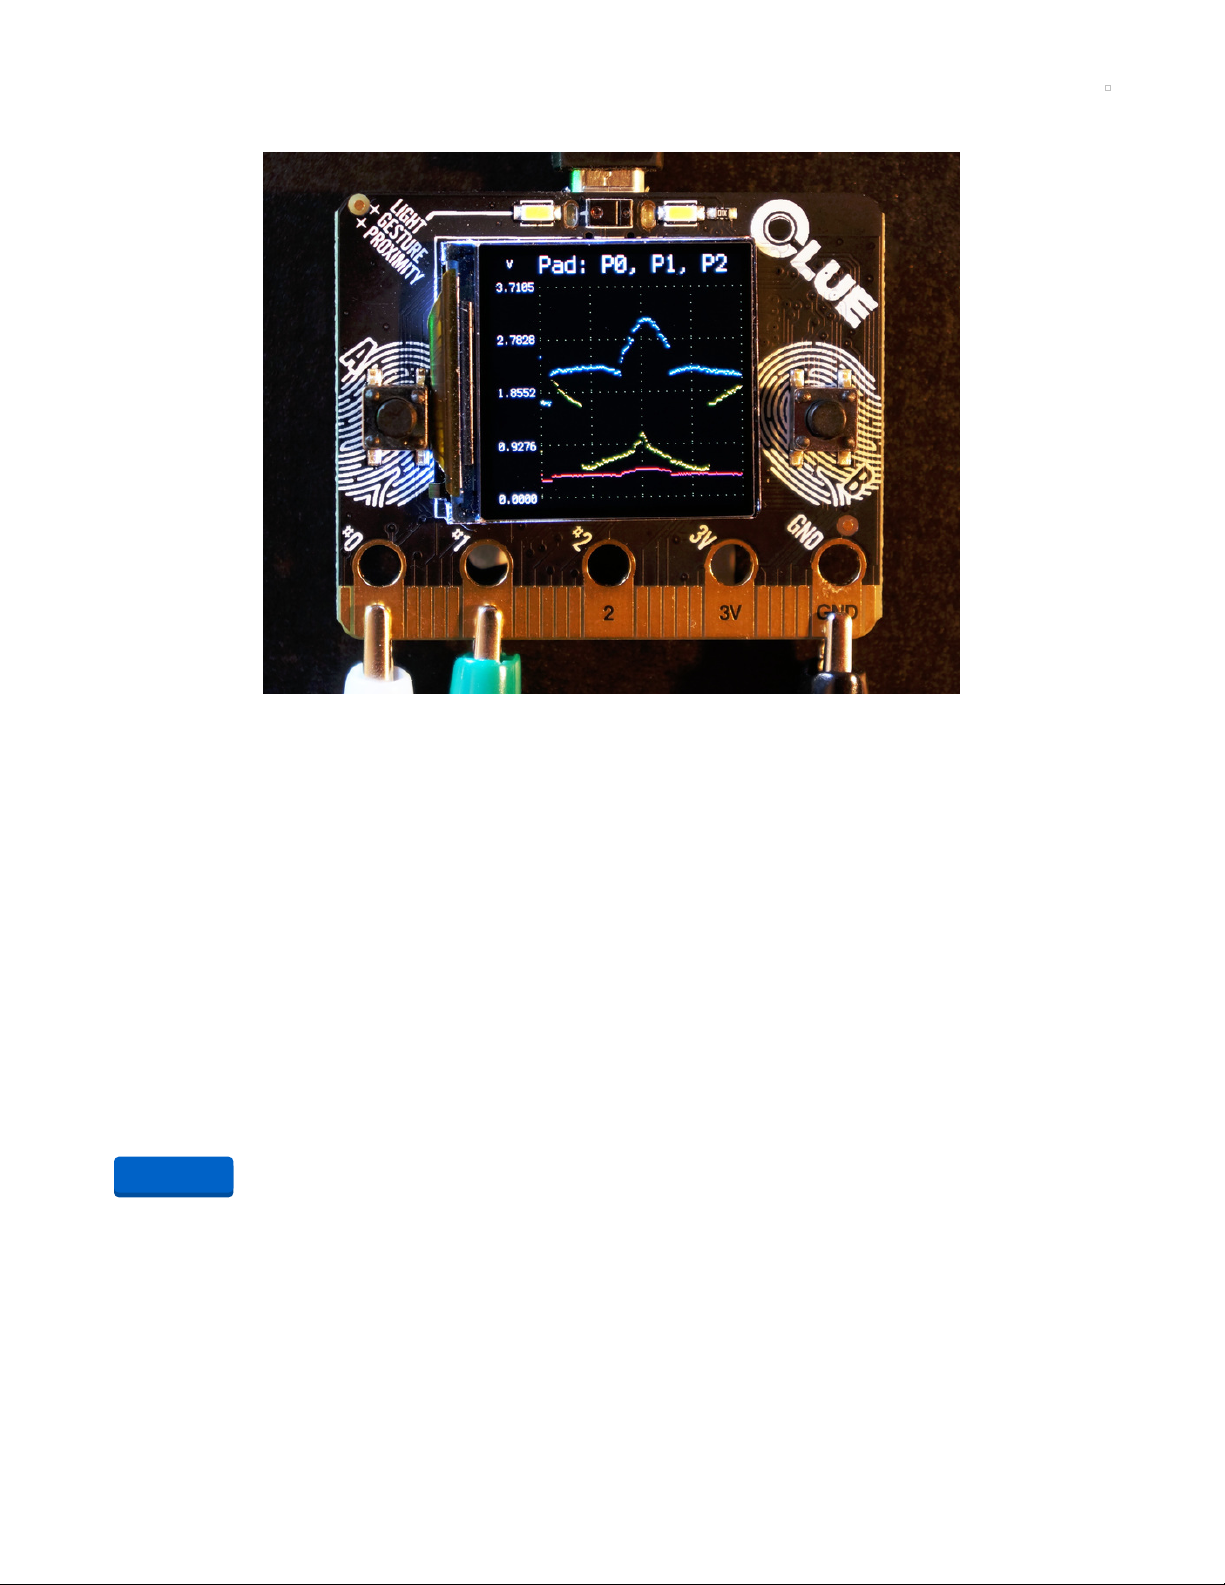
Example Video
The video below demonstrates all of the sensors and at the end shows the analogue inputs on the three
large pads marked #0, #1 and #2. A Feather M4 Express provides colour and two signals for #0 and #1 for
the demonstration.
The following sections show the lengthy code in all three files. There is also a Code
Discussion (https://adafru.it/Kbm) section at the bottom of the page.
Code
code.py
The file must be renamed to code.py to run on the CLUE. If you select Download: Project Zip, you will get
all three files in one zip archive file.
https://adafru.it/KaW
https://adafru.it/KaX
https://adafru.it/KaY
© Adafruit Industries https://learn.adafruit.com/clue-sensor-plotter-circuitpython Page 20 of 77
Page 21

# clue-plotter v1.14
# Sensor and input plotter for Adafruit CLUE in CircuitPython
# This plots the sensors and three of the analogue inputs on
# the LCD display either with scrolling or wrap mode which
# approximates a slow timebase oscilloscope, left button selects
# next source or with long press changes palette or longer press
# turns on output for Mu plotting, right button changes plot style
# Tested with an Adafruit CLUE (Alpha) and CircuitPython and 5.0.0
# copy this file to CLUE board as code.py
# needs companion plot_sensor.py and plotter.py files
# MIT License
# Copyright (c) 2020 Kevin J. Walters
# Permission is hereby granted, free of charge, to any person obtaining a copy
# of this software and associated documentation files (the "Software"), to deal
# in the Software without restriction, including without limitation the rights
# to use, copy, modify, merge, publish, distribute, sublicense, and/or sell
# copies of the Software, and to permit persons to whom the Software is
# furnished to do so, subject to the following conditions:
# The above copyright notice and this permission notice shall be included in all
# copies or substantial portions of the Software.
# THE SOFTWARE IS PROVIDED "AS IS", WITHOUT WARRANTY OF ANY KIND, EXPRESS OR
# IMPLIED, INCLUDING BUT NOT LIMITED TO THE WARRANTIES OF MERCHANTABILITY,
# FITNESS FOR A PARTICULAR PURPOSE AND NONINFRINGEMENT. IN NO EVENT SHALL THE
# AUTHORS OR COPYRIGHT HOLDERS BE LIABLE FOR ANY CLAIM, DAMAGES OR OTHER
# LIABILITY, WHETHER IN AN ACTION OF CONTRACT, TORT OR OTHERWISE, ARISING FROM,
# OUT OF OR IN CONNECTION WITH THE SOFTWARE OR THE USE OR OTHER DEALINGS IN THE
# SOFTWARE.
import time
import gc
import board
from plotter import Plotter
from plot_source import PlotSource, TemperaturePlotSource, PressurePlotSource, \
HumidityPlotSource, ColorPlotSource, ProximityPlotSource, \
IlluminatedColorPlotSource, VolumePlotSource, \
AccelerometerPlotSource, GyroPlotSource, \
MagnetometerPlotSource, PinPlotSource
from adafruit_clue import clue
debug = 1
# A list of all the data sources for plotting
sources = [TemperaturePlotSource(clue, mode="Celsius"),
TemperaturePlotSource(clue, mode="Fahrenheit"),
PressurePlotSource(clue, mode="Metric"),
PressurePlotSource(clue, mode="Imperial"),
HumidityPlotSource(clue),
ColorPlotSource(clue),
ProximityPlotSource(clue),
IlluminatedColorPlotSource(clue, mode="Red"),
IlluminatedColorPlotSource(clue, mode="Green"),
IlluminatedColorPlotSource(clue, mode="Blue"),
© Adafruit Industries https://learn.adafruit.com/clue-sensor-plotter-circuitpython Page 21 of 77
Page 22

IlluminatedColorPlotSource(clue, mode="Blue"),
IlluminatedColorPlotSource(clue, mode="Clear"),
VolumePlotSource(clue),
AccelerometerPlotSource(clue),
GyroPlotSource(clue),
MagnetometerPlotSource(clue),
PinPlotSource([board.P0, board.P1, board.P2])
]
# The first source to select when plotting starts
current_source_idx = 0
# The various plotting styles - scroll is currently a jump scroll
stylemodes = (("lines", "scroll"), # draws lines between points
("lines", "wrap"),
("dots", "scroll"), # just points - slightly quicker
("dots", "wrap")
)
current_sm_idx = 0
def d_print(level, *args, **kwargs):
"""A simple conditional print for debugging based on global debug level."""
if not isinstance(level, int):
print(level, *args, **kwargs)
elif debug >= level:
print(*args, **kwargs)
def select_colors(plttr, src, def_palette):
"""Choose the colours based on the particular PlotSource
or forcing use of default palette."""
# otherwise use defaults
channel_colidx = []
palette = plttr.get_colors()
colors = PlotSource.DEFAULT_COLORS if def_palette else src.colors()
for col in colors:
try:
channel_colidx.append(palette.index(col))
except ValueError:
channel_colidx.append(PlotSource.DEFAULT_COLORS.index(col))
return channel_colidx
def ready_plot_source(plttr, srcs, def_palette, index=0):
"""Select the plot source by index from srcs list and then setup the
plot parameters by retrieving meta-data from the PlotSource object."""
src = srcs[index]
# Put the description of the source on screen at the top
source_name = str(src)
d_print(1, "Selecting source:", source_name)
plttr.clear_all()
plttr.title = source_name
plttr.y_axis_lab = src.units()
# The range on graph will start at this value
plttr.y_range = (src.initial_min(), src.initial_max())
plttr.y_min_range = src.range_min()
# Sensor/data source is expected to produce data between these values
plttr.y_full_range = (src.min(), src.max())
channels_from_src = src.values()
plttr.channels = channels_from_src # Can be between 1 and 3
plttr.channel_colidx = select_colors(plttr, src, def_palette)
src.start()
return (src, channels_from_src)
© Adafruit Industries https://learn.adafruit.com/clue-sensor-plotter-circuitpython Page 22 of 77
Page 23

def wait_release(func, menu):
"""Calls func repeatedly waiting for it to return a false value
and goes through menu list as time passes.
The menu is a list of menu entries where each entry is a
two element list of time passed in seconds and text to display
for that period.
The entries must be in ascending time order."""
start_t_ns = time.monotonic_ns()
menu_option = None
selected = False
for menu_option, menu_entry in enumerate(menu):
menu_time_ns = start_t_ns + int(menu_entry[0] * 1e9)
menu_text = menu_entry[1]
if menu_text:
plotter.info = menu_text
while time.monotonic_ns() < menu_time_ns:
if not func():
selected = True
break
if menu_text:
plotter.info = ""
if selected:
break
return (menu_option, (time.monotonic_ns() - start_t_ns) * 1e-9)
def popup_text(plttr, text, duration=1.0):
"""Place some text on the screen using info property of Plotter object
for duration seconds."""
plttr.info = text
time.sleep(duration)
plttr.info = None
mu_plotter_output = False
range_lock = False
initial_title = "CLUE Plotter"
# displayio has some static limits on text - pre-calculate the maximum
# length of all of the different PlotSource objects
max_title_len = max(len(initial_title), max([len(str(so)) for so in sources]))
plotter = Plotter(board.DISPLAY,
style=stylemodes[current_sm_idx][0],
mode=stylemodes[current_sm_idx][1],
title=initial_title,
max_title_len=max_title_len,
mu_output=mu_plotter_output,
debug=debug)
# If set to true this forces use of colour blindness friendly colours
use_def_pal = False
clue.pixel[0] = clue.BLACK # turn off the NeoPixel on the back of CLUE board
plotter.display_on()
# Using left and right here in case the CLUE is cased hiding A/B labels
popup_text(plotter,
© Adafruit Industries https://learn.adafruit.com/clue-sensor-plotter-circuitpython Page 23 of 77
Page 24

"\n".join(["Button Guide",
"Left: next source",
" 2secs: palette",
" 4s: Mu plot",
" 6s: range lock",
"Right: style change"]), duration=10)
count = 0
while True:
# Set the source and start items
(source, channels) = ready_plot_source(plotter, sources,
use_def_pal,
current_source_idx)
while True:
# Read data from sensor or voltage from pad
all_data = source.data()
# Check for left (A) and right (B) buttons
if clue.button_a:
# Wait for button release with time-based menu
opt, _ = wait_release(lambda: clue.button_a,
[(2, "Next\nsource"),
(4,
("Source" if use_def_pal else "Default")
+ "\npalette"),
(6,
"Mu output "
+ ("off" if mu_plotter_output else "on")),
(8,
"Range lock\n" + ("off" if range_lock else "on"))
])
if opt == 0: # change plot source
current_source_idx = (current_source_idx + 1) % len(sources)
break # to leave inner while and select the new source
elif opt == 1: # toggle palette
use_def_pal = not use_def_pal
plotter.channel_colidx = select_colors(plotter, source,
use_def_pal)
elif opt == 2: # toggle Mu output
mu_plotter_output = not mu_plotter_output
plotter.mu_output = mu_plotter_output
else: # toggle range lock
range_lock = not range_lock
plotter.y_range_lock = range_lock
if clue.button_b: # change plot style and mode
current_sm_idx = (current_sm_idx + 1) % len(stylemodes)
(new_style, new_mode) = stylemodes[current_sm_idx]
wait_release(lambda: clue.button_b,
[(2, new_style + "\n" + new_mode)])
d_print(1, "Graph change", new_style, new_mode)
plotter.change_stylemode(new_style, new_mode)
# Display it
if channels == 1:
plotter.data_add((all_data,))
else:
plotter.data_add(all_data)
© Adafruit Industries https://learn.adafruit.com/clue-sensor-plotter-circuitpython Page 24 of 77
Page 25

# An occasional print of free heap
if debug >=3 and count % 15 == 0:
gc.collect() # must collect() first to measure free memory
print("Free memory:", gc.mem_free())
count += 1
source.stop()
plotter.display_off()
plot_source.py
# MIT License
# Copyright (c) 2020 Kevin J. Walters
# Permission is hereby granted, free of charge, to any person obtaining a copy
# of this software and associated documentation files (the "Software"), to deal
# in the Software without restriction, including without limitation the rights
# to use, copy, modify, merge, publish, distribute, sublicense, and/or sell
# copies of the Software, and to permit persons to whom the Software is
# furnished to do so, subject to the following conditions:
# The above copyright notice and this permission notice shall be included in all
# copies or substantial portions of the Software.
# THE SOFTWARE IS PROVIDED "AS IS", WITHOUT WARRANTY OF ANY KIND, EXPRESS OR
# IMPLIED, INCLUDING BUT NOT LIMITED TO THE WARRANTIES OF MERCHANTABILITY,
# FITNESS FOR A PARTICULAR PURPOSE AND NONINFRINGEMENT. IN NO EVENT SHALL THE
# AUTHORS OR COPYRIGHT HOLDERS BE LIABLE FOR ANY CLAIM, DAMAGES OR OTHER
# LIABILITY, WHETHER IN AN ACTION OF CONTRACT, TORT OR OTHERWISE, ARISING FROM,
# OUT OF OR IN CONNECTION WITH THE SOFTWARE OR THE USE OR OTHER DEALINGS IN THE
# SOFTWARE.
"""
`plot_source`
================================================================================
CircuitPython library for the clue-plotter application.
* Author(s): Kevin J. Walters
Implementation Notes
-------------------**Hardware:**
* Adafruit CLUE <https://www.adafruit.com/product/4500>
**Software and Dependencies:**
* Adafruit's CLUE library: https://github.com/adafruit/Adafruit_CircuitPython_CLUE
"""
import math
import analogio
class PlotSource():
"""An abstract class for a sensor which returns the data from the sensor
and provides some metadata useful for plotting.
Sensors returning vector quanities like a 3-axis accelerometer are supported.
When the source is used start() will be called and when it's not needed stop() will
be called.
© Adafruit Industries https://learn.adafruit.com/clue-sensor-plotter-circuitpython Page 25 of 77
Page 26

:param values: Number of values returned by data method, between 1 and 3.
:param name: Name of the sensor used to title the graph, only 17 characters fit on screen.
:param units: Units for data used for y axis label.
:param abs_min: Absolute minimum value for data, defaults to 0.
:param abs_max: Absolute maximum value for data, defaults to 65535.
:param initial_min: The initial minimum value suggested for y axis on graph,
defaults to abs_min.
:param initial_max: The initial maximum value suggested for y axis on graph,
defaults to abs_max.
:param range_min: A suggested minimum range to aid automatic y axis ranging.
:param rate: The approximate rate in Hz that that data method returns in a tight loop.
:param colors: A list of the suggested colors for data.
:param debug: A numerical debug level, defaults to 0.
"""
DEFAULT_COLORS = (0xffff00, 0x00ffff, 0xff0080)
RGB_COLORS = (0xff0000, 0x00ff00, 0x0000ff)
def __init__(self, values, name, units="",
abs_min=0, abs_max=65535, initial_min=None, initial_max=None,
range_min=None,
rate=None, colors=None, debug=0):
if type(self) == PlotSource: # pylint: disable=unidiomatic-typecheck
raise TypeError("PlotSource must be subclassed")
self._values = values
self._name = name
self._units = units
self._abs_min = abs_min
self._abs_max = abs_max
self._initial_min = initial_min if initial_min is not None else abs_min
self._initial_max = initial_max if initial_max is not None else abs_max
if range_min is None:
self._range_min = (abs_max - abs_min) / 100 # 1% of full range
else:
self._range_min = range_min
self._rate = rate
if colors is not None:
self._colors = colors
else:
self._colors = self.DEFAULT_COLORS[:values]
self._debug = debug
def __str__(self):
return self._name
def data(self):
"""Data sample from the sensor.
:return: A single numerical value or an array or tuple for vector values.
"""
raise NotImplementedError()
def min(self):
return self._abs_min
def max(self):
return self._abs_max
def initial_min(self):
return self._initial_min
def initial_max(self):
return self._initial_max
© Adafruit Industries https://learn.adafruit.com/clue-sensor-plotter-circuitpython Page 26 of 77
Page 27

def range_min(self):
return self._range_min
def start(self):
pass
def stop(self):
pass
def values(self):
return self._values
def units(self):
return self._units
def rate(self):
return self._rate
def colors(self):
return self._colors
# This over-reads presumably due to electronics warming the board
# It also looks odd on close inspection as it climbs about 0.1C if
# it's read frequently
# Data sheet say operating temperature is -40C to 85C
class TemperaturePlotSource(PlotSource):
def _convert(self, value):
return value * self._scale + self._offset
def __init__(self, my_clue, mode="Celsius"):
self._clue = my_clue
range_min = 0.8
if mode[0].lower() == "f":
mode_name = "Fahrenheit"
self._scale = 1.8
self._offset = 32.0
range_min = 1.6
elif mode[0].lower() == "k":
mode_name = "Kelvin"
self._scale = 1.0
self._offset = 273.15
else:
mode_name = "Celsius"
self._scale = 1.0
self._offset = 0.0
super().__init__(1, "Temperature",
units=mode_name[0],
abs_min=self._convert(-40),
abs_max=self._convert(85),
initial_min=self._convert(10),
initial_max=self._convert(40),
range_min=range_min,
rate=24)
def data(self):
return self._convert(self._clue.temperature)
# The 300, 1100 values are in adafruit_bmp280 but are private variables
class PressurePlotSource(PlotSource):
def _convert(self, value):
return value * self._scale
© Adafruit Industries https://learn.adafruit.com/clue-sensor-plotter-circuitpython Page 27 of 77
Page 28

def __init__(self, my_clue, mode="M"):
self._clue = my_clue
if mode[0].lower() == "i":
# 29.92 inches mercury equivalent to 1013.25mb in ISA
self._scale = 29.92 / 1013.25
units = "inHg"
range_min = 0.04
else:
self._scale = 1.0
units = "hPa" # AKA millibars (mb)
range_min = 1
super().__init__(1, "Pressure", units=units,
abs_min=self._convert(300), abs_max=self._convert(1100),
initial_min=self._convert(980), initial_max=self._convert(1040),
range_min=range_min,
rate=22)
def data(self):
return self._convert(self._clue.pressure)
class ProximityPlotSource(PlotSource):
def __init__(self, my_clue):
self._clue = my_clue
super().__init__(1, "Proximity",
abs_min=0, abs_max=255,
rate=720)
def data(self):
return self._clue.proximity
class HumidityPlotSource(PlotSource):
def __init__(self, my_clue):
self._clue = my_clue
super().__init__(1, "Rel. Humidity", units="%",
abs_min=0, abs_max=100, initial_min=20, initial_max=60,
rate=54)
def data(self):
return self._clue.humidity
# If clue.touch_N has not been used then it doesn't instantiate
# the TouchIn object so there's no problem with creating an AnalogIn...
class PinPlotSource(PlotSource):
def __init__(self, pin):
try:
pins = [p for p in pin]
except TypeError:
pins = [pin]
self._pins = pins
self._analogin = [analogio.AnalogIn(p) for p in pins]
# Assumption here that reference_voltage is same for all
# 3.3V graphs nicely with rounding up to 4.0V
self._reference_voltage = self._analogin[0].reference_voltage
self._conversion_factor = self._reference_voltage / (2**16 - 1)
super().__init__(len(pins),
"Pad: " + ", ".join([str(p).split('.')[-1] for p in pins]),
units="V",
abs_min=0.0, abs_max=math.ceil(self._reference_voltage),
© Adafruit Industries https://learn.adafruit.com/clue-sensor-plotter-circuitpython Page 28 of 77
Page 29

rate=10000)
def data(self):
if len(self._analogin) == 1:
return self._analogin[0].value * self._conversion_factor
else:
return tuple([ana.value * self._conversion_factor
for ana in self._analogin])
def pins(self):
return self._pins
class ColorPlotSource(PlotSource):
def __init__(self, my_clue):
self._clue = my_clue
super().__init__(3, "Color: R, G, B",
abs_min=0, abs_max=8000, # 7169 looks like max
rate=50,
colors=self.RGB_COLORS,
)
def data(self):
(r, g, b, _) = self._clue.color # fourth value is clear value
return (r, g, b)
def start(self):
# These values will affect the maximum return value
# Set APDS9660 to sample every (256 - 249 ) * 2.78 = 19.46ms
# pylint: disable=protected-access
self._clue._sensor.integration_time = 249 # 19.46ms, ~ 50Hz
self._clue._sensor.color_gain = 0x02 # 16x (library default is 4x)
class IlluminatedColorPlotSource(PlotSource):
def __init__(self, my_clue, mode="Clear"):
self._clue = my_clue
col_fl_lc = mode[0].lower()
if col_fl_lc == "r":
plot_colour = self.RGB_COLORS[0]
elif col_fl_lc == "g":
plot_colour = self.RGB_COLORS[1]
elif col_fl_lc == "b":
plot_colour = self.RGB_COLORS[2]
elif col_fl_lc == "c":
plot_colour = self.DEFAULT_COLORS[0]
else:
raise ValueError("Colour must be Red, Green, Blue or Clear")
self._channel = col_fl_lc
super().__init__(1, "Illum. color: " + self._channel.upper(),
abs_min=0, abs_max=8000,
initial_min=0, initial_max=2000,
colors=(plot_colour,),
rate=50)
def data(self):
(r, g, b, c) = self._clue.color
if self._channel == "r":
return r
elif self._channel == "g":
return g
elif self._channel == "b":
© Adafruit Industries https://learn.adafruit.com/clue-sensor-plotter-circuitpython Page 29 of 77
Page 30

return b
elif self._channel == "c":
return c
else:
return None # This should never happen
def start(self):
# Set APDS9660 to sample every (256 - 249 ) * 2.78 = 19.46ms
# pylint: disable=protected-access
self._clue._sensor.integration_time = 249 # 19.46ms, ~ 50Hz
self._clue._sensor.color_gain = 0x03 # 64x (library default is 4x)
self._clue.white_leds = True
def stop(self):
self._clue.white_leds = False
class VolumePlotSource(PlotSource):
def __init__(self, my_clue):
self._clue = my_clue
super().__init__(1, "Volume", units="dB",
abs_min=0, abs_max=97+3, # 97dB is 16bit dynamic range
initial_min=10, initial_max=60,
rate=41)
# 20 due to conversion of amplitude of signal
_LN_CONVERSION_FACTOR = 20 / math.log(10)
def data(self):
return (math.log(self._clue.sound_level + 1)
* self._LN_CONVERSION_FACTOR)
# This appears not to be a blocking read in terms of waiting for a
# a genuinely newvalue from the sensor
# CP standard says this should be radians per second but library
# currently returns degrees per second
# https://circuitpython.readthedocs.io/en/latest/docs/design_guide.html
# https://github.com/adafruit/Adafruit_CircuitPython_LSM6DS/issues/9
class GyroPlotSource(PlotSource):
def __init__(self, my_clue):
self._clue = my_clue
super().__init__(3, "Gyro", units="dps",
abs_min=-287-13, abs_max=287+13, # 286.703 appears to be max
initial_min=-100, initial_max=100,
colors=self.RGB_COLORS,
rate=500)
def data(self):
return self._clue.gyro
class AccelerometerPlotSource(PlotSource):
def __init__(self, my_clue):
self._clue = my_clue
super().__init__(3, "Accelerometer", units="ms-2",
abs_min=-40, abs_max=40, # 39.1992 approx max
initial_min=-20, initial_max=20,
colors=self.RGB_COLORS,
rate=500)
def data(self):
return self._clue.acceleration
© Adafruit Industries https://learn.adafruit.com/clue-sensor-plotter-circuitpython Page 30 of 77
Page 31

return self._clue.acceleration
class MagnetometerPlotSource(PlotSource):
def __init__(self, my_clue):
self._clue = my_clue
super().__init__(3, "Magnetometer", units="uT",
abs_min=-479-21, abs_max=479+21, # 478.866 approx max
initial_min=-80, initial_max=80, # Earth around 60uT
colors=self.RGB_COLORS,
rate=500)
def data(self):
return self._clue.magnetic
plotter.py
# MIT License
# Copyright (c) 2020 Kevin J. Walters
# Permission is hereby granted, free of charge, to any person obtaining a copy
# of this software and associated documentation files (the "Software"), to deal
# in the Software without restriction, including without limitation the rights
# to use, copy, modify, merge, publish, distribute, sublicense, and/or sell
# copies of the Software, and to permit persons to whom the Software is
# furnished to do so, subject to the following conditions:
# The above copyright notice and this permission notice shall be included in all
# copies or substantial portions of the Software.
# THE SOFTWARE IS PROVIDED "AS IS", WITHOUT WARRANTY OF ANY KIND, EXPRESS OR
# IMPLIED, INCLUDING BUT NOT LIMITED TO THE WARRANTIES OF MERCHANTABILITY,
# FITNESS FOR A PARTICULAR PURPOSE AND NONINFRINGEMENT. IN NO EVENT SHALL THE
# AUTHORS OR COPYRIGHT HOLDERS BE LIABLE FOR ANY CLAIM, DAMAGES OR OTHER
# LIABILITY, WHETHER IN AN ACTION OF CONTRACT, TORT OR OTHERWISE, ARISING FROM,
# OUT OF OR IN CONNECTION WITH THE SOFTWARE OR THE USE OR OTHER DEALINGS IN THE
# SOFTWARE.
"""
`plotter`
================================================================================
CircuitPython library for the clue-plotter application's plotting facilties.
Internally this holds some values in a circular buffer to enable redrawing
and has some basic statistics on data.
Not intended to be a truly general purpose plotter but perhaps could be
developed into one.
* Author(s): Kevin J. Walters
Implementation Notes
-------------------**Hardware:**
* Adafruit CLUE <https://www.adafruit.com/product/4500>
**Software and Dependencies:**
* Adafruit's CLUE library: https://github.com/adafruit/Adafruit_CircuitPython_CLUE
"""
import time
import array
import displayio
import terminalio
© Adafruit Industries https://learn.adafruit.com/clue-sensor-plotter-circuitpython Page 31 of 77
Page 32

from adafruit_display_text.label import Label
def mapf(value, in_min, in_max, out_min, out_max):
return (value - in_min) * (out_max - out_min) / (in_max - in_min) + out_min
# This creates ('{:.0f}', '{:.1f}', '{:.2f}', etc
_FMT_DEC_PLACES = tuple("{:." + str(x) + "f}" for x in range(10))
def format_width(nchars, value):
"""Simple attempt to generate a value within nchars characters.
Return value can be too long, e.g. for nchars=5, bad things happen
with values > 99999 or < -9999 or < -99.9."""
neg_format = _FMT_DEC_PLACES[nchars - 3]
pos_format = _FMT_DEC_PLACES[nchars - 2]
if value <= -10.0:
text_value = neg_format.format(value) # may overflow width
elif value < 0.0:
text_value = neg_format.format(value)
elif value >= 10.0:
text_value = pos_format.format(value) # may overflow width
else:
text_value = pos_format.format(value) # 0.0 to 9.99999
return text_value
class Plotter():
_DEFAULT_SCALE_MODE = {"lines": "onscroll",
"dots": "screen"}
# Palette for plotting, first one is set transparent
TRANSPARENT_IDX = 0
# Removed one colour to get number down to 8 for more efficient
# bit-packing in displayio's Bitmap
_PLOT_COLORS = (0x000000,
0x0000ff,
0x00ff00,
0x00ffff,
0xff0000,
# 0xff00ff,
0xffff00,
0xffffff,
0xff0080)
POS_INF = float("inf")
NEG_INF = float("-inf")
# Approximate number of seconds to review data for zooming in
# and how often to do that check
ZOOM_IN_TIME = 8
ZOOM_IN_CHECK_TIME_NS = 5 * 1e9
# 20% headroom either side on zoom in/out
ZOOM_HEADROOM = 20 / 100
GRID_COLOR = 0x308030
GRID_DOT_SPACING = 8
_GRAPH_TOP = 30 # y position for the graph placement
INFO_FG_COLOR = 0x000080
INFO_BG_COLOR = 0xc0c000
LABEL_COLOR = 0xc0c0c0
© Adafruit Industries https://learn.adafruit.com/clue-sensor-plotter-circuitpython Page 32 of 77
Page 33

def _display_manual(self):
"""Intention was to disable auto_refresh here but this needs a
simple displayio refresh to work well."""
self._output.auto_refresh = True
def _display_auto(self):
self._output.auto_refresh = True
def _display_refresh(self):
"""Intention was to call self._output.refresh() but this does not work well
as current implementation is designed with a fixed frame rate in mind."""
if self._output.auto_refresh:
return True
else:
return True
def __init__(self, output,
style="lines", mode="scroll", scale_mode=None,
screen_width=240, screen_height=240,
plot_width=192, plot_height=201,
x_divs=4, y_divs=4,
scroll_px=50,
max_channels=3,
est_rate=50,
title="",
max_title_len=20,
mu_output=False,
debug=0):
"""scroll_px of greater than 1 gives a jump scroll."""
# pylint: disable=too-many-locals,too-many-statements
self._output = output
self.change_stylemode(style, mode, scale_mode=scale_mode, clear=False)
self._screen_width = screen_width
self._screen_height = screen_height
self._plot_width = plot_width
self._plot_height = plot_height
self._plot_height_m1 = plot_height - 1
self._x_divs = x_divs
self._y_divs = y_divs
self._scroll_px = scroll_px
self._max_channels = max_channels
self._est_rate = est_rate
self._title = title
self._max_title_len = max_title_len
# These arrays are used to provide a circular buffer
# with _data_values valid values - this needs to be sized
# one larger than screen width to retrieve prior y position
# for line undrawing in wrap mode
self._data_size = self._plot_width + 1
self._data_y_pos = []
self._data_value = []
for _ in range(self._max_channels):
# 'i' is 32 bit signed integer
self._data_y_pos.append(array.array('i', [0] * self._data_size))
self._data_value.append(array.array('f', [0.0] * self._data_size))
# begin-keep-pylint-happy
self._data_mins = None
self._data_maxs = None
self._data_stats_maxlen = None
self._data_stats = None
© Adafruit Industries https://learn.adafruit.com/clue-sensor-plotter-circuitpython Page 33 of 77
Page 34

self._values = None
self._data_values = None
self._x_pos = None
self._data_idx = None
self._plot_lastzoom_ns = None
# end-keep-pylint-happy
self._init_data()
self._mu_output = mu_output
self._debug = debug
self._channels = None
self._channel_colidx = []
# The range the data source generates within
self._abs_min = None
self._abs_max = None
# The current plot min/max
self._plot_min = None
self._plot_max = None
self._plot_min_range = None # Used partly to prevent div by zero
self._plot_range_lock = False
self._plot_dirty = False # flag indicate some data has been plotted
self._font = terminalio.FONT
self._y_axis_lab = ""
self._y_lab_width = 6 # maximum characters for y axis label
self._y_lab_color = self.LABEL_COLOR
self._displayio_graph = None
self._displayio_plot = None
self._displayio_title = None
self._displayio_info = None
self._displayio_y_labs = None
self._displayio_y_axis_lab = None
self._last_manual_refresh = None
def _init_data(self, ranges=True):
# Allocate arrays for each possible channel with plot_width elements
self._data_mins = [self.POS_INF]
self._data_maxs = [self.NEG_INF]
self._data_start_ns = [time.monotonic_ns()]
self._data_stats_maxlen = 10
# When in use the arrays in here are variable length
self._data_stats = [[] * self._max_channels]
self._values = 0 # total data processed
self._data_values = 0 # valid elements in data_y_pos and data_value
self._x_pos = 0
self._data_idx = 0
self._plot_lastzoom_ns = 0 # monotonic_ns() for last zoom in
if ranges:
self._plot_min = None
self._plot_max = None
self._plot_min_range = None # Used partly to prevent div by zero
self._plot_dirty = False # flag indicate some data has been plotted
def _recalc_y_pos(self):
"""Recalculates _data_y_pos based on _data_value for changes in y scale."""
# Check if nothing to do - important since _plot_min _plot_max not yet set
© Adafruit Industries https://learn.adafruit.com/clue-sensor-plotter-circuitpython Page 34 of 77
Page 35

if self._data_values == 0:
return
for ch_idx in range(self._channels):
# intentional use of negative array indexing
for data_idx in range(self._data_idx - 1,
self._data_idx - 1 - self._data_values,
-1):
self._data_y_pos[ch_idx][data_idx] = round(mapf(self._data_value[ch_idx][data_idx],
self._plot_min,
self._plot_max,
self._plot_height_m1,
0))
def get_colors(self):
return self._PLOT_COLORS
def clear_all(self, ranges=True):
if self._values != 0:
self._undraw_bitmap()
self._init_data(ranges=ranges)
# Simple implementation here is to clear the screen on change...
def change_stylemode(self, style, mode, scale_mode=None, clear=True):
if style not in ("lines", "dots"):
raise ValueError("style not lines or dots")
if mode not in ("scroll", "wrap"):
raise ValueError("mode not scroll or wrap")
if scale_mode is None:
scale_mode = self._DEFAULT_SCALE_MODE[style]
elif scale_mode not in ("pixel", "onscroll", "screen", "time"):
raise ValueError("scale_mode not pixel, onscroll, screen or time")
# Clearing everything on screen and everything stored in variables
# apart from plot ranges is simplest approach here - clearing
# involves undrawing which uses the self._style so must not change
# that beforehand
if clear:
self.clear_all(ranges=False)
self._style = style
self._mode = mode
self._scale_mode = scale_mode
if self._mode == "wrap":
self._display_auto()
elif self._mode == "scroll":
self._display_manual()
def _make_empty_tg_plot_bitmap(self):
plot_bitmap = displayio.Bitmap(self._plot_width, self._plot_height,
len(self._PLOT_COLORS))
# Create a colour palette for plot dots/lines
plot_palette = displayio.Palette(len(self._PLOT_COLORS))
for idx in range(len(self._PLOT_COLORS)):
plot_palette[idx] = self._PLOT_COLORS[idx]
plot_palette.make_transparent(0)
tg_plot_data = displayio.TileGrid(plot_bitmap,
pixel_shader=plot_palette)
tg_plot_data.x = self._screen_width - self._plot_width - 1
tg_plot_data.y = self._GRAPH_TOP
return (tg_plot_data, plot_bitmap)
© Adafruit Industries https://learn.adafruit.com/clue-sensor-plotter-circuitpython Page 35 of 77
Page 36

def _make_tg_grid(self):
# pylint: disable=too-many-locals
grid_width = self._plot_width
grid_height = self._plot_height_m1
div_width = self._plot_width // self._x_divs
div_height = self._plot_height // self._y_divs
a_plot_grid = displayio.Bitmap(div_width, div_height, 2)
# Grid colours
grid_palette = displayio.Palette(2)
grid_palette.make_transparent(0)
grid_palette[0] = 0x000000
grid_palette[1] = self.GRID_COLOR
# Horizontal line on grid rectangle
for x in range(0, div_width, self.GRID_DOT_SPACING):
a_plot_grid[x, 0] = 1
# Vertical line on grid rectangle
for y in range(0, div_height, self.GRID_DOT_SPACING):
a_plot_grid[0, y] = 1
right_line = displayio.Bitmap(1, grid_height, 2)
tg_right_line = displayio.TileGrid(right_line,
pixel_shader=grid_palette)
for y in range(0, grid_height, self.GRID_DOT_SPACING):
right_line[0, y] = 1
bottom_line = displayio.Bitmap(grid_width + 1, 1, 2)
tg_bottom_line = displayio.TileGrid(bottom_line,
pixel_shader=grid_palette)
for x in range(0, grid_width + 1, self.GRID_DOT_SPACING):
bottom_line[x, 0] = 1
# Create a TileGrid using the Bitmap and Palette
# and tiling it based on number of divisions required
tg_plot_grid = displayio.TileGrid(a_plot_grid,
pixel_shader=grid_palette,
width=self._x_divs,
height=self._y_divs,
default_tile = 0)
tg_plot_grid.x = self._screen_width - self._plot_width - 1
tg_plot_grid.y = self._GRAPH_TOP
tg_right_line.x = tg_plot_grid.x + grid_width
tg_right_line.y = tg_plot_grid.y
tg_bottom_line.x = tg_plot_grid.x
tg_bottom_line.y = tg_plot_grid.y + grid_height
g_plot_grid = displayio.Group(max_size=3)
g_plot_grid.append(tg_plot_grid)
g_plot_grid.append(tg_right_line)
g_plot_grid.append(tg_bottom_line)
return g_plot_grid
def _make_empty_graph(self, tg_and_plot=None):
font_w, font_h = self._font.get_bounding_box()
self._displayio_title = Label(self._font,
text=self._title,
max_glyphs=self._max_title_len,
scale=2,
© Adafruit Industries https://learn.adafruit.com/clue-sensor-plotter-circuitpython Page 36 of 77
Page 37

line_spacing=1,
color=self._y_lab_color)
self._displayio_title.x = self._screen_width - self._plot_width
self._displayio_title.y = font_h // 2
self._displayio_y_axis_lab = Label(self._font,
text=self._y_axis_lab,
max_glyphs=self._y_lab_width,
line_spacing=1,
color=self._y_lab_color)
self._displayio_y_axis_lab.x = 0 # 0 works here because text is ""
self._displayio_y_axis_lab.y = font_h // 2
plot_y_labels = []
# y increases top to bottom of screen
for y_div in range(self._y_divs + 1):
plot_y_labels.append(Label(self._font,
text=" " * self._y_lab_width,
max_glyphs=self._y_lab_width,
line_spacing=1,
color=self._y_lab_color))
plot_y_labels[-1].x = (self._screen_width - self._plot_width
- self._y_lab_width * font_w - 5)
plot_y_labels[-1].y = (round(y_div * self._plot_height / self._y_divs)
+ self._GRAPH_TOP - 1)
self._displayio_y_labs = plot_y_labels
# Three items (grid, axis label, title) plus the y tick labels
g_background = displayio.Group(max_size=3+len(plot_y_labels))
g_background.append(self._make_tg_grid())
for label in self._displayio_y_labs:
g_background.append(label)
g_background.append(self._displayio_y_axis_lab)
g_background.append(self._displayio_title)
if tg_and_plot is not None:
(tg_plot, plot) = tg_and_plot
else:
(tg_plot, plot) = self._make_empty_tg_plot_bitmap()
self._displayio_plot = plot
# Create the main Group for display with one spare slot for
# popup informational text
main_group = displayio.Group(max_size=3)
main_group.append(g_background)
main_group.append(tg_plot)
self._displayio_info = None
return main_group
def set_y_axis_tick_labels(self, y_min, y_max):
px_per_div = (y_max - y_min) / self._y_divs
for idx, tick_label in enumerate(self._displayio_y_labs):
value = y_max - idx * px_per_div
text_value = format_width(self._y_lab_width, value)
tick_label.text = text_value[:self._y_lab_width]
def display_on(self, tg_and_plot=None):
if self._displayio_graph is None:
self._displayio_graph = self._make_empty_graph(tg_and_plot=tg_and_plot)
self._output.show(self._displayio_graph)
© Adafruit Industries https://learn.adafruit.com/clue-sensor-plotter-circuitpython Page 37 of 77
Page 38

def display_off(self):
pass
def _draw_vline(self, x1, y1, y2, colidx):
"""Draw a clipped vertical line at x1 from pixel one along from y1 to y2.
"""
if y2 == y1:
if 0 <= y2 <= self._plot_height_m1:
self._displayio_plot[x1, y2] = colidx
return
# For y2 above y1, on screen this translates to being below
step = 1 if y2 > y1 else -1
for line_y_pos in range(max(0, min(y1 + step, self._plot_height_m1)),
max(0, min(y2, self._plot_height_m1)) + step,
step):
self._displayio_plot[x1, line_y_pos] = colidx
# def _clear_plot_bitmap(self): ### woz here
def _redraw_all_col_idx(self, col_idx_list):
x_cols = min(self._data_values, self._plot_width)
wrapMode = self._mode == "wrap"
if wrapMode:
x_data_idx = (self._data_idx - self._x_pos) % self._data_size
else:
x_data_idx = (self._data_idx - x_cols) % self._data_size
for ch_idx in range(self._channels):
col_idx = col_idx_list[ch_idx]
data_idx = x_data_idx
for x_pos in range(x_cols):
# "jump" the gap in the circular buffer for wrap mode
if wrapMode and x_pos == self._x_pos:
data_idx = (data_idx + self._data_size - self._plot_width) % self._data_size
# ideally this should inhibit lines between wrapped data
y_pos = self._data_y_pos[ch_idx][data_idx]
if self._style == "lines" and x_pos != 0:
# Python supports negative array index
prev_y_pos = self._data_y_pos[ch_idx][data_idx - 1]
self._draw_vline(x_pos, prev_y_pos, y_pos, col_idx)
else:
if 0 <= y_pos <= self._plot_height_m1:
self._displayio_plot[x_pos, y_pos] = col_idx
data_idx += 1
if data_idx >= self._data_size:
data_idx = 0
# This is almost always going to be quicker
# than the slow _clear_plot_bitmap implemented on 5.0.0 displayio
def _undraw_bitmap(self):
if not self._plot_dirty:
return
self._redraw_all_col_idx([self.TRANSPARENT_IDX] * self._channels)
self._plot_dirty = False
def _redraw_all(self):
self._redraw_all_col_idx(self._channel_colidx)
© Adafruit Industries https://learn.adafruit.com/clue-sensor-plotter-circuitpython Page 38 of 77
Page 39

self._plot_dirty = True
def _undraw_column(self, x_pos, data_idx):
"""Undraw a single column at x_pos based on data from data_idx."""
colidx = self.TRANSPARENT_IDX
for ch_idx in range(self._channels):
y_pos = self._data_y_pos[ch_idx][data_idx]
if self._style == "lines" and x_pos != 0:
# Python supports negative array index
prev_y_pos = self._data_y_pos[ch_idx][data_idx - 1]
self._draw_vline(x_pos, prev_y_pos, y_pos, colidx)
else:
if 0 <= y_pos <= self._plot_height_m1:
self._displayio_plot[x_pos, y_pos] = colidx
# very similar code to _undraw_bitmap although that is now
# more sophisticated as it supports wrap mode
def _redraw_for_scroll(self, x1, x2, x1_data_idx):
"""Redraw data from x1 to x2 inclusive for scroll mode only."""
for ch_idx in range(self._channels):
colidx = self._channel_colidx[ch_idx]
data_idx = x1_data_idx
for x_pos in range(x1, x2 + 1):
y_pos = self._data_y_pos[ch_idx][data_idx]
if self._style == "lines" and x_pos != 0:
# Python supports negative array index
prev_y_pos = self._data_y_pos[ch_idx][data_idx - 1]
self._draw_vline(x_pos, prev_y_pos, y_pos, colidx)
else:
if 0 <= y_pos <= self._plot_height_m1:
self._displayio_plot[x_pos, y_pos] = colidx
data_idx += 1
if data_idx >= self._data_size:
data_idx = 0
self._plot_dirty = True
def _update_stats(self, values):
"""Update the statistics for minimum and maximum."""
for idx, value in enumerate(values):
# Occasionally check if we need to add a new bucket to stats
if idx == 0 and self._values & 0xf == 0:
now_ns = time.monotonic_ns()
if now_ns - self._data_start_ns[-1] > 1e9:
self._data_start_ns.append(now_ns)
self._data_mins.append(value)
self._data_maxs.append(value)
# Remove the first elements if too long
if len(self._data_start_ns) > self._data_stats_maxlen:
self._data_start_ns.pop(0)
self._data_mins.pop(0)
self._data_maxs.pop(0)
continue
if value < self._data_mins[-1]:
self._data_mins[-1] = value
if value > self._data_maxs[-1]:
self._data_maxs[-1] = value
def _data_store(self, values):
"""Store the data values in the circular buffer."""
for ch_idx, value in enumerate(values):
© Adafruit Industries https://learn.adafruit.com/clue-sensor-plotter-circuitpython Page 39 of 77
Page 40

self._data_value[ch_idx][self._data_idx] = value
# Increment the data index for circular buffer
self._data_idx += 1
if self._data_idx >= self._data_size:
self._data_idx = 0
def _data_draw(self, values, x_pos, data_idx):
offscale = False
for ch_idx, value in enumerate(values):
# Last two parameters appear "swapped" - this deals with the
# displayio screen y coordinate increasing downwards
y_pos = round(mapf(value,
self._plot_min, self._plot_max,
self._plot_height_m1, 0))
if y_pos < 0 or y_pos >= self._plot_height:
offscale = True
self._data_y_pos[ch_idx][data_idx] = y_pos
if self._style == "lines" and self._x_pos != 0:
# Python supports negative array index
prev_y_pos = self._data_y_pos[ch_idx][data_idx - 1]
self._draw_vline(x_pos, prev_y_pos, y_pos,
self._channel_colidx[ch_idx])
self._plot_dirty = True # bit wrong if whole line is off screen
else:
if not offscale:
self._displayio_plot[x_pos, y_pos] = self._channel_colidx[ch_idx]
self._plot_dirty = True
def _check_zoom_in(self):
"""Check if recent data warrants zooming in on y axis scale based on checking
minimum and maximum times which are recorded in approximate 1 second buckets.
Returns two element tuple with (min, max) or empty tuple for no zoom required.
Caution is required with min == max."""
start_idx = len(self._data_start_ns) - self.ZOOM_IN_TIME
if start_idx < 0:
return ()
now_ns = time.monotonic_ns()
if now_ns < self._plot_lastzoom_ns + self.ZOOM_IN_CHECK_TIME_NS:
return ()
recent_min = min(self._data_mins[start_idx:])
recent_max = max(self._data_maxs[start_idx:])
recent_range = recent_max - recent_min
headroom = recent_range * self.ZOOM_HEADROOM
# No zoom if the range of data is near the plot range
if (self._plot_min > recent_min - headroom
and self._plot_max < recent_max + headroom):
return ()
new_plot_min = max(recent_min - headroom, self._abs_min)
new_plot_max = min(recent_max + headroom, self._abs_max)
return (new_plot_min, new_plot_max)
def _auto_plot_range(self, redraw_plot=True):
"""Check if we need to zoom out or in based on checking historical
data values unless y_range_lock has been set.
"""
© Adafruit Industries https://learn.adafruit.com/clue-sensor-plotter-circuitpython Page 40 of 77
Page 41

"""
if self._plot_range_lock:
return False
zoom_in = False
zoom_out = False
# Calcuate some new min/max values based on recentish data
# and add some headroom
y_min = min(self._data_mins)
y_max = max(self._data_maxs)
y_range = y_max - y_min
headroom = y_range * self.ZOOM_HEADROOM
new_plot_min = max(y_min - headroom, self._abs_min)
new_plot_max = min(y_max + headroom, self._abs_max)
# set new range if the data does not fit on the screen
# this will also redo y tick labels if necessary
if (new_plot_min < self._plot_min or new_plot_max > self._plot_max):
if self._debug >= 2:
print("Zoom out")
self._change_y_range(new_plot_min, new_plot_max,
redraw_plot=redraw_plot)
zoom_out = True
else: # otherwise check if zoom in is warranted
rescale_zoom_range = self._check_zoom_in()
if rescale_zoom_range:
if self._debug >= 2:
print("Zoom in")
self._change_y_range(rescale_zoom_range[0], rescale_zoom_range[1],
redraw_plot=redraw_plot)
zoom_in = True
if zoom_in or zoom_out:
self._plot_lastzoom_ns = time.monotonic_ns()
return True
return False
def data_add(self, values):
# pylint: disable=too-many-branches
changed = False
data_idx = self._data_idx
x_pos = self._x_pos
self._update_stats(values)
if self._mode == "wrap":
if self._x_pos == 0 or self._scale_mode == "pixel":
changed = self._auto_plot_range(redraw_plot=False)
# Undraw any previous data at current x position
if (not changed and self._data_values >= self._plot_width
and self._values >= self._plot_width):
self._undraw_column(self._x_pos, data_idx - self._plot_width)
elif self._mode == "scroll":
if x_pos >= self._plot_width: # Fallen off x axis range?
changed = self._auto_plot_range(redraw_plot=False)
if not changed:
self._undraw_bitmap() # Need to cls for the scroll
sc_data_idx = ((data_idx + self._scroll_px - self._plot_width)
% self._data_size)
self._data_values -= self._scroll_px
© Adafruit Industries https://learn.adafruit.com/clue-sensor-plotter-circuitpython Page 41 of 77
Page 42

self._redraw_for_scroll(0,
self._plot_width - 1 - self._scroll_px,
sc_data_idx)
x_pos = self._plot_width - self._scroll_px
elif self._scale_mode == "pixel":
changed = self._auto_plot_range(redraw_plot=True)
# Draw the new data
self._data_draw(values, x_pos, data_idx)
# Store the new values in circular buffer
self._data_store(values)
# increment x position dealing with wrap/scroll
new_x_pos = x_pos + 1
if new_x_pos >= self._plot_width:
# fallen off edge so wrap or leave position
# on last column for scroll
if self._mode == "wrap":
self._x_pos = 0
else:
self._x_pos = new_x_pos # this is off screen
else:
self._x_pos = new_x_pos
if self._data_values < self._data_size:
self._data_values += 1
self._values += 1
if self._mu_output:
print(values)
# scrolling mode has automatic refresh in background turned off
if self._mode == "scroll":
self._display_refresh()
def _change_y_range(self, new_plot_min, new_plot_max, redraw_plot=True):
y_min = new_plot_min
y_max = new_plot_max
if self._debug >= 2:
print("Change Y range", new_plot_min, new_plot_max, redraw_plot)
# if values reduce range below the minimum then widen the range
# but keep it within the absolute min/max values
if self._plot_min_range is not None:
range_extend = self._plot_min_range - (y_max - y_min)
if range_extend > 0:
y_max += range_extend / 2
y_min -= range_extend / 2
if y_min < self._abs_min:
y_min = self._abs_min
y_max = y_min + self._plot_min_range
elif y_max > self._abs_max:
y_max = self._abs_max
y_min = y_max - self._plot_min_range
self._plot_min = y_min
self._plot_max = y_max
self.set_y_axis_tick_labels(self._plot_min, self._plot_max)
if self._values:
© Adafruit Industries https://learn.adafruit.com/clue-sensor-plotter-circuitpython Page 42 of 77
Page 43

self._undraw_bitmap()
self._recalc_y_pos() ## calculates new y positions
if redraw_plot:
self._redraw_all()
@property
def title(self):
return self._title
@title.setter
def title(self, value):
self._title = value[:self._max_title_len] # does not show truncation
self._displayio_title.text = self._title
@property
def info(self):
if self._displayio_info is None:
return None
return self._displayio_info.text
@info.setter
def info(self, value):
"""Place some text on the screen.
Multiple lines are supported with newline character.
Font will be 3x standard terminalio font or 2x if that does not fit."""
if self._displayio_info is not None:
self._displayio_graph.pop()
if value is not None and value != "":
font_scale = 3
line_spacing = 1.25
font_w, font_h = self._font.get_bounding_box()
text_lines = value.split("\n")
max_word_chars = max([len(word) for word in text_lines])
# If too large reduce the scale
if (max_word_chars * font_scale * font_w > self._screen_width
or len(text_lines) * font_scale * font_h * line_spacing > self._screen_height):
font_scale -= 1
self._displayio_info = Label(self._font, text=value,
line_spacing=line_spacing,
scale=font_scale,
background_color=None,
color=self.INFO_BG_COLOR)
self._displayio_info.palette[0] = self.INFO_FG_COLOR
self._displayio_info.palette.make_opaque(0)
# centre the (left justified) text
self._displayio_info.x = (self._screen_width
- font_scale * font_w * max_word_chars) // 2
self._displayio_info.y = self._screen_height // 2
self._displayio_graph.append(self._displayio_info)
else:
self._displayio_info = None
if self._mode == "scroll":
self._display_refresh()
@property
def channels(self):
return self._channels
© Adafruit Industries https://learn.adafruit.com/clue-sensor-plotter-circuitpython Page 43 of 77
Page 44

@channels.setter
def channels(self, value):
if value > self._max_channels:
raise ValueError("Exceeds max_channels")
self._channels = value
@property
def y_range(self):
return (self._plot_min, self._plot_max)
@y_range.setter
def y_range(self, minmax):
if minmax[0] != self._plot_min or minmax[1] != self._plot_max:
self._change_y_range(minmax[0], minmax[1], redraw_plot=True)
@property
def y_full_range(self):
return (self._plot_min, self._plot_max)
@y_full_range.setter
def y_full_range(self, minmax):
self._abs_min = minmax[0]
self._abs_max = minmax[1]
@property
def y_min_range(self):
return self._plot_min_range
@y_min_range.setter
def y_min_range(self, value):
self._plot_min_range = value
@property
def y_axis_lab(self):
return self._y_axis_lab
@y_axis_lab.setter
def y_axis_lab(self, text):
self._y_axis_lab = text[:self._y_lab_width]
font_w, _ = self._font.get_bounding_box()
x_pos = (40 - font_w * len(self._y_axis_lab)) // 2
# max() used to prevent negative (off-screen) values
self._displayio_y_axis_lab.x = max(0, x_pos)
self._displayio_y_axis_lab.text = self._y_axis_lab
@property
def channel_colidx(self):
return self._channel_colidx
@channel_colidx.setter
def channel_colidx(self, value):
# tuple() ensures object has a local / read-only copy of data
self._channel_colidx = tuple(value)
@property
def mu_output(self):
return self._mu_output
@mu_output.setter
def mu_output(self, value):
self._mu_output = value
@property
© Adafruit Industries https://learn.adafruit.com/clue-sensor-plotter-circuitpython Page 44 of 77
Page 45

def y_range_lock(self):
return self._plot_range_lock
@y_range_lock.setter
def y_range_lock(self, value):
self._plot_range_lock = value
Code Discussion
The Design (https://adafru.it/KaZ) section covers a lot of aspects of the program. A few interesting parts of
the implementation are discussed here.
IlluminatedColorPlotSource class
This has the two required methods, the constructor and data() . It also implements two optional methods:
start() to set the gain and duration parameters on the colour sensor and turn on the white LEDs.
stop() to turn off the white LEDs.
© Adafruit Industries https://learn.adafruit.com/clue-sensor-plotter-circuitpython Page 45 of 77
Page 46

class IlluminatedColorPlotSource(PlotSource):
def __init__(self, my_clue, mode="Clear"):
self._clue = my_clue
col_fl_lc = mode[0].lower()
if col_fl_lc == "r":
plot_colour = self.RGB_COLORS[0]
elif col_fl_lc == "g":
plot_colour = self.RGB_COLORS[1]
elif col_fl_lc == "b":
plot_colour = self.RGB_COLORS[2]
elif col_fl_lc == "c":
plot_colour = self.DEFAULT_COLORS[0]
else:
raise ValueError("Colour must be Red, Green, Blue or Clear")
self._channel = col_fl_lc
super().__init__(1, "Illum. color: " + self._channel.upper(),
abs_min=0, abs_max=8000,
initial_min=0, initial_max=2000,
colors=(plot_colour,),
rate=50)
def data(self):
(r, g, b, c) = self._clue.color
if self._channel == "r":
return r
elif self._channel == "g":
return g
elif self._channel == "b":
return b
elif self._channel == "c":
return c
else:
return None # This should never happen
def start(self):
# Set APDS9960 to sample every (256 - 249 ) * 2.78 = 19.46ms
# pylint: disable=protected-access
self._clue._sensor.integration_time = 249 # 19.46ms, ~ 50Hz
self._clue._sensor.color_gain = 0x03 # 64x (library default is 4x)
self._clue.white_leds = True
def stop(self):
self._clue.white_leds = False
The constructor configures the object to select the appropriate value from the colour sensor. It is intended
to accept Red , Green , Blue or Clear but will accept red and rouge as it is only checking the lowercase
first character. This could be viewed as an inappropriate application of the robustness
principle (https://adafru.it/K9C).
The full range of the sensor data is hard-coded in the constructor as 0 and 8000 . This is based on
observations
of the data reaching 7169 , 8000 gives nicer values on the y axis tick labels. It's better to
retrieve this value programmatically, if it's available, and verify that value against the manufacturer's data
sheet.
The clue object does not have a property, public method or public variable to access the sensor to set
integration_time and color_gain . The single underscore prefix on the _sensor instance variable indicates
© Adafruit Industries https://learn.adafruit.com/clue-sensor-plotter-circuitpython Page 46 of 77
Page 47

that it is intended only for the class itself to access but Python does not enforce this. This allows static
code analyzers like pylint to detect misuse. In this case, the minor misuse is acknowledged with a pylint
disable pragma (https://adafru.it/K9D) which inhibits the warning. For critical applications this would be
inappropriate as it is breaking the object's encapsulation (https://adafru.it/K9E) and makes the application
vulnerable in possibly disastrous ways to future changes in the class.
Units and Interfaces
The setting of integration_time in ColorPlotSource and IlluminatedColorPlotSource uses an obscure,
manufacturer-specific formula for the actual time not described in the underlying library
documentation (https://adafru.it/K9F). This is confusing for a programmer who has previously used the
Arduino library which uses milliseconds (https://adafru.it/Ka0) as units. Changing the CircuitPython library
integration_time would require a coordinated and synchronised change with every application which uses
the library. This is generally impractical.
The gyro value retrieved in GyroPlotSource is documented (https://adafru.it/Ka-) as being measured in
degrees per second and tests confirm this. The design guide for CircuitPython's libraries lists
gyro (https://adafru.it/xXd) with a type of (float, float, float) and units of "x, y, z radians per second". This
presents the same problem as the previous case as a change will have impact to many existing users.
These two examples highlight the importance of thoughtful design and review of interfaces.
Setting Properties and Pass by ...
Python has a feature called properties (https://adafru.it/Bt1) which is often used in classes to create things
which appear to be instance variables but actually execute code when they are read (get) or assigned to
(set). The classic example below features a pair of getter and setter (https://adafru.it/Ka1) methods with
decorators (https://adafru.it/Fl6).
@property
def channel_colidx(self):
return self._channel_colidx
@channel_colidx.setter
def channel_colidx(self, value):
# tuple() ensures object has a local / read-only copy of data
self._channel_colidx = tuple(value)
The comment is already explaining a subtlety here of using the passed value . The value is intended to be
a sequence (https://adafru.it/BNw). If a list is passed the the caller part of the program can
modify
the list
stored in the class as it is passed by reference (https://adafru.it/Ka2). For comparison, if the value had
been an int this would not be possible as it is passed by value. This is shown on REPL below with a similar
example.
© Adafruit Industries https://learn.adafruit.com/clue-sensor-plotter-circuitpython Page 47 of 77
Page 48

>>> class class_storing_sequence():
... def __init__(self, a_sequence):
... self._a_sequence = a_sequence
... self._a_sequence_copy = tuple(a_sequence)
...
>>> words = ["pass", "by"]
>>> obj = class_storing_sequence(words)
>>> words.extend(["object", "reference"])
>>> obj._a_sequence
['pass', 'by', 'object', 'reference']
>>> obj._a_sequence_copy
('pass', 'by')
An even more confusing permutation would be another part of the program retrieving the channel_colidx
list and intentionally or unintentionally modifying it. This could cause tricky-to-find bugs. The cautious use
of tuple() in channel_colidx(self, value) creates an independent copy of the sequence. The use of tuple()
rather than list() is very intentional as this makes it
read-only
due to Python tuples being
immutable (https://adafru.it/Ka3).
The general issue is described and discussed in detail in Robert Heaton's blog post: Is Python pass-by-
reference or pass-by-value? (https://adafru.it/Ka4)
© Adafruit Industries https://learn.adafruit.com/clue-sensor-plotter-circuitpython Page 48 of 77
Page 49

Signal/Colour Generator
A Feather M4 Express (https://adafru.it/CJN) board was enlisted to aid the demonstration of the sensor
plotter in the video on the previous page. It provided:
alternating red, green blue light from the onboard NeoPixel for the CLUE's APDS-9960 colour
sensor;
two analogue signals from A0 and A1 which were connected to the #0 and #1 pads on the CLUE
using some test hooks.
Its SAMD51 (M4) processor is useful here as it has 2 DACs.
The code running on the board was very short and simply typed in over the serial console on
CircuitPython's REPL.
© Adafruit Industries https://learn.adafruit.com/clue-sensor-plotter-circuitpython Page 49 of 77
Page 50
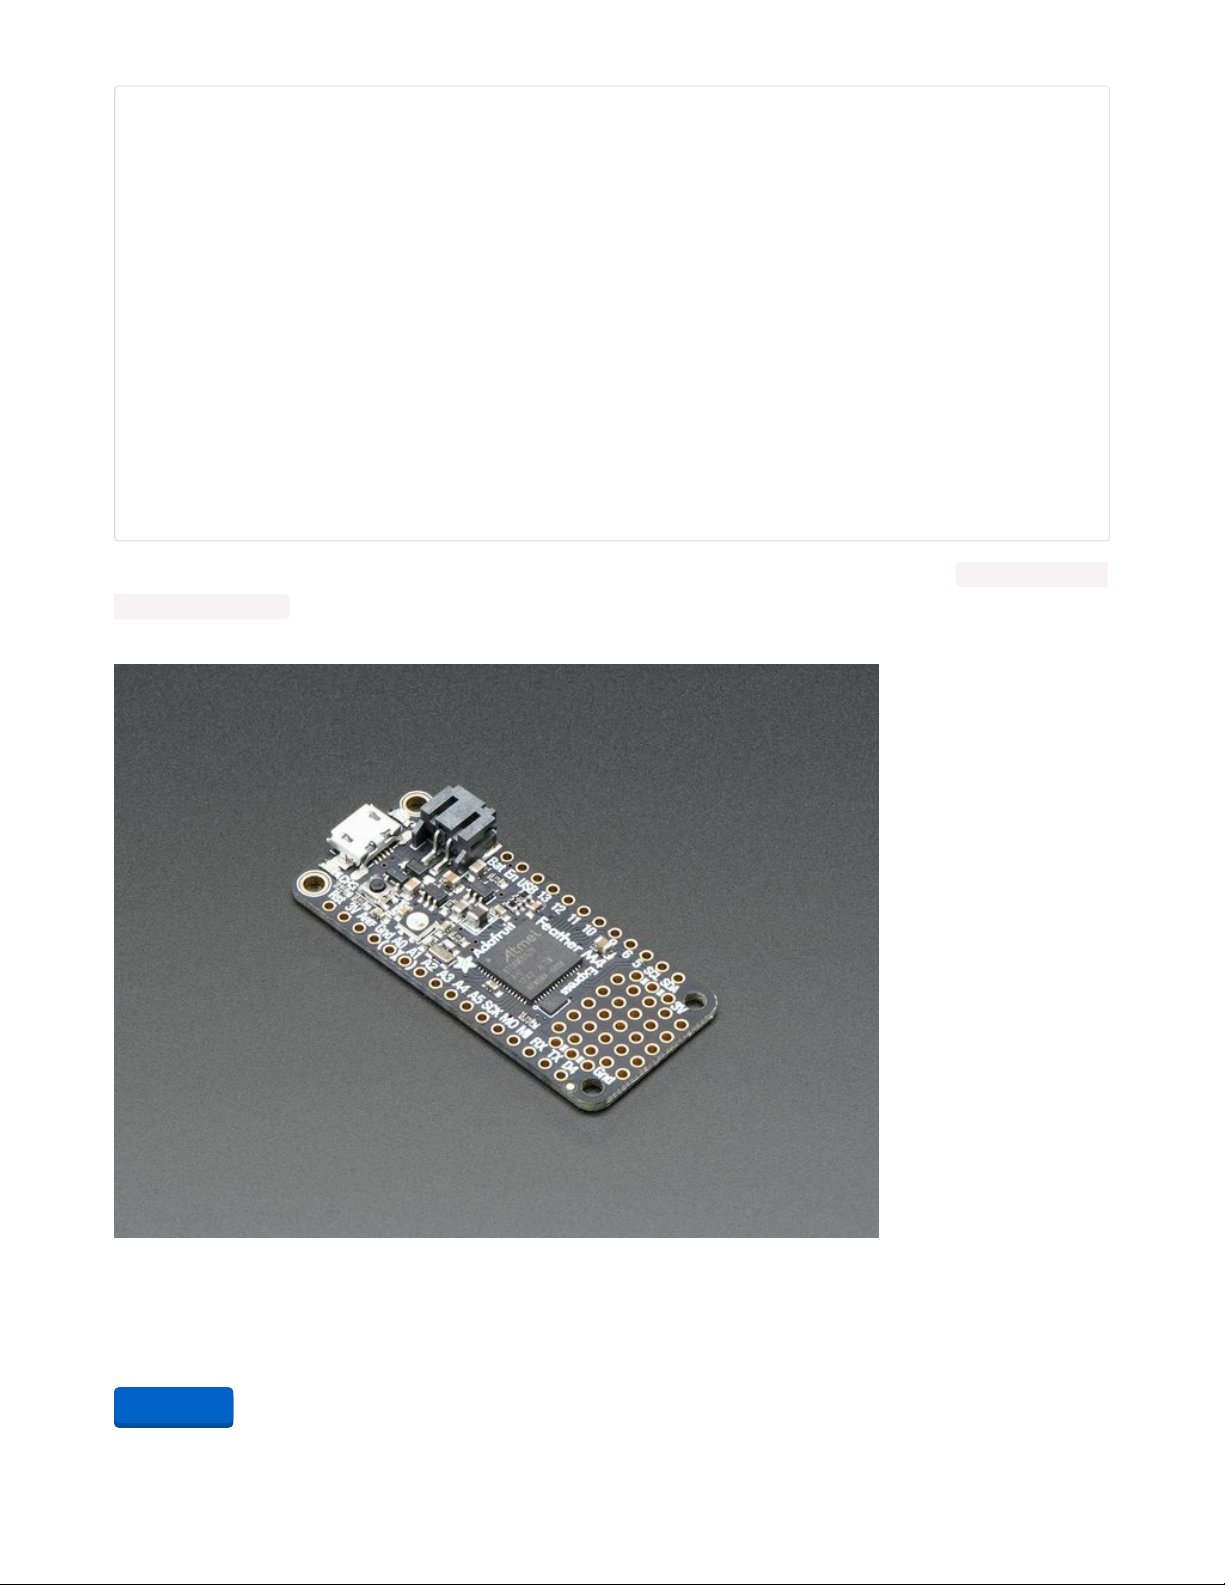
import audioio, audiocore, board, neopixel, time
dacpair = audioio.AudioOut(board.A0,
right_channel=board.A1)
filename = "adafruit-spinning-logo-plot-2chan.wav"
wav_file = open(filename, "rb")
samples = audiocore.WaveFile(wav_file)
samples.sample_rate = 500
dacpair.play(samples, loop=True)
pixel = neopixel.NeoPixel(board.NEOPIXEL, 1)
# Loop forever showing r, g, b while the
# DACs continue to loop the samples from wav file
while True:
pixel[0] = (255, 0, 0) # red
time.sleep(0.5)
pixel[0] = (0, 255, 0) # green
time.sleep(0.5)
pixel[0] = (0, 0, 255) # blue
time.sleep(0.5)
Wav files are typically used for audio but they can be used for any signal. In this case the adafruit-spinning-
logo-plot-2chan.wav has two signals following the top and bottom outline of the Adafruit logo, spinning
1/5th of a revolution in total across five frames.
Adafruit Feather M4 Express - Featuring ATSAMD51
It's what you've been waiting for, the Feather M4 Express featuring ATSAMD51. This Feather is fast like a
swift, smart like an owl, strong like a ox-bird (it's half ox,...
$22.95
In Stock
Add to Cart
© Adafruit Industries https://learn.adafruit.com/clue-sensor-plotter-circuitpython Page 50 of 77
Page 51

Basic Multi-Color Micro SMT Test Hooks (6-pack)
Testing and debugging is a challenging step in board manufacturing. It can be super tricky on a fully
populated PCB. So how can you test connections when you have an assortment of...
$3.50
In Stock
Add to Cart
© Adafruit Industries https://learn.adafruit.com/clue-sensor-plotter-circuitpython Page 51 of 77
Page 52

Sensors
The sensor plotter shows some of the characteristics of the sensors. A few are highlighted here.
Temperature
The temperature on the CLUE board appears to over-read. This is likely to be from the electronics on the
board heating the sensor. The graph below shows a value around 30.8C for a room at 23C.
The graph clearly shows the temperature readings are not constant and have a distinctive pattern not
representative of (random) noise. This screenshot was taken with the program in scrolling mode where it
scrolls in jumps of one division. That scroll takes a few hundred milliseconds. It's possible that when the
© Adafruit Industries https://learn.adafruit.com/clue-sensor-plotter-circuitpython Page 52 of 77
Page 53

sensor is not being read it cools down a tiny amount but more research is required here.
Pressure
The pressure is surprisingly accurate in matching local meteorological observations (adjusted for height
difference). This may vary per device. The relative pressure change for changes in altitude are capable of
measuring changes of a few feet. There is some noise on the sensor visible in the video below. If the
vertical movements are known to be slow then filtering could be used to improve the accuracy.
Humidity
Unlike a traditional wet-bulb thermometer (https://adafru.it/Kae) the humidity sensor responds very rapidly
to changes in humidity. It responds sub-second and can easily detect human breath nearby. In some
circumstances this might be a disadvantage - careful sampling and filtering might be required to ensure a
value is achieved that truly represents the local atmosphere.
Volume
The volume is calculated from samples taken from a microphone on the board. This means it will pick up
physical shocks to the board like button presses. These spikes can cause the auto-ranging to expand too
much.
Colour Sensitivity
The colour sensitivity is a bit surprising. The NeoPixel on a Feather M4 Express was used to test the red,
green and blue plotting. The blue is clearly the highest of the three despite the green appearing to be the
brightest to the human eye. Some ambient light was present but this plus the cross-sensitivity can be seen
on the plot - these are not factors here.
The APDS-9960 datasheet has a graph showing the sensitivity of the different colour sensors but this
seems to run counter to what is observed.
© Adafruit Industries https://learn.adafruit.com/clue-sensor-plotter-circuitpython Page 53 of 77
Page 54

Proximity
The proximity sensor is based on a simple value derived from measuring the infrared light reflected from
the object illuminated by its 950nm IR LED. This will vary depending on the infrared reflectance of the
object so cannot be considered to be an absolute measure of inverse distance. For example, a matte
black, plastic USB connector only registers a maximum proximity of 40. The absolute maximum is 255.
Magnetometer
The magnetometer plots on the two CLUE boards used during development of the sensor plotter showed
very different values. In the absence of any strong magnetic fields the sensor picks up the Earth's
magentic field, therefore the boards must be in the same
position
and
orientation
for a valid comparison. A
pair of representative samples were:
CLUE 1: (-11.1371, -7.04472, 40.2952) ,
CLUE 2: (-46.5653, 20.8272, 21.2803) .
Magnetometer sensors are well-known for their need to be calibrated. This non-trivial process is
described in Adafruit SensorLab - Magnetometer Calibration (https://adafru.it/Kka).
A set of sample readings for two (uncalibrated) CLUE boards are shown below, comparing the values from
the Earth's field and that from a small neodymium magnet (https://adafru.it/Kkb) placed 8cm away.
© Adafruit Industries https://learn.adafruit.com/clue-sensor-plotter-circuitpython Page 54 of 77
Page 55

© Adafruit Industries https://learn.adafruit.com/clue-sensor-plotter-circuitpython Page 55 of 77
Page 56

Testing
The essence of the diagram is testing small parts of the code in isolation and gradually assembling them
into increasingly larger components until the application runs in a environment representative of how it
will be used for real for the integration tests.
Testing can also be segmented into:
tests which check whether the application meets the requirements of the users and
tests which look for defects.
The latter often use unusual, boundary (https://adafru.it/Kaf) or erroneous inputs to check the behaviour is
still acceptable.
Acceptance testing differs in that the participants are either the final users or a proxy for them. There may
also be other groups of users like alpha (https://adafru.it/Kag) and beta testers. Microsoft's Windows
Insider (https://adafru.it/Kah) program and "early access" (https://adafru.it/Kai) in certain parts of the video
games industry are variants on this.
TemperaturePlotSource class
The code below is the TemperaturePlotSource class. Objects are created in Python with the __init__(self)
method. The current program only creates one object for Celsius and another for Fahrenheit leaving the
conversion to Kelvin
unused.
The code looks reasonable at a quick glance.
© Adafruit Industries https://learn.adafruit.com/clue-sensor-plotter-circuitpython Page 56 of 77
Page 57

class TemperaturePlotSource(PlotSource):
def _convert(self, value):
return value * self._scale + self._offset
def __init__(self, my_clue, mode="Celsius"):
self._clue = my_clue
range_min = 0.8
if mode[0].lower() == "f":
mode_name = "Fahrenheit"
self._scale = 1.8
self._offset = 32.0
range_min = 1.6
elif mode[0].lower == "k":
mode_name = "Kelvin"
self._scale = 1.0
self._offset = -273.15
else:
mode_name = "Celsius"
self._scale = 1.0
self._offset = 0.0
super().__init__(1, "Temperature",
units=mode_name[0],
abs_min=self._convert(-40),
abs_max=self._convert(85),
initial_min=self._convert(10),
initial_max=self._convert(40),
range_min=range_min,
rate=24)
def data(self):
return self._convert(self._clue.temperature)
Code Review
In this case, the code below is simple enough to mentally check the output from _convert() and data() . A
close inspection reveals a difference in the way lower is being used. A code review (https://adafru.it/Kaj) is
one way to discover bugs where another person checks the code. This is a very effective technique if the
reviewer has sufficient review time, authority to reject the code and joint liability for the code.
The current program only creates one object for Celsius and another for Fahrenheit leaving the
conversion to Kelvin unused. The CGP GCSE OCR Computer Science Revision Guide
Book (https://adafru.it/Kak) covers test plans and states:
A test plan will outline exactly what you're going to test and how you're going
to test it. It should cover all the possible paths through a program.
A human tester cannot test the Kelvin code with the program as it stands. A programmatic approach to this
is to write some code which tests this small piece of code in isolation. This is referred to as unit
testing (https://adafru.it/Kal). The percentage of paths tested is known as code
coverage (https://adafru.it/Kam) and can be reported by software tools.
© Adafruit Industries https://learn.adafruit.com/clue-sensor-plotter-circuitpython Page 57 of 77
Page 58

Unit Testing
The unit test framework is not supported by CircuitPython but the code has excellent compatibility with
Python allowing the tests to be executed on another computer and making that testing highly equivalent.
The same physical temperature sensor is unlikely to be present on another computer but this is not really
a disadvantage as the real sensor gives an unpredictable temperature and one that probably lies in a very
limited range most of the time.
Mocking
The sensor can be
emulated
in code for testing - this technique is referred to as
mocking (https://adafru.it/Kan). Python has a mock object library (https://adafru.it/Kao) which helps to do
this.
The following pages explore using these techniques to find bugs in the code above.
© Adafruit Industries https://learn.adafruit.com/clue-sensor-plotter-circuitpython Page 58 of 77
Page 59

Bug 1
Tests using the unittest.mock framework (https://adafru.it/Kap) have a lot of test_ prefixes: methods are
prefixed with test_ , classes are prefixed with Test_ and they are stored in files with filenames prefixed
with test_ .
Finding the Bug
The unit test below shows a simple test of a TemperaturePlotSource object created in Kelvin mode and
tested with values starting at 20 degrees Celsius which would equate to 293.15 K.
© Adafruit Industries https://learn.adafruit.com/clue-sensor-plotter-circuitpython Page 59 of 77
Page 60

# an excerpt from Test_TemperaturePlotSource class
SENSOR_DATA = (20, 21.3, 22.0, 0.0, -40, 85)
def test_kelvin(self):
"""Create the source in Kelvin mode and test with some values."""
# Emulate the clue's temperature sensor by
# returning a temperature from a small tuple
# of test data
mocked_clue = Mock()
expected_data = (293.15, 294.45, 295.15,
273.15, 233.15, 358.15)
type(mocked_clue).temperature = PropertyMock(side_effect=self.SENSOR_DATA)
source = TemperaturePlotSource(mocked_clue,
mode="Kelvin")
for expected_value in expected_data:
data = source.data()
# self.assertEqual(data,
# expected_value,
# msg="An inappropriate check for floating-point")
self.assertAlmostEqual(data,
expected_value,
msg="Checking converted temperature is correct")
There are three tests in a Test_TemperaturePlotSource class. Python on a desktop computer (or Raspberry
Pi) can execute these. One run is shown below.
$ python tests/test_PlotSource.py
test_celsius (__main__.Test_TemperaturePlotSource)
Create the source in Celsius mode and test with some values. ... ok
test_fahrenheit (__main__.Test_TemperaturePlotSource)
Create the source in Fahrenheit mode and test with some values. ... ok
test_kelvin (__main__.Test_TemperaturePlotSource)
Create the source in Kelvin mode and test with some values. ... FAIL
======================================================================
FAIL: test_kelvin (__main__.Test_TemperaturePlotSource)
Create the source in Kelvin mode and test with some values.
---------------------------------------------------------------------Traceback (most recent call last):
File "tests/test_PlotSource.py", line 101, in test_kelvin
msg="Checking converted temperature is correct")
AssertionError: 20.0 != 293.15 within 7 places : Checking converted temperature is correct
---------------------------------------------------------------------Ran 3 tests in 0.002s
FAILED (failures=1)
The Celsius and Fahrenheit tests are fine ( ok output) but the Kelvin one is failing. The failure is reported
with the value from the first comparison. For some reason, the value 20.0 is being returned when we
expect 293.15 ,
no conversion is taking place
and the value has been left in Celsius for some reason.
© Adafruit Industries https://learn.adafruit.com/clue-sensor-plotter-circuitpython Page 60 of 77
Page 61
A previous code inspection showed an anomaly with the use of lower() vs lower . CircuitPython's REPL
allows us to explore this interactively on the command line, using the CLUE board.
The
absence
of the round brackets on the end of the lower method call introduces a critical flaw into the
code. CircuitPython is somehow comparing a method call with a string. This "chalk and cheese"
comparison is very unfortunate here!
Adafruit CircuitPython 5.0.0 on 2020-03-02; Adafruit CLUE nRF52840 Express with nRF52840
>>> mode="Kelvin"
>>> mode[0].lower == "k"
False
>>> mode[0].lower == "K"
False
>>> mode[0]
'K'
>>> mode[0].lower
<bound_method>
>>> mode[0].lower() == "k"
True
Python is often referred to as strongly (https://adafru.it/Kaq) and dynamically (https://adafru.it/Kar)-typed
but an equality test using == will compare anything against anything - if they are not equivalent in some
way then it will evaluate as False .
For comparison, this is the approximate equivalent in C++ using a different member
function (https://adafru.it/IkD) (C++ terminology for a method) called front .
© Adafruit Industries https://learn.adafruit.com/clue-sensor-plotter-circuitpython Page 61 of 77
Page 62

std::string Family("Coronaviridae");
if (Family.front() == 'N') {
std::cout << "Starts with N" << std::endl;
} else if (Family.front == 'C') {
std::cout << "Starts with C" << std::endl;
}
The compilation aborts with an error because the types cannot be legitimately compared using the C++
type system. The relative strength of type systems is a subjective topic and can vary in practical terms
based on how a language is used.
$ g++ -std=c++11 -o type-demonstration type-demonstration.cpp type-demonstration.cpp: In function ‘int main(int
, char**)’:
type-demonstration.cpp:15:30: error: invalid operands of types ‘<unresolved overloaded function type>’ and ‘char’ t
o binary ‘operator==’
} else if (Family.front == 'C') {
^
A language which checks types at compile-time is referred to as statically (https://adafru.it/Kar)-typed.
Sometimes other software tools can help find likely bugs. In this case pylint (https://adafru.it/BI5) has some
ability to find dubious comparisons but it needs to be able to determine the type accurately and this
prevents it from finding this particular bug. The simpler case is shown below where pylint presents a
warning ( W in W0143 ) about a possible mistake by the programmer.
STRING = "HELLO"
if STRING[0].lower == "h": # not what programmer intended!
print("Found an h or an H") # won't even be executed
$ pylint check_pylint_comparison_with_callable.py
************* Module check_pylint_comparison_with_callable
check_pylint_comparison_with_callable.py:4:3: W0143: Comparing against a callable, did you omit the parenthesis? (c
omparison-with-callable)
Fixing the Bug
Adding the missing () is all that's required but the test still fails. The error message has changed.
AssertionError: -253.14999999999998 != 293.15 within 7 places : Checking converted temperature is correct
© Adafruit Industries https://learn.adafruit.com/clue-sensor-plotter-circuitpython Page 62 of 77
Page 63

Bug 2
More Than One Bug
The second bug is easier to find and understand. The error message shows the number is being
converted but is wildy wrong. The Kelvin scale starts at absolute zero (https://adafru.it/Kas) so cannot be
negative!
$ python tests/test_PlotSource.py Test_TemperaturePlotSource.test_kelvin
test_kelvin (__main__.Test_TemperaturePlotSource)
Create the source in Kelvin mode and test with some values. ... FAIL
======================================================================
FAIL: test_kelvin (__main__.Test_TemperaturePlotSource)
Create the source in Kelvin mode and test with some values.
---------------------------------------------------------------------Traceback (most recent call last):
File "tests/test_PlotSource.py", line 101, in test_kelvin
msg="Checking converted temperature is correct")
AssertionError: -253.14999999999998 != 293.15 within 7 places : Checking converted temperature is correct
---------------------------------------------------------------------Ran 1 test in 0.001s
FAILED (failures=1)
In this case the programmer's mistake can be seen by looking at the:
calculation ( value * self._scale + self._offset) and
the values used in it ( self._scale = 1.0 and self._offset = -273.15 ).
The offset has the wrong sign, it should be a positive value. Once fixed, the tests can all be re-executed to
check this fix.
© Adafruit Industries https://learn.adafruit.com/clue-sensor-plotter-circuitpython Page 63 of 77
Page 64

$ python tests/test_PlotSource.py
test_celsius (__main__.Test_TemperaturePlotSource)
Create the source in Celsius mode and test with some values. ... ok
test_fahrenheit (__main__.Test_TemperaturePlotSource)
Create the source in Fahrenheit mode and test with some values. ... ok
test_kelvin (__main__.Test_TemperaturePlotSource)
Create the source in Kelvin mode and test with some values. ... ok
---------------------------------------------------------------------Ran 3 tests in 0.002s
OK
These tests were written after the code was created to test some code which had not been exercised by
the sensor plotter program. Some other more complex tests were also written to help understand some
bugs in the more complex Plotter class and prevent regressions (https://adafru.it/Kat). A slightly different
software engineering (https://adafru.it/Kau) approach is to write the tests
before
the code - this is known as
test-driven development (TDD) (https://adafru.it/Kav).
Once tests have been created they can also be integrated into the development and deployment
processes. Continuous integration (https://adafru.it/fuO) is one way to execute them, often as a quality
gate.
The full set of tests can be viewed on GitHub (https://adafru.it/Kaw).
© Adafruit Industries https://learn.adafruit.com/clue-sensor-plotter-circuitpython Page 64 of 77
Page 65

Number Representation
The previous pages feature two interesting examples of the care that's required with numbers in a
computer language.
1. The unit test uses the peculiar sounding assertAlmostEqual method.
2. One of the interim test failures reported a number as -253.14999999999998 where the buggy code
would be expected to produce -253.15 .
It's very common for languages to use data types to represent numbers which have a
fixed size
. For an
integer this limits the range of numbers. For a real number which are typically represented in floating-
point (https://adafru.it/Kax) form this limits the precision and range. The example below shows how 6.25 is
represented exactly in floating-point - the relatively uncommon half precision (FP16) (https://adafru.it/KbP)
format is used for brevity.
© Adafruit Industries https://learn.adafruit.com/clue-sensor-plotter-circuitpython Page 65 of 77
Page 66

Binary computers using the ubiquitous IEEE 754 (https://adafru.it/IhB) standard cannot represent 253.15
exactly in the same way that 1/3 cannot be represented exactly as a decimal number. These miniscule
errors are often compounded and enlarged by repeated or large calculations.
The assertAlmostEqual() (https://adafru.it/Kay) method is specifically for floating-point comparisons where
the equivalence test needs to take into account the precision limitations of floating-point arithmetic. The
assertEqual() (https://adafru.it/Kb4) method could be used with the correct, exact number produced by the
computer's arithmetic but this is too fragile as a change in
calculation order,
rounding mode or
intermediate precision
may alter the resulting number.
Python 3
Python hides the detail of the number representation from the programmer most of the time. The type()
function will reveal whether a number is an int or a float:
int - arbritrary precision (https://adafru.it/Kaz) (length) integers;
float - 64bit floating-point.
Care is still needed with very large integers to avoid loss of precision from unintentional conversion to a
float . It's common to accidentally use / for (floating-point) division when // (floor division) was intended -
the latter retains the int type if
both
operands are int s.
CircuitPython
CircuitPython is a variant of MicroPython and both maintain Python's approach of largely hiding the
number representation from the programmer.
Small Boards
© Adafruit Industries https://learn.adafruit.com/clue-sensor-plotter-circuitpython Page 66 of 77
Page 67
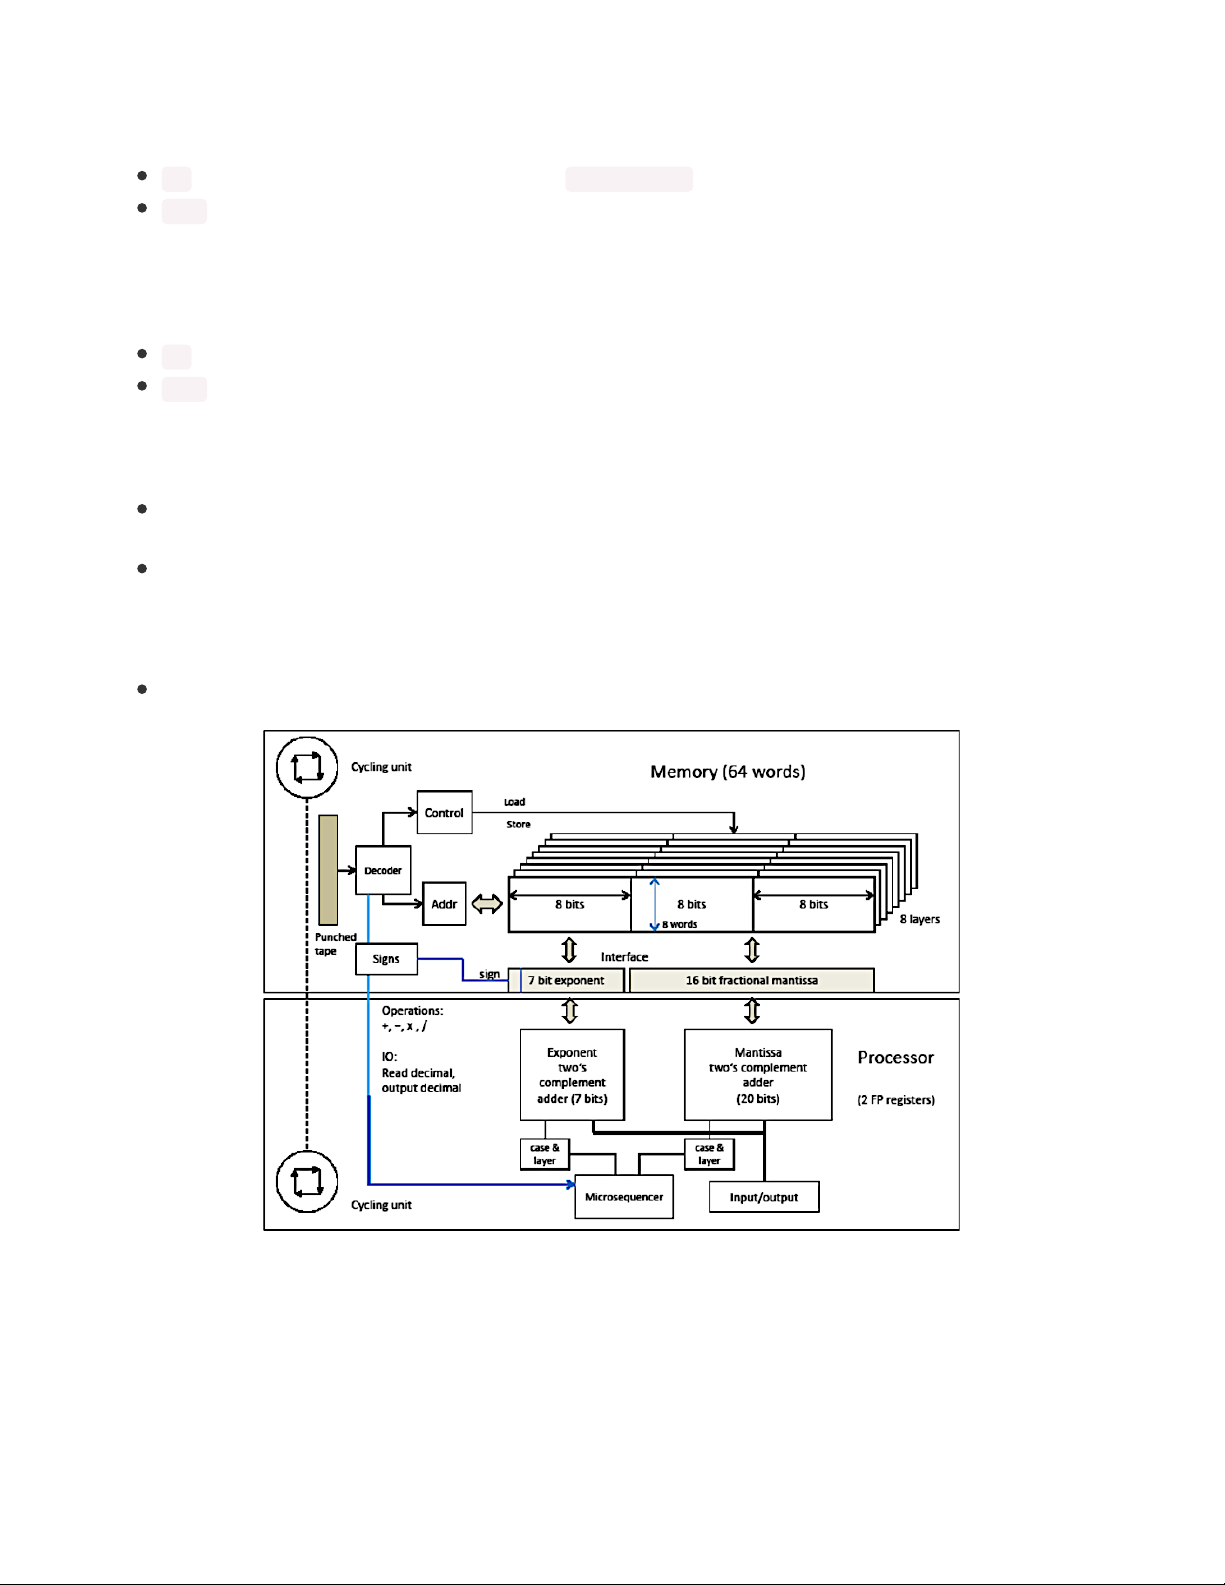
This category, sometimes referred to as the "non-Express boards", comprises the Gemma M0, Trinket M0
and Feather M0 non-Express boards.
int - 31bit, -1073741824 to 1073741823. An OverflowError exception is raised beyond this range.
float - 30bit storage but calculations are performed with 32bit precision.
Large Boards
Everything not in the above small category which runs CircuitPython.
int - arbritrary precision integers.
float - 30bit storage but calculations are performed with 32bit precision.
C/Arduino
For comparison:
int (https://adafru.it/KaA) 16bit on Arduino Uno (and other ATmega based boards) and 32bit on
Arduino Due and SAMD based boards.
float (https://adafru.it/KaB) - 32bit.
Zuse Z1
An older comparison:
float - 24bit storage but calculations are performed with 28bit equivalent precison.
Decimal Precision
The equivalent decimal precision in digits (significant figures (https://adafru.it/KaC)) for a range of floatingpoint sizes is shown in the table below.
© Adafruit Industries https://learn.adafruit.com/clue-sensor-plotter-circuitpython Page 67 of 77
Page 68

The Schmidt JavaScript Visualisation of 32bit IEEE-754 floating-point (https://adafru.it/KaD) is a useful
online tool to understand floating-point. Stored values in CircuitPython will always have the lower two bits
not set. The animated example below shows how the value 3.14 is represented and how it would be
represented in CircuitPython with two fewer bits.
The next page discusses the practical issues of representing time in CircuitPython due to the underlying
number representation.
© Adafruit Industries https://learn.adafruit.com/clue-sensor-plotter-circuitpython Page 68 of 77
Page 69

Time in CircuitPython
The time on a computer passes in small steps. If these values are stored or processed using a fixed size
representation then care is needed to prevent issues. For example:
A clock that ticks 100 times a second (100Hz), represented by a signed 32bit integer can only reach
(2^31 - 1) / 24 / 3600 / 100 = 248.55 days before overflowing. E.g. FAA Airworthiness Directive 2018-
20-15 for Boeing 787 (https://adafru.it/KaE) (pdf)
A 4000Hz clock using the same representation will overflow at (2^31 - 1) / 3600 / 4000 = 149.13 hours.
E.g. EASA Airworthiness Directive 2017-0129R1 for Airbus A350 (https://adafru.it/KaF) (pdf).
CircuitPython time functions
CircuitPython provides a subset of functions from the time library (https://adafru.it/Eri). The
monotonic (https://adafru.it/KaG) in their name refers to a guarantee that time will not go backwards. For
comparison, gettimeofday on Linux (https://adafru.it/KaH) does not provide this guarantee and naive use
for timing durations can result in
negative
values!
time.monotonic()
Python and CircuitPython's time.monotonic() (https://adafru.it/Eri) returns time in seconds as a float variable.
This return value increases over time reducing the resolution available to represent the fractional part of
the value. The effect is far more significant for the 30bit storage representation used by
CircuitPython (https://adafru.it/IhA) (based on single precision floating point (https://adafru.it/IhB)) in
combination with the epoch (https://adafru.it/IhC) time of 0.0 at power-up. This lowers the precision of the
millisecond portion as the program continues to run and increases the granularity. This effect can be very
significant if the program runs for days or weeks.
time.monotonic_ns()
Python (3.5+) and CircuitPython's time.monotonic_ns() (https://adafru.it/Eri) (available on all boards bar
Gemma M0, Trinket M0 and Feather M0 non-Express) is the equivalent of time.monotonic() with an int
© Adafruit Industries https://learn.adafruit.com/clue-sensor-plotter-circuitpython Page 69 of 77
Page 70

return value in nanoseconds (one billionth of a second). This value is not subject to reduced precision over
time as long as the value is not accidentally converted to a float . Examples of correct and incorrect usage
are shown below.
import time
# Good - int value preserved
start = time.monotonic_ns()
time.sleep(0.005)
ms_duration = (((time.monotonic_ns() - start) + 500000)
// 1000000)
print(ms_duration)
# Good - int subtraction then the small value
# duration value is ok to convert to a float
start = time.monotonic_ns()
time.sleep(0.005)
ms_duration = round((time.monotonic_ns() - start) / 1e6, 1)
print(ms_duration)
# BAD - accidental/premature conversion to
# float reducing accuracy of calculation
start_ms = time.monotonic_ns() / 1e6 # BAD
time.sleep(0.005)
ms_duration = round(time.monotonic_ns() / 1e6 # BAD
- start_ms, 1)
print(ms_duration)
The first example will print 5 . The second example prints values like 4.6 or 4.7 . The third example will
print 0.0 or infrequently 32.0 for a board that's been running for one day!
Care is needed when using the exponential notation like 1e6 for 1000000 . In Python, 1e6 is always a
float . The example below from REPL shows how unintended type promotion (https://adafru.it/KaI) to float
spoils the accuracy of the addition.
>>> t1 = time.monotonic_ns()
>>> t1
167333909366000
>>> t1 + 1e9
1.67335e+14
>>> int(t1 + 1e9)
167334878642176
>>> t1 + 1000000000
167334909366000
Using the correct division operator for floor division ( // ) and ensuring it's used with int types is also critical
to avoid trouble from float s.
© Adafruit Industries https://learn.adafruit.com/clue-sensor-plotter-circuitpython Page 70 of 77
Page 71

>>> smaller = 1034567890
>>> larger = smaller + 10
>>> if larger > smaller: print("all ok - integer calculation/comparison")
...
all ok - integer calculation/comparison
>>> if larger // 10 > smaller // 10: print("all ok - integer calculation/comparison")
...
all ok - integer calculation/comparison
>>> if larger / 10 > smaller // 10: print("not ok - float division")
...
>>> if larger // 1e1 > smaller // 10: print("not ok - integer division used with float")
...
Making Large Numbers Readable
The 1e9 representation is useful for one billion because
the number 9 is easier to read and validate compared to visually counting the number of zeroes in
1000000000 . The previous section mentions the type of 1e9 is a float .
The language Ada (https://adafru.it/Kdo) introduced a representation of numeric
literals (https://adafru.it/Kdp) (numbers) with optional underscores to allow a number to visually broken up.
From Honeywell Bull's successful "GREEN" proposal for Ada, "Rationale for the Design of the GREEN
Programming Language (1979)":
The underscore is permitted within a number to break up long sequences of
digits, a requirement that has long been recognized by printers.
Java introduced this with V7 in 2011 (https://adafru.it/Kdq), Python introduced this in 3.6 in
2016 (https://adafru.it/Kdr). CircuitPython implements this, an example on REPL can be seen below
showing how large int values can be more clearly represented.
Adafruit CircuitPython 5.0.0 on 2020-03-02; Adafruit CLUE nRF52840 Express with nRF52840
>>>
>>> an_int = 1_000_000_000
>>> print(an_int,
... an_int // 1000_000, an_int // 1_00_00_00,
... int("-1_234_567"))
1000000000 1000 1000 -1234567
Performance Variability
In general, interpreted languages tend to offer less predictable performance than compiled languages so
there may be some variation in this timing. CircuitPython performance will be occasionally affected by:
garbage collection (a few ms),
various other background tasks like USB activity including CIRCUITPY file system operations,
automatic displayio screen refreshes (can be 100+ ms).
For benchmarking on boards with a screen, it is important to disable displayio automatic screen
updates for serial console output.
© Adafruit Industries https://learn.adafruit.com/clue-sensor-plotter-circuitpython Page 71 of 77
Page 72

Demonstration of time.monotonic() Granularity
This is a short program which demonstrates the degradation in sub-second time.monotonic() resolution.
The output will differ on boards which have been powered up for a long time showing how time becomes
more granular.
import board, time
# Disable updates to LCD screen which
# will occasionally introduce very large
# delays between statement execution
board.DISPLAY.auto_refresh = False
print(*[("{:" + str(hdr[0])
+ "s}").format(hdr[1])[:hdr[0]]
for hdr in ((3, "num"),
(15, "monotonic_ns()"),
(12, "monotonic()"),
(8, "fraction"),
(9, "offset"))
],
sep=" | ")
count = 1
previous = time.monotonic()
# Print the time when it changes according
# to time.monotonic() to inspect the
# sub-second precision
while True:
now = time.monotonic()
now_ns = time.monotonic_ns()
if now != previous:
now_ns_str = str(now_ns)
now_frac = now - int(now)
print("{:3d}".format(count),
now_ns_str[:-9] + "." + now_ns_str[-9:],
"{:.6f}".format(now),
"{:.6f}".format(now_frac),
"{:.6f}".format(int(now_ns_str[-9:-3])
/ 1e6 - now_frac),
sep=" | ")
previous = now
count = 1
else:
count += 1
Ten Minutes
A CLUE board which is approaching 10 minutes of uptime prints the time on every iteration of the loop and
has sub-millisecond precision from time.monotonic() .
© Adafruit Industries https://learn.adafruit.com/clue-sensor-plotter-circuitpython Page 72 of 77
Page 73

num | monotonic_ns() | monotonic() | fraction | offset
1 | 563.305638000 | 563.304901 | 0.304932 | 0.000706
1 | 563.310520000 | 563.309813 | 0.309814 | 0.000705
1 | 563.315276000 | 563.314915 | 0.314941 | 0.000335
1 | 563.319893000 | 563.318825 | 0.318848 | 0.001045
1 | 563.324549000 | 563.323975 | 0.323975 | 0.000574
1 | 563.329326000 | 563.328838 | 0.328857 | 0.000468
1 | 563.333935000 | 563.332987 | 0.333008 | 0.000927
1 | 563.338627000 | 563.337898 | 0.337891 | 0.000736
1 | 563.343376000 | 563.343000 | 0.343018 | 0.000358
1 | 563.348121000 | 563.347864 | 0.347900 | 0.000221
Two Days
After almost two days the sub-second precision has dramatically dropped - the granularity is now 1/16th of
a second (62.5ms).
num | monotonic_ns() | monotonic() | fraction | offset
1 | 149621.908317000 | 149621.868134 | 0.875000 | 0.033317
179 | 149621.929066000 | 149621.939659 | 0.937500 | -0.008434
584 | 149621.993094000 | 149622.001648 | 0.000000 | 0.993094
663 | 149622.057075000 | 149622.058868 | 0.062500 | -0.005425
663 | 149622.121106000 | 149622.130394 | 0.125000 | -0.003894
662 | 149622.185034000 | 149622.192383 | 0.187500 | -0.002466
663 | 149622.249074000 | 149622.249603 | 0.250000 | -0.000926
663 | 149622.313108000 | 149622.306824 | 0.312500 | 0.000608
472 | 149622.360060000 | 149622.383118 | 0.375000 | -0.014940
581 | 149622.424027000 | 149622.430801 | 0.437500 | -0.013473
663 | 149622.488075000 | 149622.497559 | 0.500000 | -0.011925
663 | 149622.552114000 | 149622.559547 | 0.562500 | -0.010386
662 | 149622.616032000 | 149622.621536 | 0.625000 | -0.008968
663 | 149622.680073000 | 149622.688293 | 0.687500 | -0.007427
663 | 149622.744107000 | 149622.750282 | 0.750000 | -0.005893
660 | 149622.808095000 | 149622.812271 | 0.812500 | -0.004405
582 | 149622.872057000 | 149622.869492 | 0.875000 | -0.002943
663 | 149622.936033000 | 149622.941017 | 0.937500 | -0.001467
663 | 149623.000109000 | 149623.003006 | 0.000000 | 0.000109
495 | 149623.049088000 | 149623.060226 | 0.062500 | -0.013412
The loop is typically running over 600 times before time.monotonic() changes. This is because only 4 bits
are left for the fractional component of the time.
© Adafruit Industries https://learn.adafruit.com/clue-sensor-plotter-circuitpython Page 73 of 77
Page 74

Going Further
Ideas for Areas to Explore
Add a proper finger sensor for plotting pulses: Adafruit Forums: Get a CLUE about your Pulse :-
) (https://adafru.it/doW)
Add more plotting modes:
min/avg/max per second/minute/hour would be useful for long-term monitoring.
show multiple plots on two y axis or two graphs, e.g. temperature and humidity.
Add some supression/pause between button press and volume source to prevent the physical
impact being plotted.
Add x axis tick labels with time values and investigate the feasibility of a true oscilloscope-style
output with a timebase set by the user.
Make an altimeter and vertical speed indicator with a plot mode and an instantaneous large-font
display. cf. CLUE Altimeter (https://adafru.it/MAq), published after this guide was created.
Look at the new high performance ulab library (https://adafru.it/KaJ) for number crunching which
could be used to post-process the sensor data.
Enhance the code to also work on the Circuit Playground Bluefruit (https://adafru.it/Gpe) with the
Circuit Playground TFT Gizmo (https://adafru.it/Gff) LCD screen.
Test the output to Mu particularly on the three channel plots and look at how to tailor the data sent to
Mu.
Improve the performance of plotting by replacing the slow undrawing technique with a clear screen
implemented using the new, fast displayio Bitmap fill() (https://adafru.it/MAr) method.
Related Projects
Adafruit Learn: EZ Make Oven (https://adafru.it/KaK) - a PyPortal oven controller with graphing usign
displayio in CircuitPython.
Adafruit Learn: Make It Plot (https://adafru.it/CQn) - plotting in Mu editor.
Adafruit Learn: Your Pulse Displayed with NeoPixels (https://adafru.it/FOk) - another take on pulse
representation.
Adafruit Blog: APP UPDATE: Bluefruit Playground v1.3.0 with CLUE support (https://adafru.it/JGa) (for
iOS) - this has plotting capabilities.
Further Reading
Arduino to CircuitPython: Working with Numbers (https://adafru.it/KfZ)
Computerphile: Floating Point Numbers (https://adafru.it/KfJ) (YouTube)
What Every Computer Scientist Should Know About Floating-Point Arithmetic by David
Goldberg (https://adafru.it/Kb5)
Nvidia blog: What’s the Difference Between Single-, Double-, Multi- and Mixed-Precision
Computing? (https://adafru.it/KbQ)
Python 3 Docs: Floating Point Arithmetic: Issues and Limitations (https://adafru.it/KaL)
Philips Medical Systems: Understanding Pulse Oximetry SpO2 Concepts (https://adafru.it/KdM)
Medical Electronics: Pulse Oximetry by Dr Neil Townsend (https://adafru.it/KdN)
Slides to accompany Chapter 8: Software Testing (https://adafru.it/KaM) of Software Engineering (10th
edition) by Ian Sommerville (https://adafru.it/KaN)
Visual Paradigm's UML Tutorial: Class diagrams (https://adafru.it/KaO)
© Adafruit Industries https://learn.adafruit.com/clue-sensor-plotter-circuitpython Page 74 of 77
Page 75
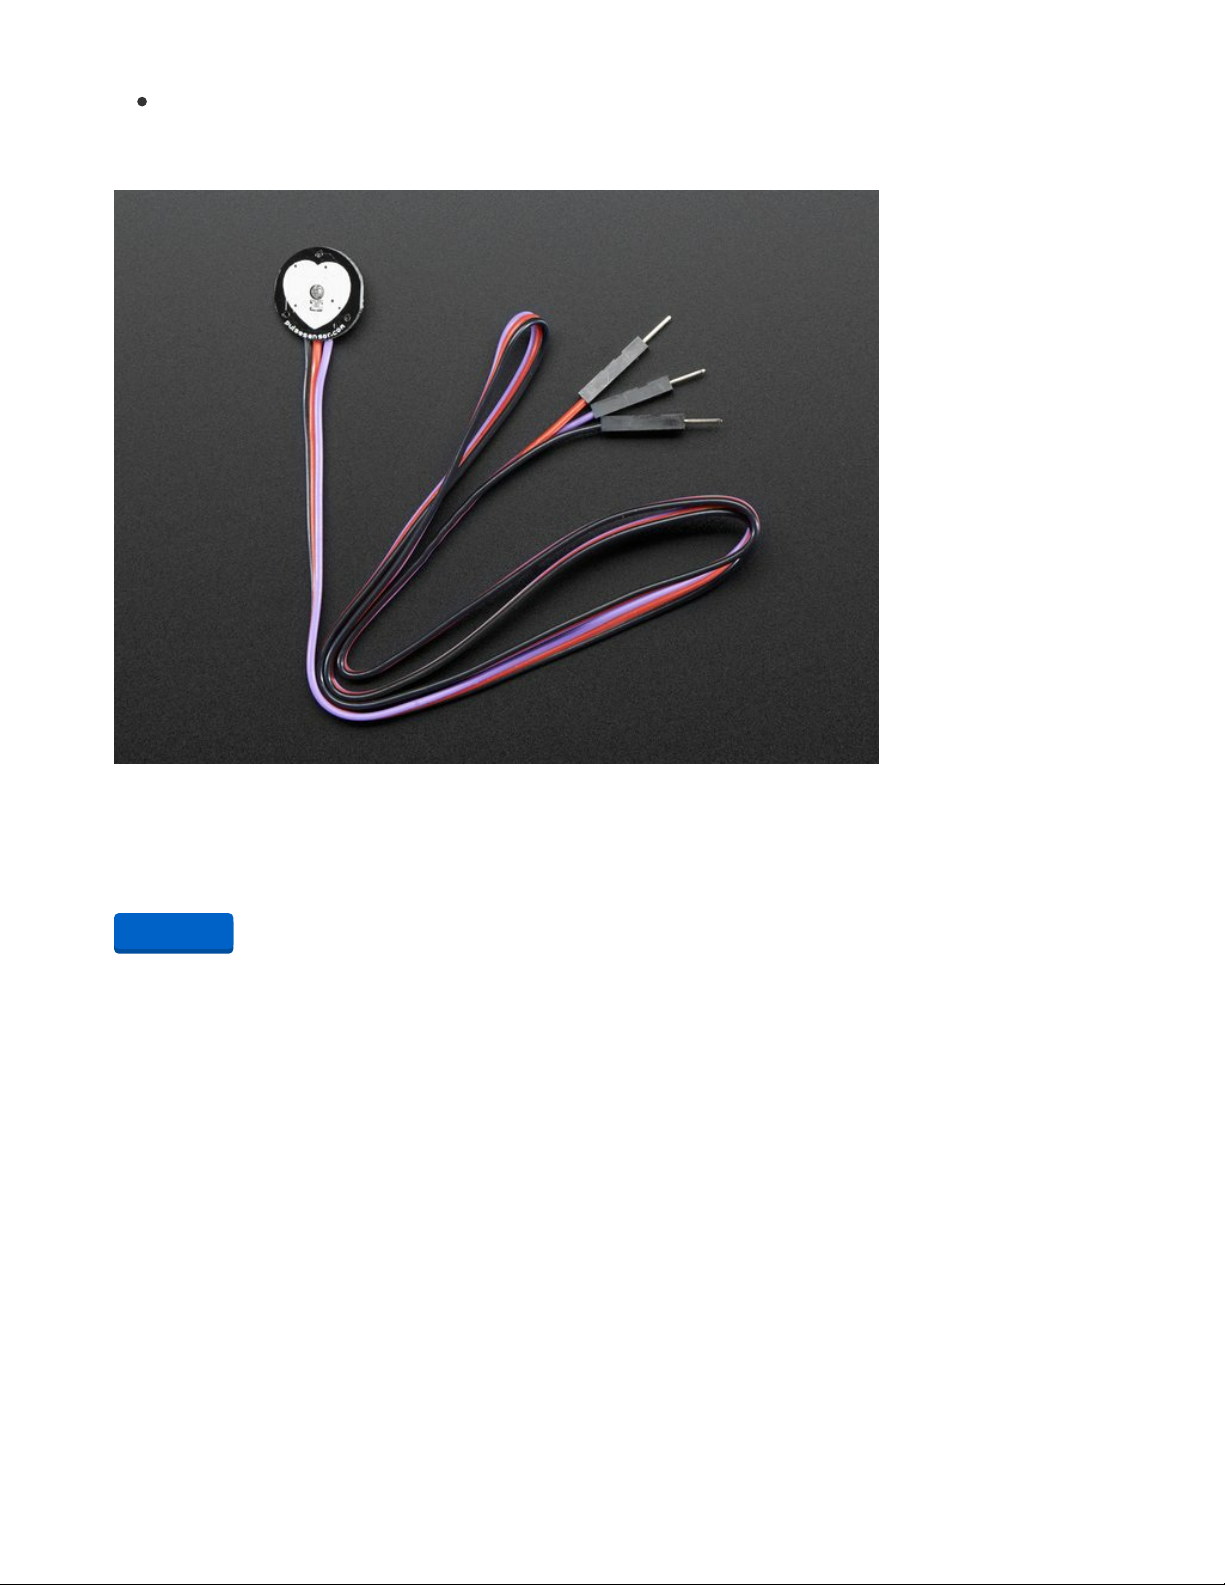
pyreverse, part of pylint distribution, can generate simple class diagrams from Python code. The
diagrams in this guide were created with https://app.diagrams.net/ (https://adafru.it/KaP), formerly
known as draw.io.
Pulse Sensor Amped
Pulse Sensor Amped is a greatly improved version of the original Pulse Sensor, a plug-and-play heart-rate
sensor for Arduino and Arduino compatibles. It can be used by students,...
$25.00
In Stock
Add to Cart
© Adafruit Industries https://learn.adafruit.com/clue-sensor-plotter-circuitpython Page 75 of 77
Page 76
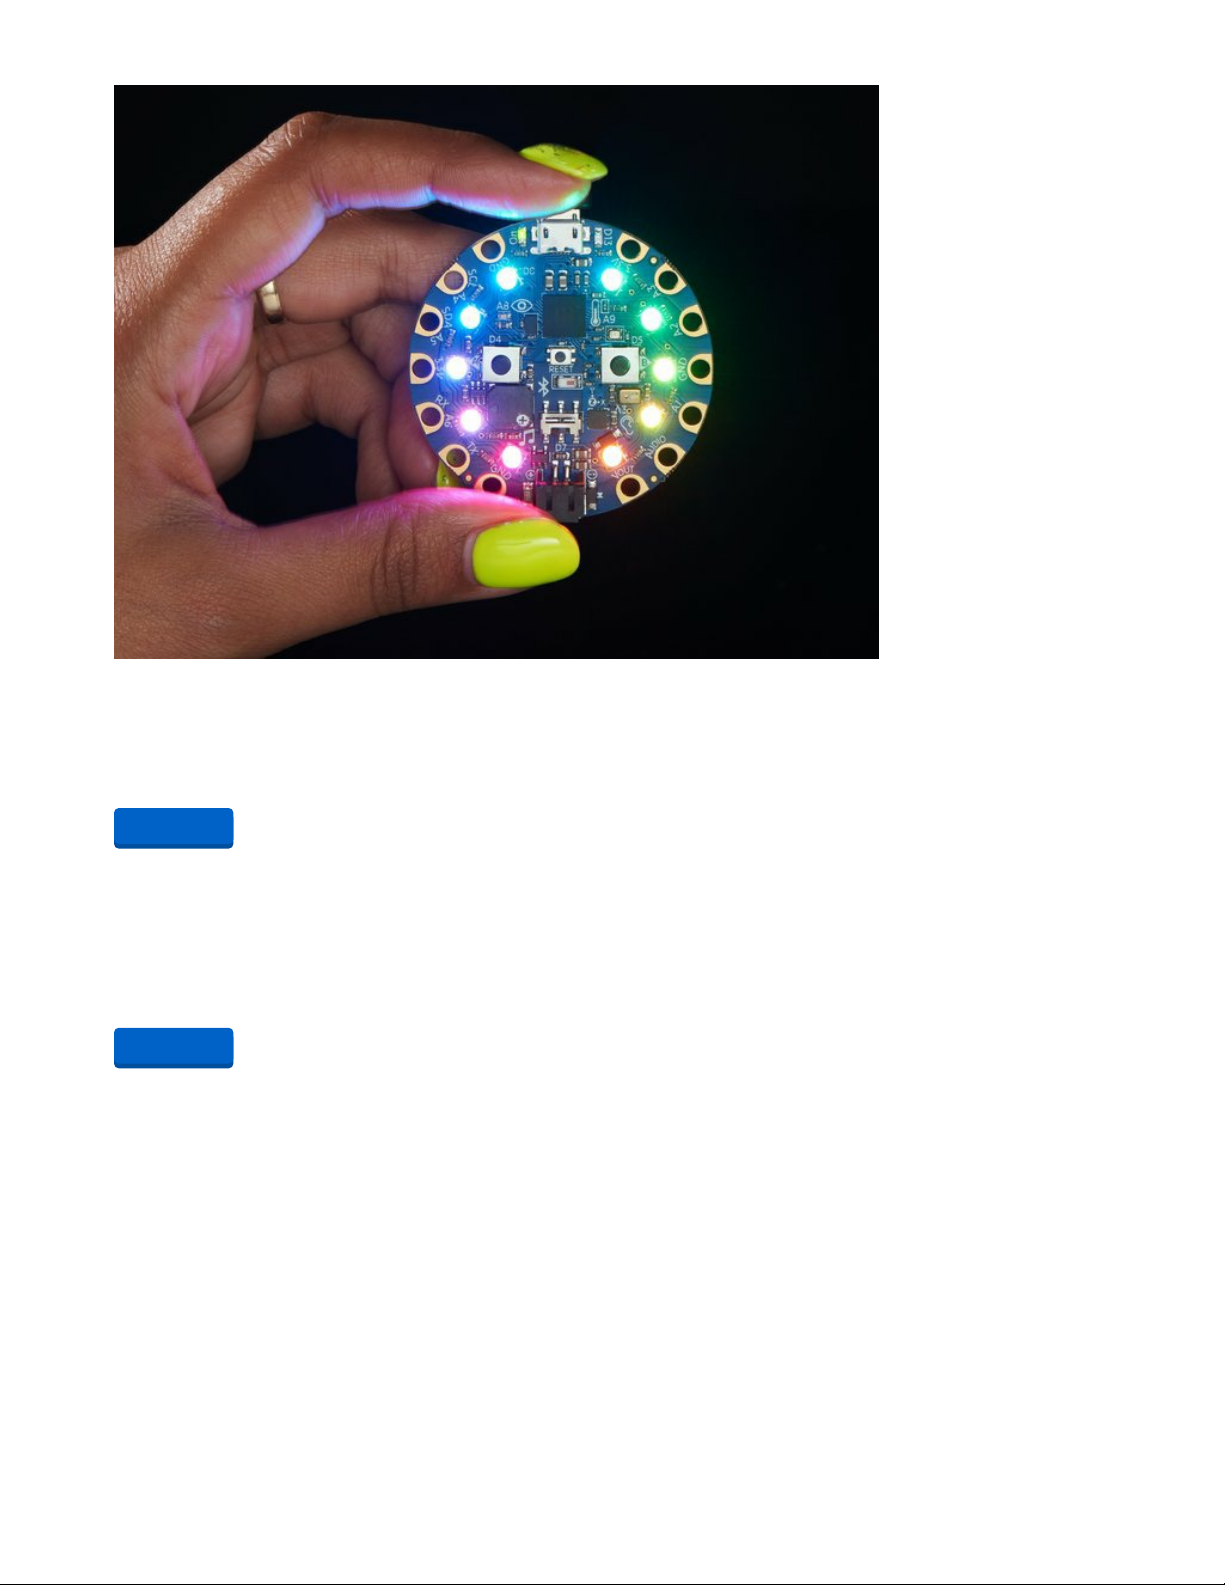
Circuit Playground Bluefruit - Bluetooth Low Energy
Circuit Playground Bluefruit is our third board in the Circuit Playground series, another step towards a
perfect introduction to electronics and programming. We've...
$24.95
In Stock
Your browser does not support the video tag.
Circuit Playground TFT Gizmo - Bolt-on Display + Audio Amplifier
Extend and expand your Circuit Playground projects with a bolt on TFT Gizmo that lets you add a lovely
color display in a sturdy and reliable fashion. This PCB looks just like a round...
$19.95
In Stock
Add to Cart
Add to Cart
© Adafruit Industries https://learn.adafruit.com/clue-sensor-plotter-circuitpython Page 76 of 77
Page 77

© Adafruit Industries Last Updated: 2021-02-08 06:58:19 PM EST Page 77 of 77
 Loading...