

Page 1

www.acti.com
RETAIL APPLICATION SUITE USER’S MANUAL
Retail Application Suite
User’s Manual V1.0.13
1
2019/08/23
Page 2

www.acti.com
RETAIL APPLICATION SUITE USER’S MANUAL
TABLE OF CONTENTS
Preface ..................................................................................................... 2
System Requirements .............................................................................. 2
1. Function Overview ............................................................................ 3
A. Summary ........................................................................................................ 3
B. Foot Traffic ..................................................................................................... 4
C. Demographics ................................................................................................ 6
D. Transaction/ Analystics .................................................................................. 9
E. Report Schedule/ Combo Chart ................................................................... 10
F. Event Calendar ............................................................................................. 12
G. POS Data Upload .......................................................................................... 13
H. Heat Map ..................................................................................................... 14
I. Attention List ................................................................................................ 15
2. Setting ............................................................................................. 19
A. Store setting ................................................................................................. 19
B. MGB Server Setting ...................................................................................... 20
C. User Management ....................................................................................... 21
D. Email Server Setting ..................................................................................... 22
E. Event Calendar Setting ................................................................................. 23
Annex ..................................................................................................... 24
1
Page 3

www.acti.com
RETAIL APPLICATION SUITE USER’S MANUAL
Preface
Trademark
All product names mentioned in this documentation are registered trademarks of
their respective companies.
Liability
Every reasonable care has been taken during the writing of this manual. Please
inform your local office if you find any inaccuracies or omissions. We cannot be held
responsible for any typographical or technical errors and reserve the right to make
changes to the product and manuals without prior notice.
System Requirements
When using the Retail Application Suite (RAS) on other computers, take note of the
following minimum system requirements:
CPU Recommendation: Intel Core i5-6500TE, 8GB RAM
Operating System: 32/64 bit Windows 7 Embedded, Windows 8, Windows 10
Network: Ethernet 1000 Base-T recommended
Storage: SSD 128 GB
2
Page 4
www.acti.com
RETAIL APPLICATION SUITE USER’S MANUAL
1. Function Overview
A. Summary
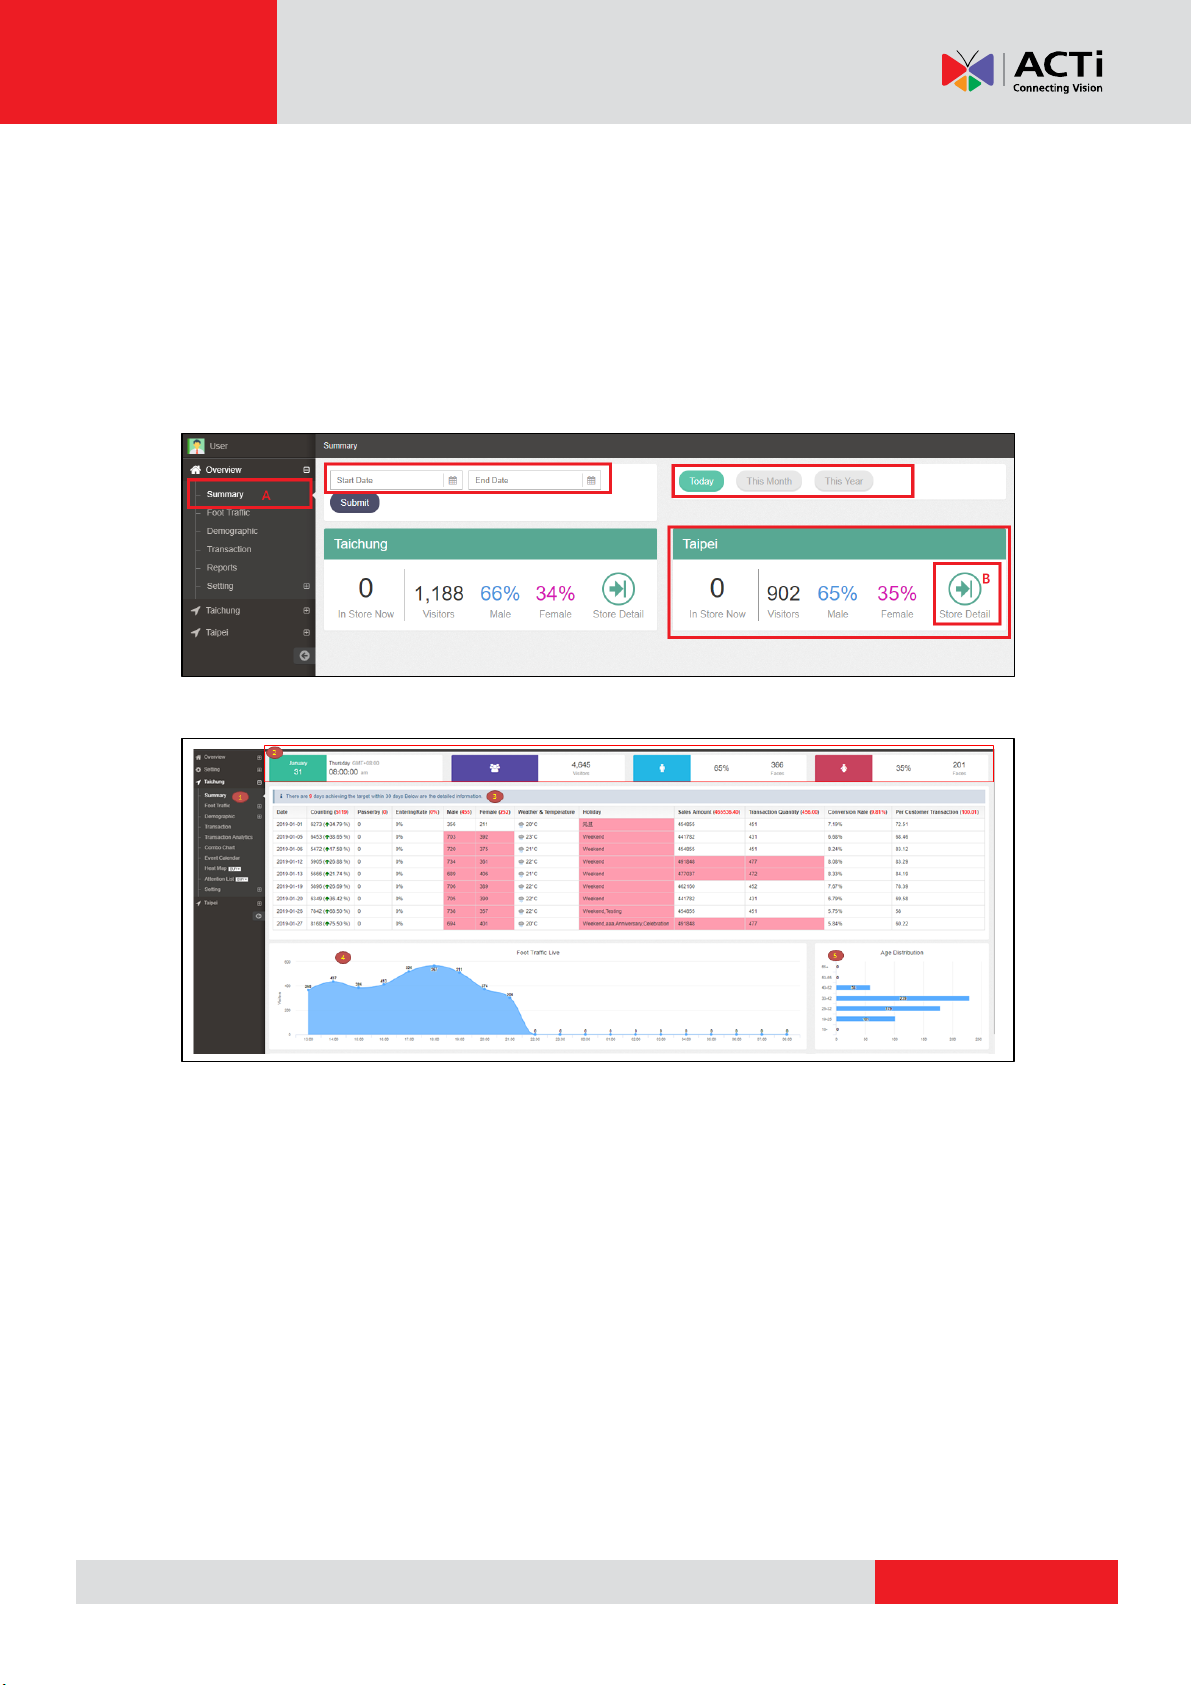
Enter the home page, you can find the function list on the left side menu.
(A) Click “Summary”, you can see the overall result of the stores you registered. You
can manually define the period to view: by day/ month/ year.
(B) Click “Store Detail” to enter the store page.
More data can be analyzed in the store summary. Take below Taichung branch as
example.
1. Click “Summary” under store list
2. Quick summary of this store.
3. The Target mode shows the real value which is exceeding the pre-defined target.
For instance, if you define the counting target point to be 3000 persons, then
this system will output the date by which the counting becomes over 3000.
4. Analyze the foot traffic of the store, by hours
5. Analyze the age distribution
3
Page 5
www.acti.com
RETAIL APPLICATION SUITE USER’S MANUAL
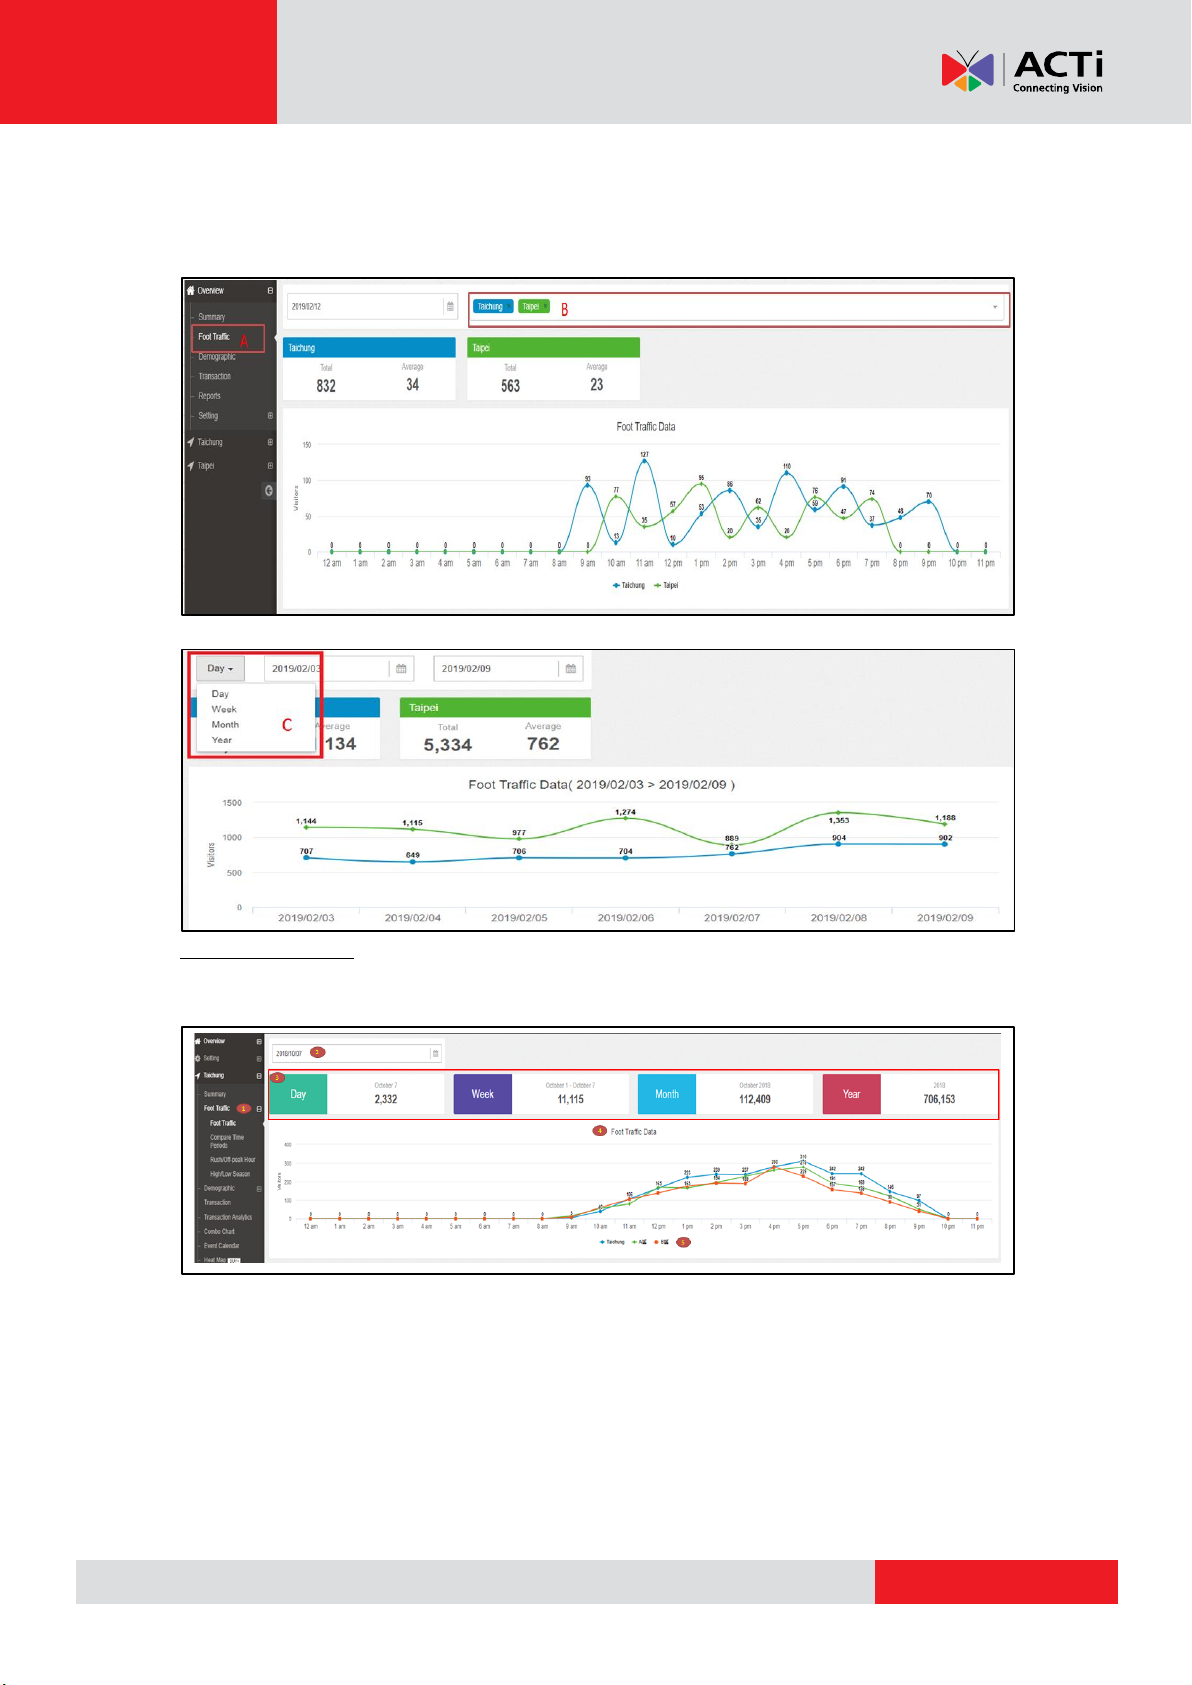
B. Foot Traffic
(A) Click “Foot Traffic”, check all the store for foot traffic.
(B) Add your preferred store, and then enter the date you would like to know. Hourly
report can be generated.
(C) User can also enter the report duration with Day/ Week/ Month/ Year.
In store summary, more data can be analyzed. Take below Taichung branch as an
example.
Foot Traffic
1. Click “Foot Traffic” under the store list.
2. Choose the date.
3. Show the static data per day/ week/ month/ year.
4. Line chart: If you have more than 1 block in this store, the line chart can be
shown as different color lines. Click on it to see the details.
5. Color Legend of the different blocks
4
Page 6
www.acti.com
RETAIL APPLICATION SUITE USER’S MANUAL
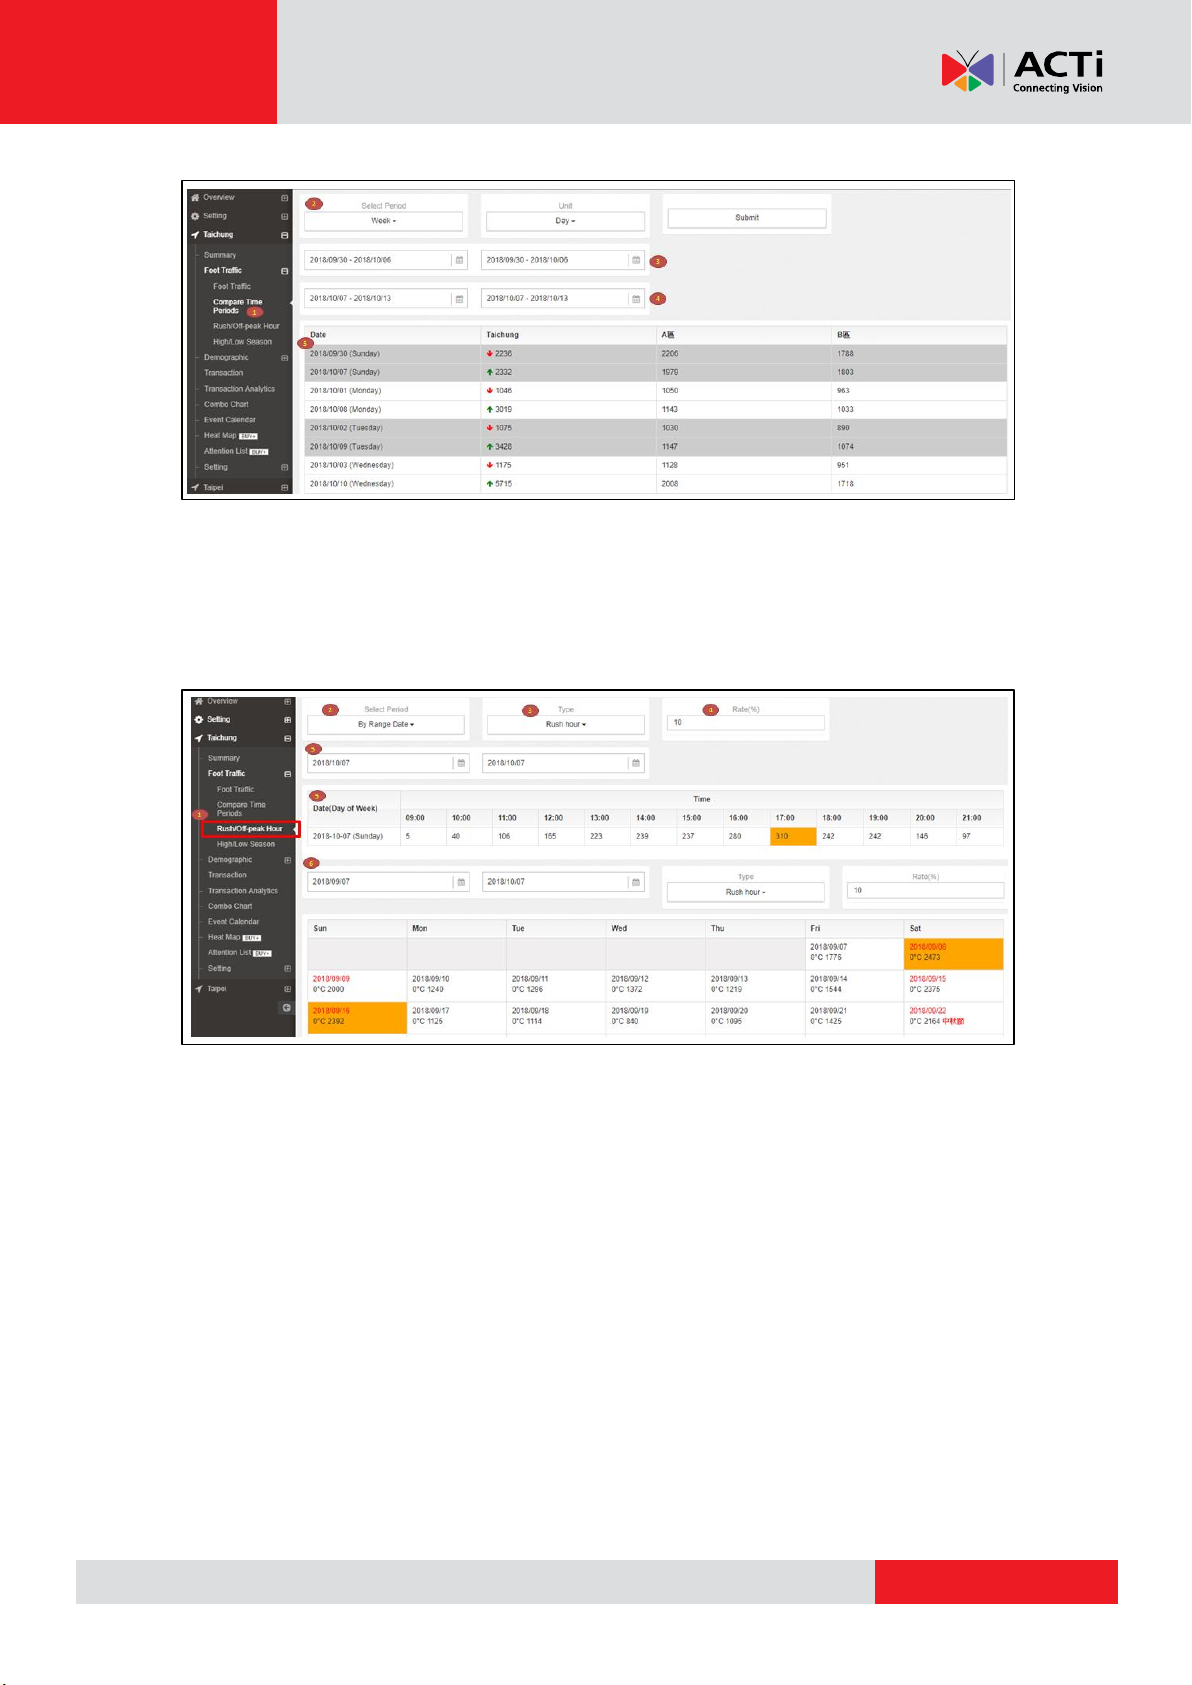
Compare Time Period
1. Click “Compare Time Periods”.
2. Choose the period you would like to analyze.
3. Select the date that you want to compare.
4. Select the date that you want to compare with (No.3 compares with No.4).
5. The result will show up, you can directly know which day is higher/ lower.
Rush/ Off-peak Hour
See where the peak/ off-peak intervals are, in order to change the business strategy.
1. Click “Rush/ Off-peak Hour”.
2. There are two options, sorting by specific interval and by week.
3. Peak or off peak selection.
4. Define the percentage, the counting number would be in orange if it is over the percentage.
5. Result in a day which is along with each hour.
6. You can also see the analysis result in the calendar mode. Same concept as above, choose the
duration and define the percentage. In addition, in calendar mode, user can see the
temperature.
5
Page 7
www.acti.com
RETAIL APPLICATION SUITE USER’S MANUAL
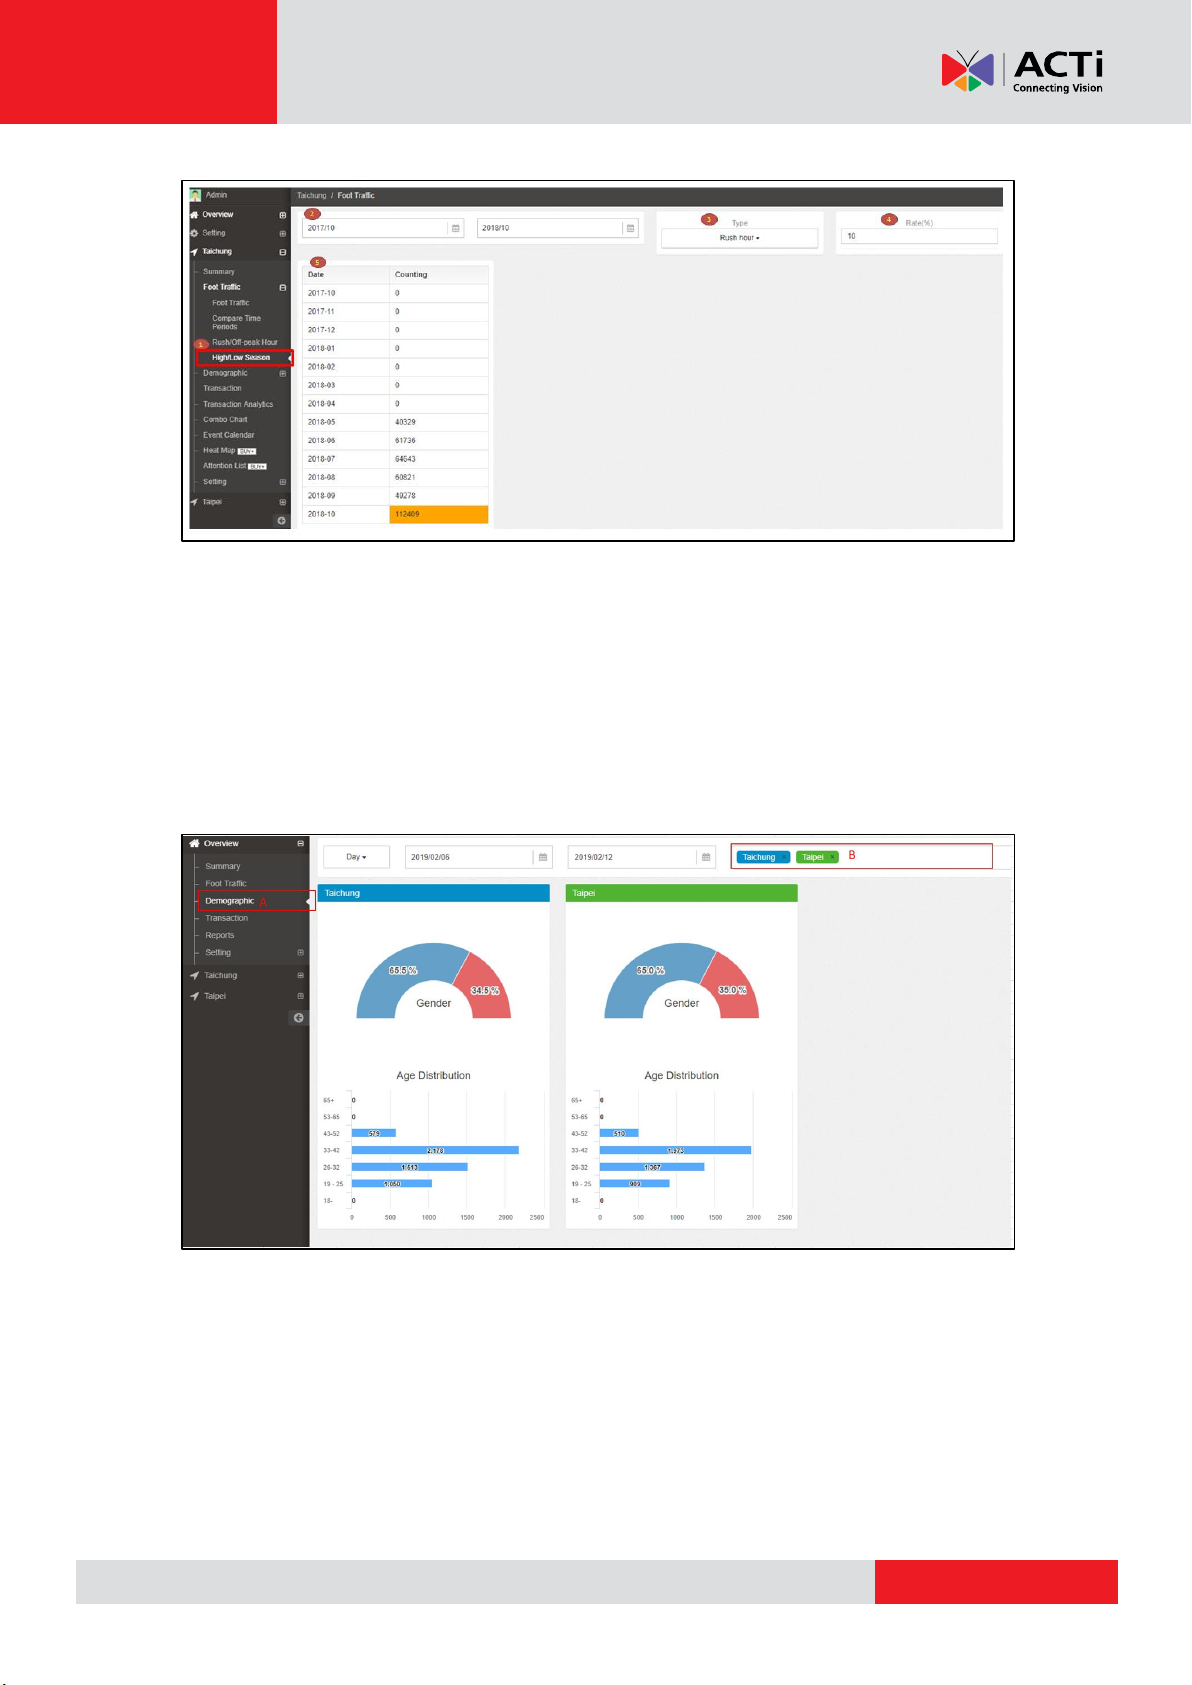
High/ Low Season
1. Click “High/ Low Season”.
2. Select the start date and end date.
3. Peak or off peak selection
4. Define the percentage, then the counting number would be in color orange if it is over the
percentage.
5. The result will appear on the table for comparison.
C. Demographics
(A) Click “Demographics”
(B) Select your preferred store, user can directly review the Age/ Gender distribution from the pie
chart.
6
Page 8
www.acti.com
RETAIL APPLICATION SUITE USER’S MANUAL
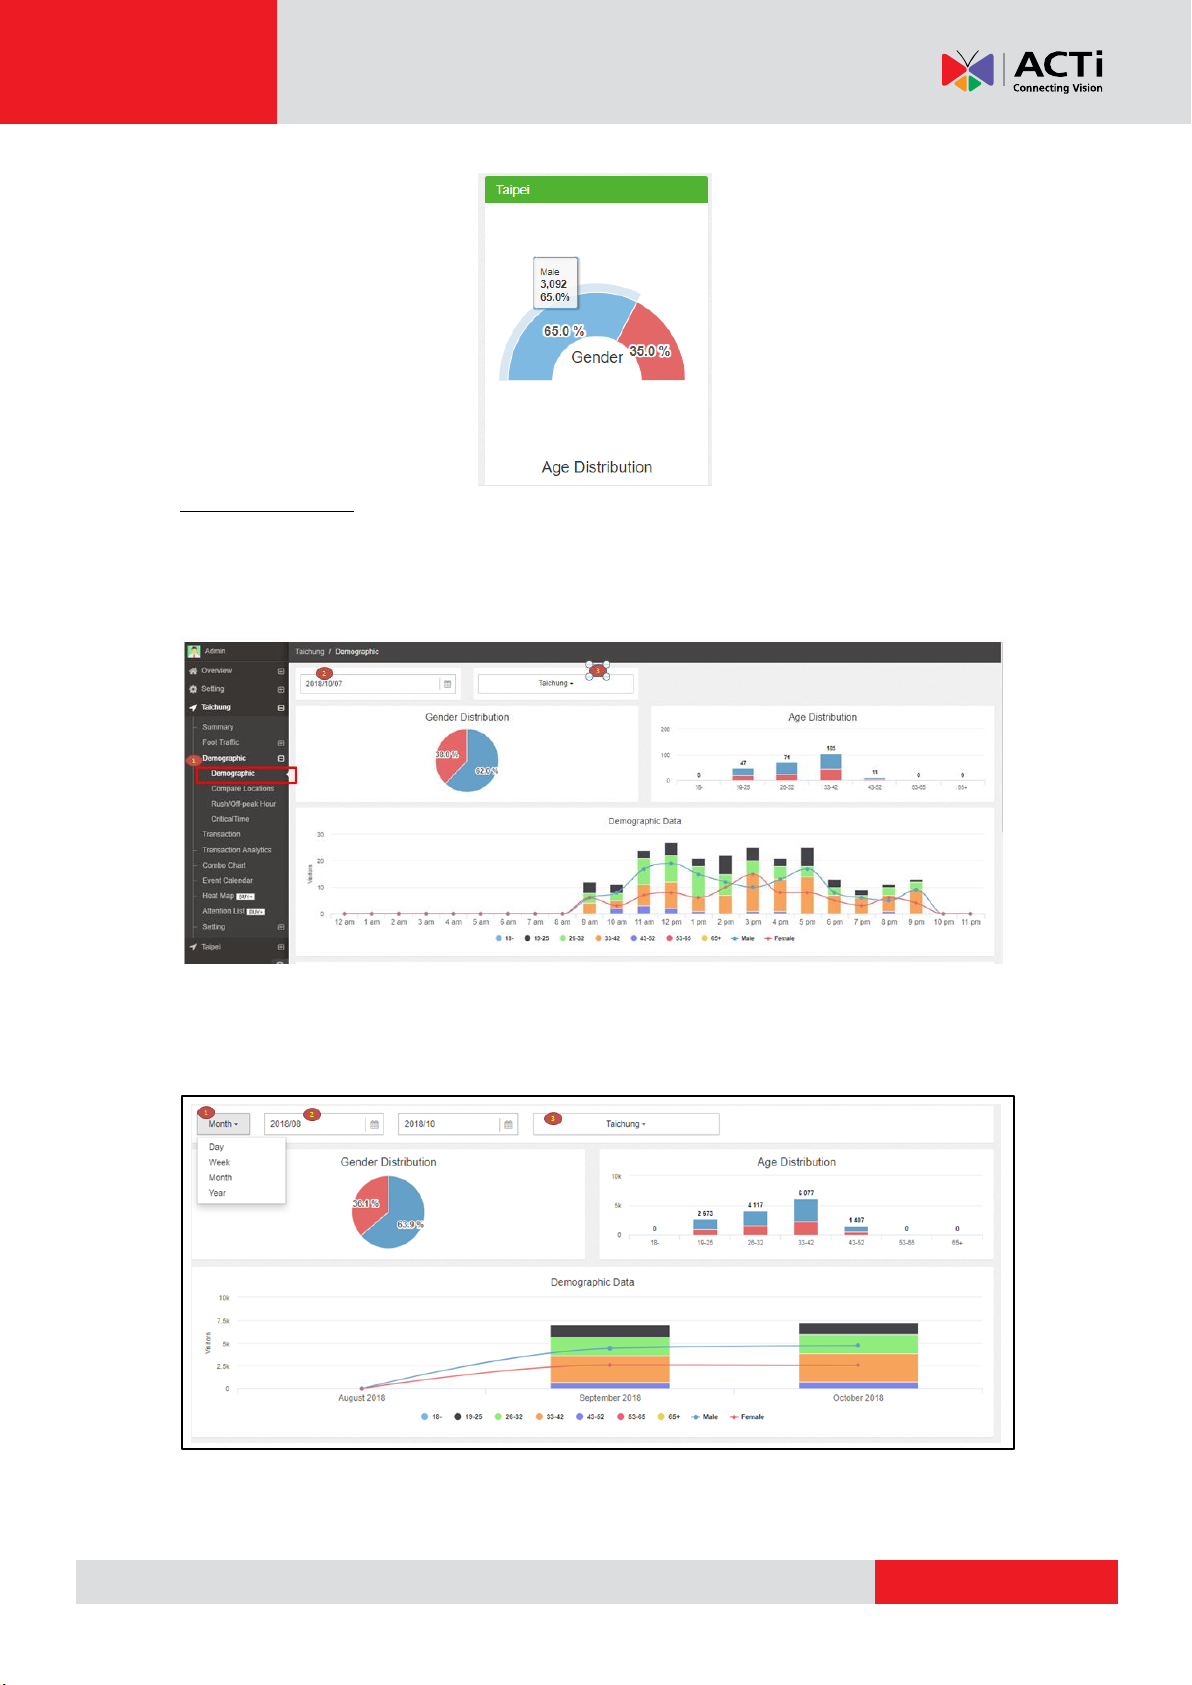
Point to the percentage of pie chart, the popup message shows the detail quantity.
In store summary, more data can be analyzed. Take below Taichung branch as an
example.
Demographic
See more data, this includes pie chart and line chart.
1. Click “Demographic”.
2. Choose the date for knowing the demographic distribution.
3. Choose the block from the branch (if there is more than 1 block).
Dashboard can be presented in specific interval.
1. Select the duration, day, week, month or year.
2. Choose the start date and end date.
3. Choose the block from the branch (if there is more than 1 block).
7
Page 9

www.acti.com
RETAIL APPLICATION SUITE USER’S MANUAL
Compare Locations
Different blocks in one branch might have totally varying counting. See what the
distribution is from the below instruction.
1. Click “Compare Locations”
2. User can select the duration like Day, Week, Month and Year.
3. Choose the start/ end date.
4. Select the location/ block that is for comparison.
Rush/Off-peak Hour
1. Click “Rush/ Off-peak Hour”.
2. Choose the start/ end date.
3. Select the location/ block that is for comparison.
4. Selection for Peak/ Off-peak.
5. Define the percentage, then the counting number would be in orange if it is over the percentage
6. Use can choose the target age range.
8
Page 10

www.acti.com
RETAIL APPLICATION SUITE USER’S MANUAL
Critical Time
Promptly understand the consumer group from the table by your definition.
1. Click “CriticalTime”.
2. Choose the start/ end date.
3. Select the location/ block.
4. Select the age and gender.
5. Table is shown in calendar mode and shows the most counting of age with gender.
D. Transaction/ Analystics
In order to know the sales condition by each store:
(A) Click “Transaction”
(B) Select store under Drop-down menu (see Chapter2-A for setting step). The
transaction report directly shows up.
There is a comparison function for each store detailed transaction report.
(A) Click “Transaction Analytics”.
(B) Select the compared duration you want to see. The result includes Conversion
Rate, Sales Amount and Foot Traffic.
9
Page 11

www.acti.com
RETAIL APPLICATION SUITE USER’S MANUAL
This sample is based on days. The data show the increase and decrease for each
column.
E. Report Schedule/ Combo Chart
The system will generate reports as defined by the user.
(A) Click “Report” to the page.
(B) Click “New report schedule” to add a customized schedule.
Enter the related info as the following:
Reports Name: Customized the file name.
Store: Select the store
Analysis Type: Several data can be selected
Unit: Select the time unit for the report
File Type: Supports Excel and CSV format
File Path: The designated path to save the report
Recipient: The report will be sent to the specified person
10
Page 12

www.acti.com
RETAIL APPLICATION SUITE USER’S MANUAL
After finishing the above setting, go to “Trigger” page.
(A) Click “Trigger”.
(B) Add the trigger rule so that the user can get the report by specific time.
(C) Fill out each column then remember to save the setting.
Note: Please refer to the Annex for the report export format.
The report will be generated along with pie and line chart.
11
Page 13

www.acti.com
RETAIL APPLICATION SUITE USER’S MANUAL
Go to each store for its detailed report, there is a “Combo Chart” pattern.
(A) Click “Combo Chart”.
(B) Select up to two different data sources, user can see the relationship between
them. There are five sources: “Foot Traffic”, “Gender”, “Age”, “Transaction” and
“Temperature”.
F. Event Calendar
(A) Click “Event Calendar”, enter the page.
(B) Select the month you would like to check. The whole month report will be shown
day by day.
12
Page 14

www.acti.com
RETAIL APPLICATION SUITE USER’S MANUAL
There is a popup window as below that you can review the line chart based on the
correlation of people count and temperature.
As for the management of calendar event and event file uploading, please refer to
(Chpter2-E).
G. POS Data Upload
Users may need the analysis from different POS source by RAS engine, so upload the
POS data per below instruction.
(A) Click “POS Import”.
(B) You can select the file that you would like to analyze and submit it to system.
Thus, the analyzed result can be shown on the dashboard.
(Before uploading file, please download the template and follow the format for uploading.)
13
Page 15

www.acti.com
RETAIL APPLICATION SUITE USER’S MANUAL
H. Heat Map
(A) Click “Heat Map” to this page, you can check the traffic flow via heat map. And
the map can be uploaded by the user.
(B) Click “Add eMap” and select the target map for uploading.
Below is a sample:
14
Page 16

www.acti.com
RETAIL APPLICATION SUITE USER’S MANUAL
A
B
C
A
B
C
I. Attention List
A. Monitoring System
Interface of the instant face detection and recognition area
A. Photos instantly appear in this area when it detects a face.
B. The list of identified database, including a list of blacklists and whitelists appear
here.
C. If you want to add a note to this identification result, you can directly manage it
in the section “Note” (which will be described below)。
B. Event
The filter can be used to manage and select events, and the results will be
presented in the list on the right side.
A. Search by Name
B. Search by Group
C. Search by Specific time interval
15
Page 17

www.acti.com
RETAIL APPLICATION SUITE USER’S MANUAL
A B C
D
C. Note
The identification results added from the notes can be distinguished from the
name, time interval or whitelist/blacklist, can be searched, filtered, and
managed.
D. Notifier
There will be different notification actions for the identified results, you can set
the notifications on this page.
A. Click “Add” to add notification rules.
B. Enter a title or a brief description.
C. Select the corresponding person to be notified.
D. Enter the email of the manager who will be notified.
16
Page 18

www.acti.com
RETAIL APPLICATION SUITE USER’S MANUAL
A
B
E. Face Enrollment
Add and edit the Face database
A. Click “Add” to add a Face database.
B. Modify or delete the existing Face.
There are three steps to create a Face database.
Step one:
Enter First/Last name → Select the group which it belongs to → Upload a picture of
the face (You can also extract images from the identification results directly) →
Action, you can do either “Welcome your VIP” or drive away the blacklist person
from the result on the screen.
17
Page 19

www.acti.com
RETAIL APPLICATION SUITE USER’S MANUAL
Step two: Fill in the detailed information of the person.
Step three: Click “ Save” and complete face registration.
18
Page 20

www.acti.com
RETAIL APPLICATION SUITE USER’S MANUAL
2. Setting
A. Store setting
Users can add every store branches and select the related devices from this page.
(A) Click “Store” to enter the edit page. In this page, you can see the store list which
was added before and the profile can be edited at any time. Also, the branch
location will be labeled on Google map.
(B) Click “Add Store” to fill out related information such as the store name, location,
store working hours and the device selection. Please note that the device in use
would be listed on the drop-down menu if the user has already added it (See
Chapter2-B for step.)
(C) The items with the star sign (*) are REQUIRED entries. After completing these
data, click Save.
In the store, users can choose the device that belongs in that area.
(A) Click “Block”.
(B) Fill out related information such as store name, location, store working hours
and the device selection. Then you can manage either by store or block.
19
Page 21

www.acti.com
RETAIL APPLICATION SUITE USER’S MANUAL
B. MGB Server Setting
Before using any of the analysis function, configure first the camera and the MGB
server on this page.
(A) Click “MGB Server”, then add or edit the related setting.
(B) Click “Add server” to set MGB server. The server which was set will be listed.
(C) Fill in all the required data so that the child devices can find this server.
(D) Click “Add new device” to configure the camera. Users need to fill out all these
data so that the server can receive the video stream.
20
Page 22

www.acti.com
RETAIL APPLICATION SUITE USER’S MANUAL
C. User Management
There are four different permission levels (from the highest authority to the lowest):
Super Admin, Admin, Manager, and User. Each level of permission only can modify or
monitor the one who is lower than him.
There is only one Super Admin account. The Super Admin account is created and can
only be accessed by ACTi as a security measure since it is the highest permission.
Super Admin can create accounts for “Admin”, “Manager” and “User”; while “Admin”
can create “Manager” and “User” accounts. The logical flow is on this basis.
As a security measure, RAS has a “lock” function which enables the system to
preserve data by locking it to avoid the data being accidentally changed by anybody.
Take note that only an “Admin” can “lock” data, but “Admin” or any other users
cannot “unlock” them. Only a Super Admin has the permission to unlock data.
Therefore, if there is a need to “unlock” any data, then you need to contact ACTi to
do this.
(A) Click “User Management” from the page above.
(B) Add a user and fill out the related information.
(C-1) Provide the level of permission of this new member. The available selection will
depend on the creator’s permission level.
(C-2) Choose the store which will be managed by this new member.
21
Page 23

www.acti.com
RETAIL APPLICATION SUITE USER’S MANUAL
D. Email Server Setting
In order to send Email notifications to target receivers, users have to set the Email
server first.
(A) Click “Email Sender Info” and fill out the server related information which
includes sender name, SMTP and SMTP port. From the current default setting,
we already added Gmail as an example. (Please depend on the real situation)
22
Page 24

www.acti.com
RETAIL APPLICATION SUITE USER’S MANUAL
E. Event Calendar Setting
User can dynamically add event to the calendar so that the manager could easily
check the schedule at the same time.
(A) Click “Event Calendar” to enter this page.
(B-1) First, download the example and follow the format to add your event in Excel.
(B-2) After editing the event, upload the file and then the event will automatically
appear on the calendar.
(B-3) User can edit / delete the files to adjust the schedule.
(C) Review the event on the calendar and you can edit/ delete at any time.
23
Page 25

www.acti.com
RETAIL APPLICATION SUITE USER’S MANUAL
Store Name
Time
This Store
Age (6-8 years old in an interval)
Demogra
phic
Percent by
Time
Demogra
phic
Percent
by Time
Percent by
Age
Date/Time
(By Day/Hour)
Male
Female
Store
Block
Time
Foot
Traffic
Percent
by Time
Passerb
y
Entering
Rate
Foot
Traffic
Percent
by Time
Percent
by Area
Date/Time
(By Day/Hour)
Store Name
Time
Transaction
Sales Amount
Transaction
Quantity
Conversion
Rate (%)
Per Customer
Transaction
Annex
As shown in the E-Exports section of the setting chapter, it can be divided into three
report formats according to the user’s definition:
A. Demographic Analysis
B. Foot Traffic
C. Transaction Analysis
24
 Loading...