

Page 1

AWS Setup
The AWS ( Adaptive Woofer System) is a powerful tool that enables you to get optimum
sound performance from your ACI speaker system. AWS allows you to tune the speaker
to your room and placement. The instructions for using AWS are presented in the
manual and on the CD.
1. The Purpose of Equalization
2. Using the AWS Controls
3. Measurement and Adjustment Methods
4. Adjusting AWS using a Radio Shack SPL Meter and AWS Spreadsheet
5. Adjusting AWS using a Radio Shack SPL Meter and Graph Paper
6. Alternative Means of Measurement and Equalization
7. Website based updates
8. Supplemental Materials:
AWS Excel Spreadsheet
Printable Graph for Hand Plotting
Praxis Files
Trueaudio RTA Audio Analyzer Information
Audio Concepts, Inc.
901 South 4th Street, La Crosse, WI 54601
Phone: (608) 784-4570 Fax: (608) 784-6367
Website: www.audioc.com Email: service@audioc.com
All Rights Reserved 2002
Sound that Satisfies…
Page 2

1. Purpose of Equalization
Most of us listen to our speakers in less than ideal conditions. Typical
rooms are rectangles or at least rooms with some parallel walls. Most rooms
have a great number of standing waves that interact with the original signal,
either constructively or destructively . An example of a constructive interaction is
when the standing wave is in phase with the original signal, resulting in a peak at
a given frequency. Destructive interaction is when the signal is out of phase with
the original signal, resulting in a dip of the frequency.
A standing wave occurs when the distance between two walls is equal to
half the length of the wavelength. This effect is seen throughout the whole
frequency range. So why should we equalize the bass and ignore the standing
waves at higher frequencies? First, it is much easier to treat higher frequencies
with room treatments. Carpet, rugs, plants, and furniture do a fairly good job at
absorbing and dispersing higher frequencies. Lower frequencies are quite a bit
more difficult to absorb. For example, given a 40 Hz wave, it would take seven
feet, (1/4 wavelength) of absorbing material to reduce a reflection of that
particular wave. At 2KHz, it would only take about an inch and a half of
absorbing material. Our ears average the midrange and high frequencies for us.
We don’t hear each individual peak or dip. It would be extremely difficult to
equalize the huge number of peaks and dips in the midrange and high
frequencies.
Bass is a different story, in most domestic listening spaces there will be
one or two dominant resonant peaks in the bass response. These are the bass
notes that just jump out at you, that cause that excessive “boom”. These notes
hang on long after they should stop. These resonances often cause the entire
bass range to sound “slow” or bloated. Audiophiles have often dealt with this by
using speakers with a very lean bass or turning their subwoofers way down.
However, it is possible to have powerful and accurate bass response if we can
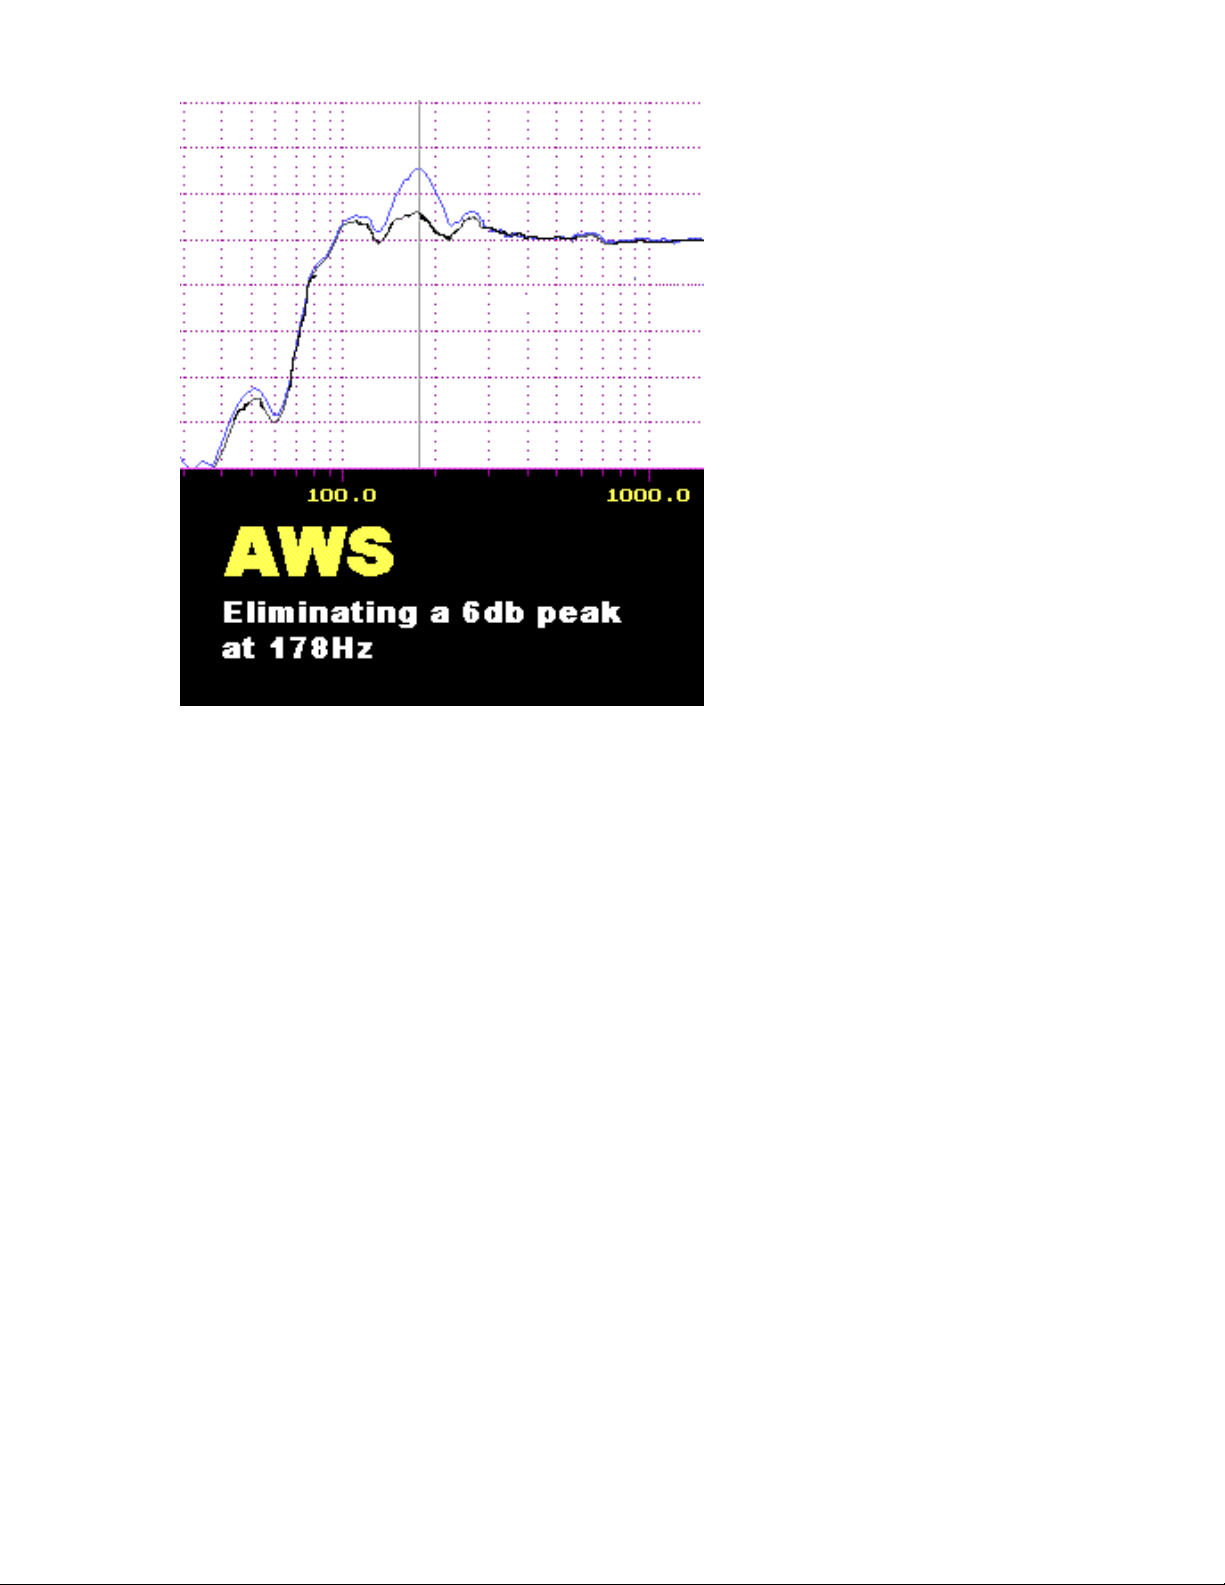
significantly reduce the amplitude of these major peaks. This is one of the two
major functions of what the AWS is designed to do.
AWS is also designed to give you the power to control the tonal balance of
the speaker. The perceived tonal balance of a speaker will change depending on
its placement within the room. Placing the speaker closer to room boundaries or
large furniture increases bass output. These boundaries act much like a mirror
behind a light bulb focusing the energy. An example would be a stand mounted
Veritas vs. a Veritas that is mounted flush in a large entertainment center. The
Veritas mounted in the entertainment center will have a bass heavy balance
compared to the stand mounted Veritas. The bass volume control in the AWS will
easily adjust for either placement.
Page 3
What about dips or
holes in the bass response?
Missing information is far less
objectionable than too much
information. Our ears tend to
fill in missing information so it
sounds “right”. This is a good
thing because an equalizer is
not effective at filling in holes
in the response. If fact, trying
to add a lot of boost to one
part of the spectrum will
usually result only in
increased distortion and
possible woofer damage. We
do not recommend using the
AWS to boost parts of the
response. It is far more
effective to reduce the peaks
to get a smoother overall
response.
2. Using the AWS Controls
There are two sections to the EQ controls. The first section is preset at the
factory. The High pass frequency and Phase control should be left at the factory
settings. The Volume control may be adjusted up or down to compensate for
speaker placement and desired total balance. Test tones are provided to
calibrate the volume level to neutral in your setting. Adding additional bass
volume beyond neutral will give the system a warmer overall balance.
Decreasing the bass level below neutral will result in a leaner balance with more
perceived detail.
The second section includes the two parametric EQ controls. There are three
adjustments and in/out switches for each band. The Gain controls the amount of
volume you want to subtract or add. The Frequency selection control adjusts the
frequency you are trying to alter. The Q control adjusts the width of the band. The
in/out control turns the particular EQ section on or off.
Note the Gain control has adjustable range from –9 to +6. It should be noted that
trying to fill in holes should generally be avoided. It is usually better to play
around with speaker/ listener placement to avoid dips. Increased distortion and
dynamic limitation are usually the only things gained by trying to fill in response
dips.
Page 4
3. Measurement and Adjustment Methods
1. By Ear: Recommended only for those who are very brave and possess well-
trained ears. Certainly you can use the test tones to spot frequencies that
sound to loud in relation to the other frequencies, but it will be difficult.
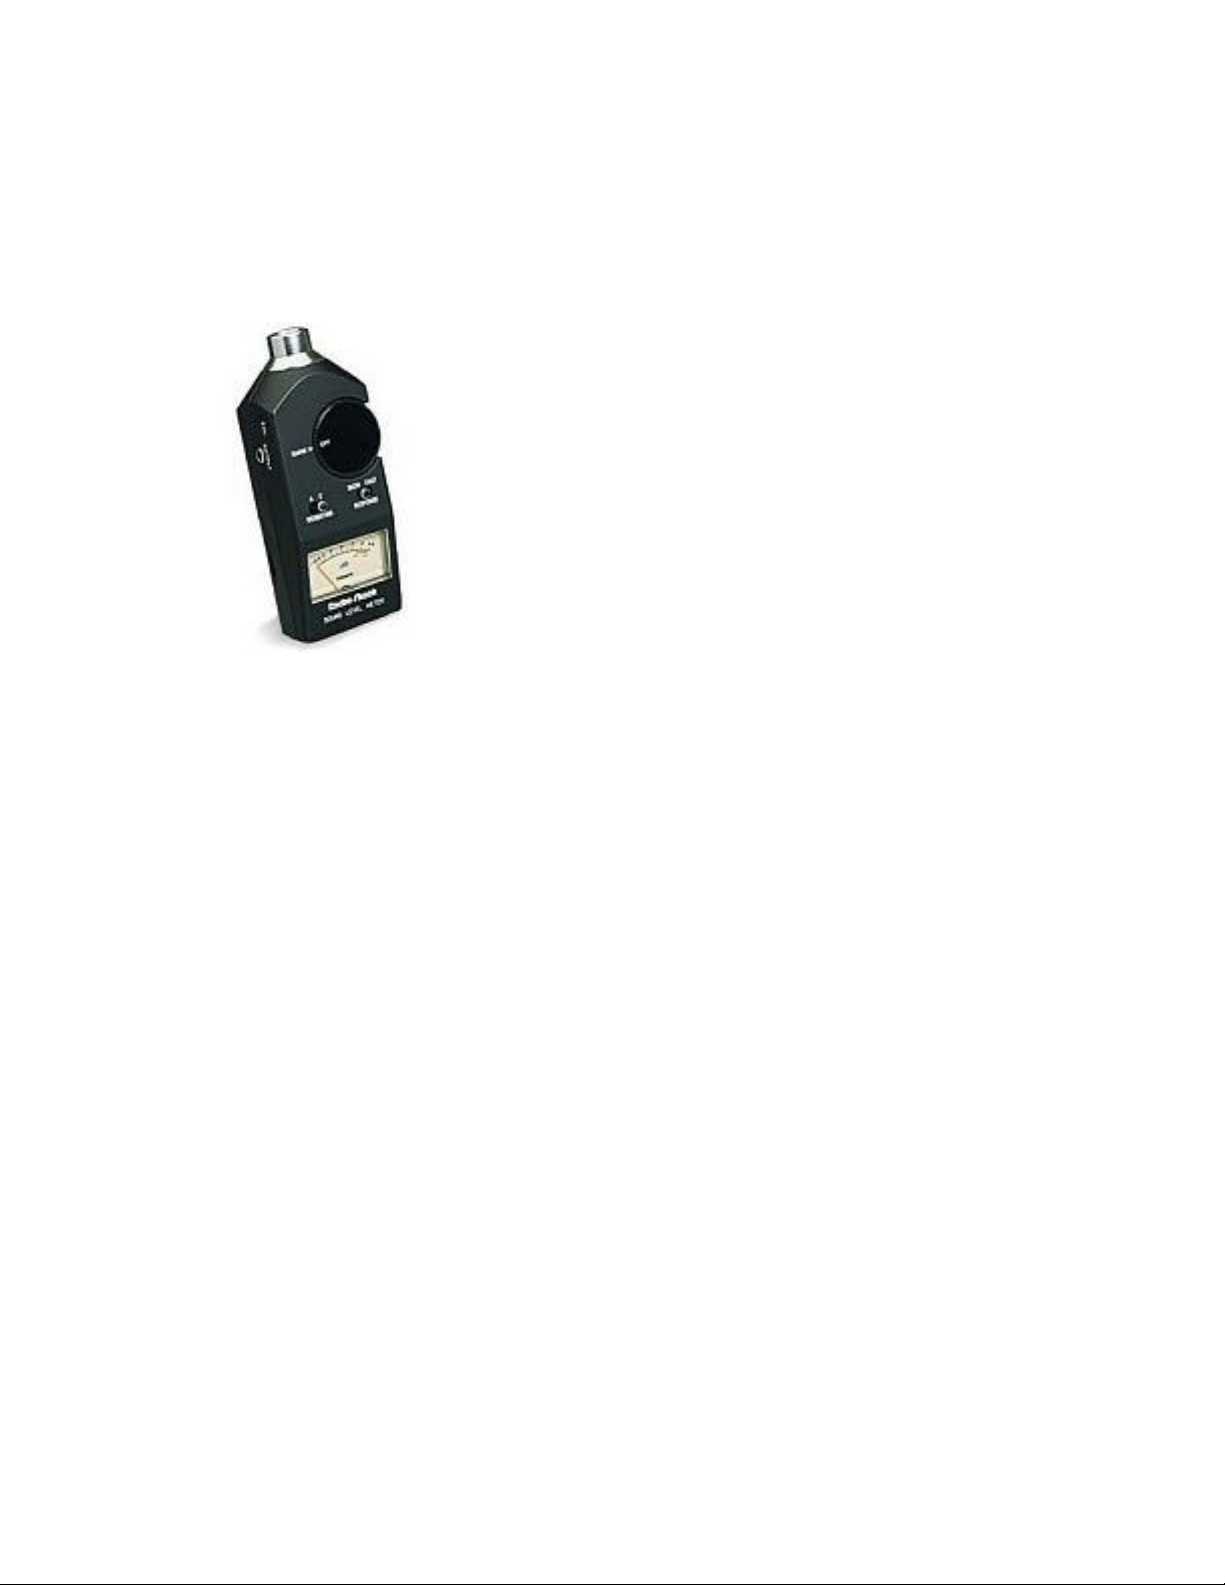
2. Using the Radio Shack SPL meter and AWS
Excel spreadsheet: This method is relatively easy,
inexpensive, and quite accurate. It can be rather time
consuming compared to methods four or five.
3. Using the Radio Shack SPL meter and hand
plotted graphs: Very similar to #2 but you'll have to do
a little math when hand plotting.
4. Using a test system such as ETF, CLIO or
MLSSA: If you have this type of equipment you can run
the measurements quickly and accurately. Usually the
most expensive option. Most of these instruments are extremely powerful and
can have a relatively steep learning curve. Separate measurement
microphone and possibly microphone pre-amp will also be required.
5. Using a RTA (Real Time Analyzer): This is probably the fastest method as
you can see the results of your adjustments on-screen, in real time. RTAs
used to be quite expensive. Computers with soundcards have drastically
changed that! The CD contains a free Demo version of Praxis, which is an
extremely powerful RTA and more. We also provide a link to the relatively
inexpensive, powerful and easy to use RTAs by TrueAudio. Separate
measurement microphone and possibly a microphone pre-amp will also be
required.
4. Using the Radio Shack SPL meter and AWS Excel spreadsheet
Radio Shack Cat No. 33-2050
Sine waves were chosen for EQ setup because of their ease of use, accuracy of
the results, and simplicity.
Please follow the directions below for setting your EQ:
1. The volume control of your speaker system was calibrated to a
nominally "flat" balance at the factory. Depending on your room and
placement, you may need to adjust the relative level of the bass
drivers.
2. Insert the test disc in your CD player. Position the SPL meter at
approximate listening position. The meter should be aimed toward the
Page 5

speakers. Most accurate results will be obtained with the meter
approximately where your head would normally be. A camera tripod
can be used as the SPL meter has ¼ -20” threaded insert on the
bottom.
3. Set the SPL meter to “C” weighting and response to slow.
4. Start with the system volume turned down. Play track number 2 or 3,
(60 Hz for Talisman or 100 Hz for Veritas or Veritas V), and adjust the
volume to read 70dB on the SPL meter.
5. To adjust the relative bass level you will be using track #26 for the
Talisman and LFM or #27 for the Veritas. Play the correct track for
your speaker. Note and record the reading from the SPL meter. Next,
play track #28. Adjust the bass volume control on the AWS until your
meter is reading the same level as it did for track #26 or #27. Your
bass level is now set.
6. Open the “Frequency Response” MS Excel worksheet. Click on the
“Data Entry Sheet” tab at the bottom and print it out.
7. Play tracks 4-25 and write down the measurements in the “Data Entry
Sheet”.
8. Go back and plot the written numbers into the Frequency Response
worksheet.
9. Evaluate the graphs for one or two dominant elevations in the
response. These are your targets for EQ.
10. You have two bands of EQ to use. You may use them individually or
combine them to work on one large peak. For these instructions we'll
do the explanation for using one band of EQ to remove one peak in the
response.
11. Determine the approximate center frequency of the peak in the
response. Peaks are rarely textbook symmetrical so you will have to
make a judgement of where to set your target frequency. Set the
frequency on the EQ to this target.
12. Determine the approximate amplitude of the peak in decibels, (dB).
This is the amount to set your cut at.
13. Determine the approximate width of the peak. Is it relatively broad or
more of a sharp peak? Set the Q toward 40 for a broad peak and
toward 4 for a sharper peak. There is no easy method to "know" what
will be correct. You will need to take another measurement to see if
you need to go with greater or less Q.
Page 6

14. Take another measurement as in steps five and six. Evaluate the
change. Is the center frequency optimum? Is the cut at the right level?
Does the Q need to be higher or lower? Make the desired adjustments
and take another measurement. Don't be surprised if it takes you five
to ten tries or even more to get the flattest possible measurement. You
may want to take a break at some point and do some listening to
evaluate the changes you've made. You may even decide to "retweak" in the future. The goal is to get the most accurate and pleasing
sound your system is capable of. The more time you invest, the more
accurate your results.
15. Go back and do Step #5 again. Having done the equalization you may
find that the balance needs to be re-adjusted.
16. We suggest you mark your measurements on the supplied drawing. If
someone accidentally changes them, you'll be able to get the optimum
settings back without all the work.
17. Relax and enjoy your ACI system!
Page 7

5. Using the Radio Shack SPL meter and hand plotted graphs
Your steps will be the same as above. However, for steps five and six you will
need to manually plot your graph using the supplied graph paper. Be sure to add
or subtract the required correction for the meter.
6. Alternative Means of Measurement and Equalization
Some of you may own or have access to a RTA such as the 1/3 octave unit
manufactured by Audio Control. This type of unit will allow you to quickly see the
changes as you make adjustments. The disadvantage is that 1/3 octave
resolution is rather marginal. We have found 1/6 octave to be ideal for optimizing
systems. These types of analyzers are available as software based systems
using your computer sound card. Another excellent option is the ETF system,
which takes quick, high-resolution measurements of not only frequency, but time
as well.
Software based analyzers are inexpensive, (in some cases free), and very
powerful. That power comes with a price. The learning curve to setup and use
some of these programs can be rather steep. The Praxis demo for example can
do all sorts of accurate audio measurements. It will give you powerful tools that
can help you with far more than just setting up the AWS system. Other factors to
keep in mind; 1) Most of the software programs have certain requirements for the
computer hardware and the soundcard used. 2) Separate measurement
microphone and possibly microphone pre-amp will be required for any software
based RTA or Analyzer.
7. Website based updates
If new information becomes available on the AWS system and system
equalization it will be added at: www.audioc.com/information/aws.htm
8. Supplemental Materials
These are all found on the CD. This manual is provided in HTML format for quick
reference. All files are for download or personal use only. This information and
these files may not be distributed / sold, etc. with out the express written
permission of Audio Concepts, Inc. Copyright 2002
AWS Excel Spreadsheet: Requires Microsoft Excel 97 or newer. Quickly
computes and plots your graphs.
Printable Graph for Hand Plotting: Hard copies are printed in the paper manual
and the file may also be printed.
Page 8

Drawing of AWS Control Panel: Use this copy to mark your final settings. If the
controls are accidentally changed, you'll be able to reset them quickly without
measuring again.
Praxis Files: If interested, go to the Praxis website to see if Praxis will work for
you and if your computer will be able to run the program. Go to:
www.libinst.com. Then, copy the files from the CD to your hardrive and click on
PraxisinstalF to install the program on your computer.
True Audio RTA Audio Analyzer: A great, easy to use soundcard based RTA
at a very fair price. We recommend the 1/6 octave version for setting up the AWS
system and most audio setup work. A free, one-octave version is available for
demo download. This allows you to make sure the program will work on your
system. We recommend getting the free download to see if this might be the
system for you. Go to: www.trueaudio.com
*Note, Audio Concepts, Inc. assumes no responsibilities or liabilities for any of
the software described in this manual. Downloading, installing programs etc. is
done solely at the individual users discretion. ACI staff people are not trained in
installing or using any of these programs and cannot assist with their use.
Page 9

EQ TEST TONES ON DISC
2. 60 sine wave
3. 100 sine wave (Veritas)
4. 16 sine wave
5. 18 sine wave
6. 20 sine wave
7. 22 sine wave
8. 25 sine wave
9. 28 sine wave
10. 32 sine wave
11. 36 sine wave
12. 40 sine wave
13. 45 sine wave
14. 50 sine wave
15. 56 sine wave
16. 63 sine wave
17. 71 sine wave
18. 80 sine wave
19. 89 sine wave
20. 100 sine wave
21. 111 sine wave
22. 125 sine wave
23. 143 sine wave
24. 160 sine wave
25. 200 sine wave
26. 60 Hz warble tone (level matching subwoofer)
27. 150 Hz warble tone (level matching mid) (Veritas)
28. 600 Hz warble tone (level matching woofer) (Veritas)
29. 16-200 Hz sweep short
30. 16-200 Hz sweep long
31. 60-200 Hz sweep short (Veritas)
32. 60-200 Hz sweep long (Veritas)
33. Pink noise
34. White noise
Audio Concepts, Inc.
901 South 4th Street, La Crosse, WI 54601
Phone: (608) 784-4570 Fax: (608) 784-6367
Website: www.audioc.com Email: service@audioc.com
All Rights Reserved 2002
Page 10

Page 11

80
78
76
74
72
70
SPL
68
66
64
62
All Rights, Audio Concepts, Inc. 2002
ACI 901 South 4th Street
AWS Worksheet #Two La Crosse, WI 54601
Manual Plotting For Those Without Excel www.audioc.com
sales@audioc.com
Frequency Response
60
16
18
20
22
25
28
32
36
40
45
50
56
63
71
80
89
100
111
125
143
160
200
Frequency
Frequency 16 18 20 22 25 28 32 36 40 45 50 56 63 71 80 89 100 111 125 143 160 200
Measured SPL
Add 10 7.3 6.2 5.4 4.4 3.8 3 2.5 2 1.7 1.3 1 0.8 0.7 0.5 0.4 0.3 0.25 0.2 0.15 0.1 0
Actual SPL
Page 12

Track 4 5 6 7 8 9 10 11 12 13 14 15 16 17 18 19 20 21 22 23 24 25
FR 16 18 20 22 25 28 32 36 40 45 50 56 63 71 80 89 100 111 125 143 160 200
SPL
Track 4 5 6 7 8 9 10 11 12 13 14 15 16 17 18 19 20 21 22 23 24 25
FR 16 18 20 22 25 28 32 36 40 45 50 56 63 71 80 89 100 111 125 143 160 200
SPL
Track 4 5 6 7 8 9 10 11 12 13 14 15 16 17 18 19 20 21 22 23 24 25
FR 16 18 20 22 25 28 32 36 40 45 50 56 63 71 80 89 100 111 125 143 160 200
SPL
Track 4 5 6 7 8 9 10 11 12 13 14 15 16 17 18 19 20 21 22 23 24 25
FR 16 18 20 22 25 28 32 36 40 45 50 56 63 71 80 89 100 111 125 143 160 200
SPL
Track 4 5 6 7 8 9 10 11 12 13 14 15 16 17 18 19 20 21 22 23 24 25
FR 16 18 20 22 25 28 32 36 40 45 50 56 63 71 80 89 100 111 125 143 160 200
SPL
Track 4 5 6 7 8 9 10 11 12 13 14 15 16 17 18 19 20 21 22 23 24 25
FR 16 18 20 22 25 28 32 36 40 45 50 56 63 71 80 89 100 111 125 143 160 200
SPL
Track 4 5 6 7 8 9 10 11 12 13 14 15 16 17 18 19 20 21 22 23 24 25
FR 16 18 20 22 25 28 32 36 40 45 50 56 63 71 80 89 100 111 125 143 160 200
SPL
 Loading...