

Accuenergy AcuDC 243-300V-A0-P2-C-D, AcuDC 243-1000V-A2-P1-X5-C, AcuDC 243-1000V-A0-P1-C-D, AcuDC 243-1000V-A2-P1-X5-C-D, AcuDC 243-1000V-A0-P1-C User manual
...Page 1

User's Manual
ACUDC 240
DC POWER & ENERGY METER
AcuDC 240 Series Power and Energy Meter
Find Quality Products Online at: sales@GlobalTestSupply.com
www.GlobalTestSupply.com
Page 2

ABOUT ACCUENERGY
Formed in 1998, Accuenergy is a leading producer of power and energy metering
products for the distribution, control and management of electrical energy and other
dynamic processes. Accuenergy’s vision is to make energy usage more dependable and
efficient, and to make energy management more convenient and intelligent. Accuenergy
products are easily integrated into new and existing energy management, automation
and building control systems for intelligent and user-friendly energy systems and are
backed by an industry-leading pre and post sale technical support and manufacturer’s
warranty.
With an emphasis on continuous improvement, innovation and high performance and
cost-effective solutions, Accuenergy has developed a growing global footprint with offices
in Toronto Canada (Headquarter), Los Angeles and Beijing.
WARNINGS GLOSSARY
The following symbols in this manual and on AcuDC 240 series meters are used to provide
warning of danger or risk during the installation and operation of the meters.
Electric Shock Symbol: Carries information about procedures which
must be followed to reduce the risk of electric shock and danger to
personal health.
When this symbol is seen on the meter, consult this user manual. Refer
to Chapter 2 for important safety information regarding mounting and
wiring of the AcuDC meter.
Safety Alert Symbol: Carries information about circumstances which if
not considered may result in injury or death.
Note: Please read this manual carefully before installation, operation and maintenance of
an AcuDC 240 series meter.
Installation and maintenance of the AcuDC 240 meter should only be performed
by qualified, competent professionals who have received training and should have
experience with high voltage and current devices.
ACCUENERGY shall not be responsible or liable for any damages caused by improper
meter installation and/or operation.
IV
Find Quality Products Online at: sales@GlobalTestSupply.com
www.GlobalTestSupply.com
Page 3

TABLE OF CONTENTS
CUSTOMER SERVICE AND SUPPORT .....................................................................II
PRODUCT WARRANTY .................................................................................................III
CHAPTER 1: Introduction to the AcuDC ................................................................1
1.1 Package Contents & Available Accessories ..............................................1
1.2 Introduction and Compliance ......................................................................1
1.2.1 Introduction ........................................................................................................................1
1.2.2 Compliance ........................................................................................................................2
1.3 Applications & Industries ................................................................................2
1.4 Features & Specifications ...............................................................................3
1.4.1 Features .................................................................................................................................3
1.4.2 Specifications ....................................................................................................................3
CHAPTER 2: Installation - Physical Setup............................................................7
2.1 Tools .........................................................................................................................7
2.1.1 Tools for Mounting ..........................................................................................................7
2.1.2 Tools for Wiring ................................................................................................................7
2.2 Mounting ..............................................................................................................7
2.2.1 Tools for Mounting..........................................................................................................8
2.2.2 Mounting I/O Modules Onto Meter ......................................................................9
2.3 Wiring .......................................................................................................................................12
2.3.1 Wiring Control Power ....................................................................................................13
2.3.2 Current Input Wiring ....................................................................................................14
2.3.3 Voltage Input Wiring ....................................................................................................16
2.3.4 Current & Voltage Wiring at the Same Time ...................................................17
2.3.5 Communications Wiring .............................................................................................20
2.4 Removing meter for servicing or maintenance ...................................21
CHAPTER 3: Installation - Configuration Parameter Set-up via display .............24
3.1 Display Panel and Keys ....................................................................................24
3.2 General Parameter Setup ...............................................................................25
3.2.1 Key’s Function in parameters setup .....................................................................26
3.2.2 Configure AcuDC to work with Shunt.................................................................26
3.2.3 Configure AcuDC to work with Current Hall Effect Sensor .....................27
3.2.4 Configure AcuDC to work with Current and Voltage Hall Effect Sensor
28
3.2.5 Clear Energy, Ah and DI Counter ...........................................................................29
V
Find Quality Products Online at: sales@GlobalTestSupply.com
www.GlobalTestSupply.com
Page 4

3.2.6 Set Backlight Brightness ............................................................................................30
3.2.7 Meter Clock Setting ......................................................................................................30
3.2.8 Password Setting ............................................................................................................31
3.3 AcuDC Communication Setup .....................................................................31
3.4 I/O Parameter Setup.........................................................................................32
3.4.1 Meter Clock Setting .......................................................................................................32
3.4.2 RO parameter setting ..................................................................................................34
CHAPTER 4: Viewing Metering Parameters – VIA Display ............................40
4.1 General Display on the AcuDC ......................................................................40
4.2 View the Meter and Load Running Time .................................................43
4.3 View the serial number from the meter ..................................................44
CHAPTER 5: Viewing Real-time Readings Via AcuView Software ...........46
5.1 Connection Setup ..............................................................................................46
5.1.1 Wiring .....................................................................................................................................46
5.1.2 Acuview Software Setup .............................................................................................46
5.2 Configuration Parameters Setup ................................................................49
5.2.1 General Meter Parameter Setting ..........................................................................49
5.2.2 Configure the Data Log using the meter’s onboard memory ...............51
5.2.3 Configure the data log to log the readings on the computer’s memory
53
5.3 Viewing Metering Parameters ......................................................................56
5.3.1 Real-Time Metering .......................................................................................................56
5.3.2 Reading Data Log on Meter’s Onboard Memory ..........................................57
5.3.3 Reading Data Log on the computer’s memory .............................................58
APPENDIX ..........................................................................................................................60
A. Troubleshooting ..................................................................................................60
B. Modbus Register Map ........................................................................................63
B.1 MODBUS-RTU Protocol ...................................................................................................63
B.2 Communication Format ................................................................................................66
B.3 AcuDC240 Communication Address Table .........................................................71
C. Ordering Information ........................................................................................83
D. Glossary of Definitions ......................................................................................84
VI
Find Quality Products Online at: sales@GlobalTestSupply.com
www.GlobalTestSupply.com
Page 5

AcuDC 240 Series
DC Power and Energy Meters
Chapter 1: Introduction to AcuDC
1.1 Package Contents + Available
Accessories
1.2 Introduction and Compliance
1.2.1 Introduction
1.2.2 Compliance
1.3 Applications & Industries
1.4 Features & Specifications
1.4.1 Features
1.4.2 Specifications
Find Quality Products Online at: sales@GlobalTestSupply.com
www.GlobalTestSupply.com
Page 6

Chapter 1: Introduction to AcuDC
CHAPTER 1: INTRODUCTION TO THE ACUDC
1.1 Package Contents & Available Accessories
When you open the package, you will find the following items:
1. AcuDC 240 Meter X1
2. Terminal Blocks X1 - X3 (Depending on model)
3. Installation Clips X4 (Already assembled to the meter)
Available Accessories:
I/O modules (Combinations of digital I/O, analog I/O and relay output)
Current transformers
USB to Serial Converters
1.2 Introduction and Compliance
1.2.1 Introduction
Powerful Yet Cost-Effective
AcuDC 240 series monitors DC voltage, current, power and energy. It supports bidirectional current measurement, and also displays meter running hour and load running
hour. Analog Output applies to DCS system, industrial monitoring and control. AcuDC
240 has a combination of accurate measurement, intelligent multifunction and simple
human machine interface. The cost-effective meter fulfills the requirements of monitoring
and controlling the DC circuit.
Compact and Easy to Install
The dimensions of AcuDC 240 series meet DIN 72X72 requirements. With a mounting
depth of 65mm, the meter can even fit in small drawer type cabinets. It utilizes a self-lock
installation mechanism, eliminating the necessary of fix bolts, which makes installation or
removal quick and convenient.
User Friendly Interface
AcuDC 240 series utilizes a clear high-definition LCD screen with large characters. The
LCD screen comes with a brightness adjustable backlight, which ensures easy observation
of metering data in any environment. With a large LCD screen display, the two keys on the
meter from allow users to observe multiple parameter data at the same time. The meter
parameter settings can be set either via front panel keys or the communication port. The
Parameter settings are saved in the non-volatile EEPROM, which remains when power is
off.
V: 1.0 Revised: Jan. 2018
Find Quality Products Online at: sales@GlobalTestSupply.com
www.GlobalTestSupply.com
1
Page 7

AcuDC 240 Series
V: 1.0 Revised: Jan. 2018
DC Energy & Power meters
High Safety and Reliability
AcuDC 240 series meter was designed according to industrial standards. It can run
reliably under high power disturbance conditions. This meter has been fully tested for
EMC and safety compliance in accordance with multiple international standards. The
casing is highly fire resistant due to high quality, durable engineering plastics.
1.2.2 Compliance
The following table lists the compliances this meter meets:
Safety
Quality Control
Environmental
1.3 Applications & Industries
Conforms to UL Std 61010-1
Certified to CSA Std C22/2 No. 61010-1
CE certified.
Certified to ISO 9001:2008 standard
IEC 60068-2; Nema3 Certified
IP54 Certified
Applications:
• DC meter & metering
Metering of DC consumption and generation of different DC electrical systems
• DC transducer
Installed transducer reads power, energy, voltage, current and amp hour data and
outputs digital pulse and/or analog signals
• DC data logger / data logging
Installed meter reads, records and stores power, energy, voltage, current and amp
hour data for subsequent download, reporting and analysis
Industries:
• Renewable energy & green systems
Generation by solar photovoltaic (PV) arrays, wind turbines, inverter & battery
monitoring, DC consumption of electric vehicle (EV) charging stations
• Transportation Systems
Consumption of rail / railway, subway and trains and transit systems and related DC
equipment
• Telecommunications
Consumption on cell / cellular towers and equipment
• Datacenters
Consumption of data centers and equipment
2
Find Quality Products Online at: sales@GlobalTestSupply.com
www.GlobalTestSupply.com
Page 8

Chapter 1: Introduction to AcuDC
1.4 Features & Specifications
1.4.1 Features
DC power system metering;
Monitor and control power switches;
Alarming and analog output;
Standard 72x72mm, allows for drawer type panel installation;
Three line high-definition LCD display;
Accessible with SCADA, PLC systems;
Easy installation, simple wiring;
Data Logging: Offers 3 configurable historical logs where the all of the metering
parameters can be recorded. The onboard memory is up to 4 MB and each log size is
adjustable.
1.4.2 Specifications
The following tables list the specifications of AcuDC 240 meter.
Parameter Accuracy Resolution Range
Voltage 0.2% 0.001 V 0~1200 V
Current 0.2% 0.001 A 0~±50000 A
Power 0.5% 0.001 kW 0~±60000 kW
Energy 0.5% 0.01 kWh 0~9999999.99 kWh
Drift with
Temperature
Stability 0.5‰/year
Voltage
Input Range
Voltage Direct Input0~1000V; Via Hall Effect Sensor0~1200V
Input Impedance 2MΩ
Load <0.6W
Accuracy 0.2%
<100ppm / °C
V: 1.0 Revised: Jan. 2018
Find Quality Products Online at: sales@GlobalTestSupply.com
www.GlobalTestSupply.com
3
Page 9

AcuDC 240 Series
V: 1.0 Revised: Jan. 2018
DC Energy & Power meters
Voltage
Current
Input Range
Shunt 50~100mV(programmable)
Hall Effect Sensor 0~±5V/0-±4V, 4~20mA/12mA±8mA
Power Consumption 2W(MAX)
Accuracy 0.2%
Digital Input
Type Dry Contact
Isolation Voltage 2500Vac
Environment
Operation Temperature -25°C ~ +70°C
Storage Temperature -40°C ~ +85°C
Humidity 5%~95%Non-condensing
0~±10A(Direct Input, pick up current 0.01A)
0~±50000A(Via Shunt or Hall Effect Sensor, program-
mable range)
Output
Relay Output (RO)
Type Mechanical contact, Form A
Max Load Voltage 250Vac/30Vdc
Max Load Current 3A
On Resistance 100mΩ (Max)
Isolation Voltage 4000Vac
Mechanical Life 5 × 10⁶ times
Digital Output (Photo-Mos)
Load Voltage Range 0~250Vac/dc
Load Current 100mA(Max)
Max Output Frequency 25Hz, 50% duty cycle
Isolation Voltage 2500Vac
Analog Output (AO)
Load Voltage Range 4-20mA/0~20mA; 0~5V/1-5V
Load Current 0.5%
Max Output Frequency
Current type, max load resistance: 750 Ohm Voltage
type, max load current: 20 mA
4
Find Quality Products Online at: sales@GlobalTestSupply.com
www.GlobalTestSupply.com
Page 10

Chapter 1: Introduction to AcuDC
Communication
Type RS485, half duplex, Optical Isolated
Protocol Modbus-RTU
Baud Rate 1200~38400bps
Isolation Voltage 2500VAC
Power Relay Supply
Input
Consumption 3W (typical value)
72 x 72 mm Panel mounted
Table 1-3 lists the functions of AcuDC240 series.
Table 1-3 AcuDC 240 Series
Function AcuDC 241 AcuDC 242 AcuDC 243
Voltage V
Current I
Metering
I/O
Power P
Energy E
Ampere
-Hour
2DI+2AO
2DI+2RO
2DI+2DO
2DI+ ±15Vdc
Ah
Support DI
Count
(P1)100-240Vac, 50/60Hz, 100-300Vdc
(P2) 20-60Vdc
Installation
• •
○ ○ ○
○ ○ ○
○ ○ ○
○ ○ ○
• •
•
•
•
All metering parameters can
be recorded (Voltage, Current,
Data Logging
Communication RS485, Modbus RTU
Display LCD
Dimensions
Find Quality Products Online at: sales@GlobalTestSupply.com
Power, Energy, Ampere-hour, DI
Count); Interval 1 minute; Can
record 4 months
○
○ ○ ○
• • •
72×72×64.5mm (Cutout: 68x68 mm) / 2.835 x 2.835 x 2.539 inch (Cutout:
www.GlobalTestSupply.com
2.677 x 2.677 inch)
V: 1.0 Revised: Jan. 2018
5
Page 11

AcuDC 240 Series
DC Power and Energy Meters
Chapter 2: Installation - Physical Setup
2.1 Tools
2.1.1 Tools for Mounting
2.1.2 Tools for Wiring
2.2 Mounting
2.2.1 How to choose installation place
2.2.2 Mounting I/O modules onto meter
2.2.3 Mounting meter onto switchboard panel
2.3 Wiring
2.3.1 Wiring Control Power
2.3.2 Current input wiring
2.3.3 Voltage input wiring
2.3.4 Current & Voltage wiring at the same time
2.3.5 I/O Module wiring
2.3.6 Communications wiring
2.4 Removing meter for servicing or
maintenance
Find Quality Products Online at: sales@GlobalTestSupply.com
www.GlobalTestSupply.com
Page 12

V: 1.0 Revised: Jan. 2018
Chapter 2: Installation - Physical Setup
CHAPTER 2: INSTALLATION - PHYSICAL SETUP
2.1 Tools
2.1.1 Tools for Mounting
• #2 Flathead Screwdriver
• Wire Cutters
2.1.2 Tools for Wiring
• A 1A/250Vac circuit breaker for the auxiliary power supply loopWire Cutters
• A 1A/250Vac circuit breaker should be used in the voltage input loop.
• Choice of wire of power supply is AWG22-16 or 0.6-1.5mm
• The wire for voltage input is AWG16-12 or 1.3-2.0mm
• The wire size of current input is AWG15-10 or 1.5-2.5mm
The following may be required:
• If using RS485 for communication, use a good quality shielded twisted pair cable,
AWG22 (0.5mm2) or higher
• The wire of digital input should be chosen between AWG22~16 or 0.5~ 1.3mm
• The wire of relay output should be chosen between AWG22~16 or 0.5~1.3mm
• The wire of the digital output circuit should be chosen between AWG22~16 or 0.5~1.3
2
mm
2
2
2
2
2
2.2 Mounting
Considerations When Installing Meters
• Installation of the meter must be performed by qualified personnel only, and should
follow standard safety precautions through the installation procedures. Those
personnel should have appropriate training and experience with high voltage devices.
Appropriate safety gloves, safety glasses and protective clothing are recommended.
• During normal operation, dangerous voltage may be present in many parts of the
meter, including terminals, and any connected I/O (Inputs and Outputs) modules and
their circuits. All primary and secondary circuits can, at times, produce lethal voltages.
AVOID contact with any current-carrying surfaces.
• The meter and its I/O output channels are NOT designed as primary protection
devices and shall NOT be used as primary circuit protection or in an energy limiting
capacity. The meter and its I/O output channels can only be used as secondary
protection. AVOID using the meter under situations where failure of the meter may
cause injury or death. AVOID using the meter for any application where risk of fire
may occur.
7
Find Quality Products Online at: sales@GlobalTestSupply.com
www.GlobalTestSupply.com
Page 13

V: 1.0 Revised: Jan. 2018
AcuDC 240 Series
• All meter terminals should be inaccessible after installation.
• Applying more than the maximum voltage the meter and/or its modules can
withstand will permanently damage the meter and/or its modules. Please refer to the
specifications in section 1.4.1 for all devices before applying voltages.
DC Energy & Power meters
NOTE: If the equipment is used in a manner not specified by the
Alert
Alert
Alert
manufacturer, the protection provided by the equipment may be
impaired.
NOTE: There is no required preventive maintenance or inspection
necessary for safety. However, any repair or maintenance should be
performed by the factory.
DISCONNECT DEVICE: The following part is considered the equipment
disconnect device.
A switch or circuit- breaker shall be included in the installation.
The switch shall be in close proximity to the equipment and within
easy reach of the operator. The switch shall be marked as the
disconnecting device for the equipment.
2.2.1 Tools for Mounting
Note: Before installation, please check the environment, temperature and humidity to
ensure the AcuDC 240 series meter is being placed in a proper place.
1. Temperature
AcuDC 240 operation temperature is -25°C ~ 70°C, which will accommodate most user
Please Note: It can influence the meter life negatively if the meter operates under
extremely high or extremely low temperature environments. AcuDC 240 storage
temperature is -40°C ~ 85°C.
2. Humidity
5% to 95% non-condensing
3. Location
AcuDC 240 series meter should be installed in a dry and dust free environment. Avoid
exposing meter to excessive heat, radiation and high electrical noise sources.
8
Find Quality Products Online at: sales@GlobalTestSupply.com
www.GlobalTestSupply.com
Page 14

V: 1.0 Revised: Jan. 2018
Chapter 2: Installation - Physical Setup
2.2.2 Mounting I/O Modules Onto Meter
If the meter is equipped with an I/O module, you need to mount the module onto meter
before installing the meter.
Installation Method
With the link pins, I/O module is linked to the meter.
1. Insert the mounting clips to the counterpart of AcuDC 240 meter, and then press the
I/O module lightly, so linking is established, as shown in Fig 2-2.
(A)
(B)
(C)
Find Quality Products Online at: sales@GlobalTestSupply.com
www.GlobalTestSupply.com
(D)
9
Page 15

V: 1.0 Revised: Jan. 2018
AcuDC 240 Series
2. Tighten the installation screws.
Note: Install I/O Module carefully to avoid damage; under no circumstances should any
installation be done with the meter powered on. Failure to do so may result in injury or
death.
2.2.3 Mounting Meter Onto Switchboard Panel
Appearance and Dimensions
DC Energy & Power meters
Fig 2-3 AcuDC 240 Appearance
Table 2-1 Part Name of AcuDC 240
Part Description
1. Casing High intensity fire resistant engineering plastics
2. Front Casing Visible portion after mounting onto a panel
3. Display Large LCD display
4. Key Two keys are used to select display and set
5. Voltage and Current Input Terminals Used for voltage and current input
6. Communication Terminals Communication output
7. I/O Module Optional I/O module
8. I/O Terminal Optional I/O terminals, including 2DI, 2AO/2RO
9. Power Supply Terminal Power supply terminal
10. Installation Clips Used for securing the meter to the panel
Fig 2-4 AcuDC 240 Dimensions
10
Find Quality Products Online at: sales@GlobalTestSupply.com
www.GlobalTestSupply.com
Page 16

V: 1.0 Revised: Jan. 2018
Chapter 2: Installation - Physical Setup
Installation Steps
AcuDC 240 series meter is generally installed into the switchboard panel.
1. Cut a square hole (Standard DIN). See figure 2-5 for dimensions. Unit:mm
Fig 2-5 Panel Cutout
2. Remove the clips (10) from the meter, and insert the meter into the square hole from
the front side, as shown in following figures.
a. Panel Cutout
c. Putting back the Clips at the back
of the Panel
Find Quality Products Online at: sales@GlobalTestSupply.com
www.GlobalTestSupply.com
b. Inserting the Meter to the Panel
Square Hole
d. Installation Completed
11
Page 17

V: 1.0 Revised: Jan. 2018
AcuDC 240 Series
2.3 Wiring
Terminal Strips
There are 3 groups of current terminal strips. There will be another terminal strip if the
meter is connected with the I/O module.
DC Energy & Power meters
a. Voltage and Current Terminal Strip
c. I/O Terminal Strip (2DI+2AO)
e. I/O Terminal Strip (2DI+±15V)
Fig 2-7 AcuDC 240 Terminal Strip
Safety Earth Connection
b. Power Supply Terminal Strip
d. I/O Terminal Strip(2DI+2RO/2DO)
f. Communication Terminal Strip
Before setting up the meter’s wiring, please make sure that the
switchgear has an earth ground terminal. Connect both the
meters and the switchgear’s ground terminal together.
This ground terminal symbol is used in this user’s manual.
12
Find Quality Products Online at: sales@GlobalTestSupply.com
www.GlobalTestSupply.com
Page 18

V: 1.0 Revised: Jan. 2018
Chapter 2: Installation - Physical Setup
2.3.1 Wiring Control Power
CAUTION: Make sure you check the power supply option you have before energizing the
meter. Check the silver sticker on the side of the meter to confirm what power supply
option you have.
The silver sticker on the side of the meter contains information such as the model
number, power supply, voltage/current inputs and serial number.
To power the meter, you need to connect the power supply terminal as shown below.
This will be connected based on the two power supply options available, that is:
1A FUSE
Power Supply
L/+
11
12
N/-
AcuDC 240
13
G
Fig 2-9 Power Supply Wiring
1. The Standard option: 100-240Vac, 50/60Hz or 100-300Vdc
2. The Low Voltage DC option: 20-60Vdc
The independent power supply circuit loop must have a fuse or air circuit breaker. The
fuse could be 1A/250Vac, time delay type. If circuit breaker is used, a CE certified product
with compliance of IEC947 is recommended.
Terminal G (13) must be connected to the ground for the safety.
An isolated transformer or EMC filter should be used in the auxiliary power supply loop if
power quality problem exists in the power supply, as shown in following figure.
Power Supply
1A FUSE
L
L
N
N
G
G
11
12
13
L/+
N/-
AcuDC 240
G
EMC lter
2-10 Power Supply Wiring with EMC Filter
Choice of wire power supply is AWG16-22 or 0.6-1.5 mm
Find Quality Products Online at: sales@GlobalTestSupply.com
www.GlobalTestSupply.com
2
.
13
Page 19

V: 1.0 Revised: Jan. 2018
AcuDC 240 Series
2.3.2 Current Input Wiring
AcuDC 240 meter current can be wired in three different ways: direct wiring, wiring using
a shunt and wiring using a current Hall Effect sensor.
NOTE: When wiring using a shunt or Hall Effect Sensor these must be wired on the
negative terminal of the load that is being measured.
Choice of wire current input is AWG15-16 or 1.5-2.5 mm2 or equivalent resistance wire.
DC Energy & Power meters
Vdc+Vdc-
Meter
I/O terminal strip
2423222120191817
V+GNDV-NCDI22DI21DI12DI11
shunt
Voltage, Current, Terminal Strip
Fig 2-11a Wiring using a Shunt
Meter
I/O terminal strip
Voltage, Current, Terminal Strip
123456
U+NCU-NCI+I-
Load
Vdc-
2423222120191817
V+GNDV-NCDI22DI21DI12DI11
123456
U+NCU-NCI+I-
Vdc+
Load
Fig 2-11b Direct Wiring
14
Find Quality Products Online at: sales@GlobalTestSupply.com
www.GlobalTestSupply.com
Page 20

V: 1.0 Revised: Jan. 2018
Meter
I/O terminal strip
Voltage, Current, Terminal Strip
Fig 2-11 C Wiring using a Hall Effect Sensor
Chapter 2: Installation - Physical Setup
Hall Eect Sensor
2423222120191817
V+GNDV-NCDI22DI21DI12DI11
123456
U+NCU-NCI+I-
Fig 2-11 Current Input Wiring
Hall Eect Sensor Terminal
Vdc+Vdc-
Current
1
2
3
4
Load
Table 2-2 Accuenergy Line of Shunts/Hall Effect Sensors for Measuring Current
(Works with AcuDC 243 A1 Current Input Option)
Shunt
Rated Input: 50A
Output: 75mV
Rated Input: 100A
Output: 75mV
Rated Input: 200A
Output: 75mV
Rated Input: 500A
Output: 75mV
Rated Input: 1000A
Output: 75mV
Rated Input: 1500A
Output: 75mV
Rated Input: 2000A
Output: 75mV
(Works with AcuDC 243 A2 Current Input Option)
Hall Effect Sensor
Rated Input: 50A
Output: 4-20mA
Window Size: 21mm
Rated Input: 100A
Output: 4-20mA
Window Size: 21mm
Rated Input: 200A
Output: 4-20mA
Window Size: 21mm
Rated Input: 400A
Output: 4-20mA
Window Size: 40mm
Rated Input: 600A
Output: 4-20mA
Window Size: 40mm
Rated Input: 1000A
Output: 4-20mA
Window Size: 40mm
NOTE: For measuring higher currents or larger window size openings, please
15
Find Quality Products Online at: sales@GlobalTestSupply.com
www.GlobalTestSupply.com
Page 21

V: 1.0 Revised: Jan. 2018
AcuDC 240 Series
Vdc+
2.3.3 Voltage Input Wiring
AcuDC 240 series meter Voltage can be wired in two different ways: direct wiring and
wiring using a voltage Hall Effect sensor. Choice of wire for the voltage input is AWG16-22
or 0.6~1.5 mm
DC Energy & Power meters
2
. Please see the wiring diagrams for details as shown in fig 2-12.
Meter
Vdc-
I/O terminal strip
Voltage, Current, Terminal Strip
Fig 2-12a Wiring using a Voltage Hall Effect Sensor
Meter
I/O terminal strip
Hall Eect Sensor
2423222120191817
V+GNDV-NCDI22DI21DI12DI11
+
IN-
M
123456
U+NCU-NCI+I-
IN+
T
Vdc+Vdc-
2423222120191817
V+GNDV-NCDI22DI21DI12DI11
Voltage, Current, Terminal Strip
123456
U+NCU-NCI+I-
Load
Fig2-12b-Direct Wiring
Fig2-12-Voltage Input Wiring
16
Find Quality Products Online at: sales@GlobalTestSupply.com
www.GlobalTestSupply.com
Page 22

V: 1.0 Revised: Jan. 2018
Chapter 2: Installation - Physical Setup
2.3.4 Current & Voltage Wiring at the Same Time
You can wire the voltage and current for different systems based on the different
methods above. Here are the common wiring methods used:
1. Direct voltage connection and a direct current connection see 2-13a.
2. Direct voltage connection and a current connection using a shunt see 2-13b.
3. Direct voltage connection and a current connection using a current Hall Effect sensor
see 2-13c.
The different wiring diagrams are shown below:
Meter
I/O terminal strip
Voltage, Current, Terminal Strip
Fig 2-13a Direct Wiring
Meter
I/O terminal strip
Vdc+Vdc-
2423222120191817
V+GNDV-NCDI22DI21DI12DI11
123456
U+NCU-NCI+I-
Load
Vdc+Vdc-
2423222120191817
V+GNDV-NCDI22DI21DI12DI11
shunt
Voltage, Current, Terminal Strip
123456
U+NCU-NCI+I-
Load
Fig 2-13b Voltage and Current Wiring Using a Shunt
17
Find Quality Products Online at: sales@GlobalTestSupply.com
www.GlobalTestSupply.com
Page 23

V: 1.0 Revised: Jan. 2018
AcuDC 240 Series
Voltage, Current, Terminal Strip
DC Energy & Power meters
Meter
Hall Eect Sensor
I/O terminal strip
2423222120191817
V+GNDV-NCDI22DI21DI12DI11
1
2
3
123456
U+NCU-NCI+I-
Fig 2-13c Voltage and Current Wiring Using Current Hall Effect Sensor
4
Load
Vdc+Vdc-
Meter
I/O terminal strip
Voltage, Current, Terminal Strip
Fig 2-13 d Voltage and Current Wiring Using Hall Effect Sensors
Fig 2-13-Typical Voltage and Current wiring diagram for systems
Hall Eect Sensor
Voltage
Hall Eect Sensors
+
IN-
M
2423222120191817
IN+
T
Vdc+Vdc-
V+GNDV-NCDI22DI21DI12DI11
1
2
3
123456
U+NCU-NCI+I-
4
Current
Hall Eect Sensors
Load
18
Find Quality Products Online at: sales@GlobalTestSupply.com
www.GlobalTestSupply.com
Page 24

V: 1.0 Revised: Jan. 2018
Chapter 2: Installation - Physical Setup
Digital Input
AcuDC 240 optional I/O module is equipped with two dry contact digital inputs. The
terminals are (17), (18), (19) and (20), as shown in figure 2-7. The Circuit is simplified as:
When the switch is open, there is no current flowing into the diode side of the optical
coupler, the triode is off, OUT is in low state. When the switch is closed, there is current
flowing into the diode side, the triode is on, OUT is in high state. In this way, the ‘high’ and
‘low’ state of OUT corresponding to ‘closed’ and ‘’open’ state of the switch.
The I/O module has built in power supply therefore the digital input does not require an
external power supply.
2
DI wire may choose AWG22-16 or 0.5-1.5 mm
Analog Output
AcuDC 240 I/O module offers two Analog Output modes, which are the current output
0-20mA/4-20mA(max 24mA) mode, and the voltage output 0-5V/1-5V(max 6V) mode, as
shown in figure 2-15.
NOTE: Each module can only has one type of output, please specify when ordering.
.
Fig 2-15 Analog Output Wiring
19
Find Quality Products Online at: sales@GlobalTestSupply.com
www.GlobalTestSupply.com
Page 25

V: 1.0 Revised: Jan. 2018
AcuDC 240 Series
Relay Output
The AcuDC 240 series I/O option has two relay outputs, which are terminal (21), (22) and
(23), (24) as shown in Fig 2-7. They can be used to remotely control circuit breakers.
The relay outputs are form A (normally open) electromagnetic relay. The nodal capacity is
3A/250 Vac or 3A/30Vdc. If the coil current is high, a medium relay is recommended.
DC Energy & Power meters
2.3.5 Communications Wiring
AcuDC 240 series meter uses RS485 serial communication and the Modbus RTU protocol.
The terminals of communication are A, B and S (14, 15 and 16). A is differential signal +, B is
differential -, and S is connected to the shield of twisted pair cable. The overall length of
the RS485 cable connecting all devices cannot exceed 1200m (4000ft). Utilizing a large
number of RS485 devices and utilizing a high baud rate will make the communication
range shorter. AcuDC 240 works as a Slave device. Master device can be PC, PLC, Data
Acquisition Device, or RTU.
Suggestions to improve communication quality:
A high-quality Shielded Twisted Pair cable, AWG22(0.6mm2) or larger diameter cable, is
recommended. Two cables should be in different colors.
• Pay attention to ‘single point earthling’. Make sure that there is only one point of the
shielding connected to ground in a single communication link.
• Every terminal A(+) should be connected to terminal A(+), terminal B(-) to terminal B(-
), or it will influence the network, or even damage the communication interface.
• The connection topology should avoid ‘T’ type which means there is a new branch
and it does not begin from the beginning point.
• Keep communication cables away from sources of electrical noise whenever possible.
20
Find Quality Products Online at: sales@GlobalTestSupply.com
www.GlobalTestSupply.com
Page 26

V: 1.0 Revised: Jan. 2018
Chapter 2: Installation - Physical Setup
When using a long communication cable to connect several devices, an anti signal
reflecting resistor (typical value 120Ω-300 Ω/0.25W) is normally added to the end of the
cable beside the last meter if the communication quality is distorted.
Use RS485 converter with optical isolated output and surge protection.
RS485 Converter
VCCGNDRDX-RDX+T/R-T/R+
Fig 2-17 Communications Wiring
Communication
Terminal Block
S
Meter
16
15
14
2.4 Removing meter for servicing or maintenance
Power Supply Inputs
The wires carrying power into the AcuDC 240 meter must be de-energized regardless of
whether the meter is powered by an independent source or by the measured load line.
De-energize the wires by turning off the switchgear (disconnect switch, breaker or fuse)
leading to the terminal block for pins 11 through 13. The terminal block can then be safely
removed.
NOTE: Removing the terminal block without turning off the
switchgear switch may expose the operator to visible/bare wires
that are still connected to dangerously high voltage levels. This
may cause injury or death.
Voltage Inputs
1. Preparing for Safe Removal
De-energize the leads into the voltage pins by turning off the switchgear.
NOTE: Removing the voltage leads without turning off the
switchgear will expose the operator to dangerously high voltage
levels. This may cause injury or death.
2. Disconnecting the Voltage Inputs
Using a #2 flathead screw driver, turn each of the screws on pins 1 and 3 counterclock wise. Stop turning when the wires can be easily removed from their
housing.
21
Find Quality Products Online at: sales@GlobalTestSupply.com
www.GlobalTestSupply.com
Page 27

V: 1.0 Revised: Jan. 2018
AcuDC 240 Series
Current Inputs
1. Preparing for Safe Removal
If the meter was wired directly in series to the current carrying lines without the use of a
shunt/Hall effect sensor then the operator must de-energize the circuit before removing
the circuit wires from the AcuDC meter.
2. Disconnecting the current inputs
Using a #2 flat head screw driver, screw driver, turn the screws on pins 5 and pin 6
counter-clock wise. Stop turning when the wire can be easily removed from its housing.
Cleaning the Meter
ACCUENERGY recommends using a dry cloth to wipe the meter.
DC Energy & Power meters
22
Find Quality Products Online at: sales@GlobalTestSupply.com
www.GlobalTestSupply.com
Page 28

AcuDC 240 Series
DC Power and Energy Meters
Chapter 3: Installation - Configuration
parameter set-up via display
3.1 Display panel and keys
3.2 General parameter setup
3.2.1 Key’s function in parameters setup
3.2.2 Configure AcuDC to work with shunt
3.2.3 Configure AcuDC for current
hall effect sensor
3.2.4 Configure AcuDC for current and
hall effect sensor
3.2.5 Clear energy Ah and DI counter
3.2.6 Set backlight brightness
3.2.7 Meter clock setting
3.2.8 Password setting
3.3 AcuDC Communication Setup
3.4 I/O Parameter Setup
3.4.1 AO parameter setting
3.4.2 RO parameter setting
Find Quality Products Online at: sales@GlobalTestSupply.com
www.GlobalTestSupply.com
Page 29

V: 1.0 Revised: Jan. 2018
AcuDC 240 Series
CHAPTER 3: INSTALLATION - CONFIGURATION PARAMETER
SET-UP VIA DISPLAY
3.1 Display Panel and Keys
The front of the AcuDC 240 series meter consists of an LCD screen and two control keys.
All the display segments are illustrated in Fig 3-1. Users should note that all the segments
will not display in a single page under normal conditions.
There are two keys on the front panel, marked as ‘F’ key and ‘V/A’ key, which are used to
display different parameter data and parameter settings.
DC Energy & Power meters
4
SET
1
2
1
kV
kA
kW
MW
2
3
Number Display Description
1
2
3
kV, kA, kW, MW, Hz, kvar, Mvar, kVA, MVA,
3
Fig 3-1 All Display Segments
kWh, kvarh, kVAh
kWh
Display data of voltage, current, power and
energy
Data Unit
No Icon: no communication
One icon: query sent
Two icons: query sent and response received
4
24
Find Quality Products Online at: sales@GlobalTestSupply.com
www.GlobalTestSupply.com
Setting mode: Indicates the meter is in
Setting Mode
Page 30

V: 1.0 Revised: Jan. 2018
Chapter 3: Installation - Conguration Parameter Set-up
3.2 General Parameter Setup
Press ‘F’ and ‘V/A’ simultaneously whiles in the metering display mode to get to the
system parameter setting mode. In parameter setting mode, pressing ‘F’ and ‘V/A’
simultaneously will exit the system parameter setting mode and return to the metering
data mode.
General parameter setup will define the general operating characteristics, such as current
range setting, shunt current output range setting, rated voltage of voltage Hall Effect
sensor, reset energy, Ah and DI counter, meter clock setting, and password reset etc., as
shown in table 3-2.
NOTE: Some of these settings will vary depending on the model number and firmware
version of the meter.
Label Paramters Default Options Description Note
Communication
parameter setup
Shunt/Hall Effect
Sensor Parameter
Setup
Hall Effect Sensor
Setup
Energy, Ah and
DI counter clear
setup
Communica-
tion address
Baud Rate 19200
Parity Non1
Current input
of the shunt
/ hall effect
sensor
Current
output of the
shunt
output range
of the current
Hall Effect
Sensor
rated voltage
of the Voltage
Hall Effect
Sensor
output range
of the voltage
Hall Effect
Sensor
Energy
delete(energy
clear)
1 1 ~ 247
1200;
2400;
4800;
9600;
19200;
38400
even;
odd;
non1;
non2
20
100
0 0; 1
0 0; 1
NO
20 ~
50000A
50 ~
100mV
0 ~ 3000V
NO;
Yes
The address can
be any integer
between 1~247
Data Transmission
Rate
0: 4~20mA/0~±5V
1:
4~12-20mA/0~±4V
0: 0 ~ ±5V;
1: 0 ~ ±4V
No: energy not
cleared;
Yes: clear energy
to 0
Assign different ad-
dresses to meters on
same bus
All devices on the
same communica-
tion bus must use the
same baud rate
All devices on the
same communica-
tion bus must use the
same parity
Only indirect current
measurement has this
screen
Corresponds to the
output range of the
shunt
Only meter with indi-
rect voltage measure-
ment has this screen.
25
Find Quality Products Online at: sales@GlobalTestSupply.com
www.GlobalTestSupply.com
Page 31

V: 1.0 Revised: Jan. 2018
AcuDC 240 Series
DC Energy & Power meters
Label Paramters Default Options Description Note
Energy, Ah
and DI counter clear setup
Brightness
Setup
Meter Clock
Setup
Password
Setup
DI counter
delete(DI
counter clear)
Backlight
brightness
Date 1 ~ 31
Time 0 ~ 59 24-hour clock
Password 0000
NO
5 1 ~ 5
NO;
Yes
4
Digitals
No: means DI
counter not
cleared DI;
Yes: clear DI
counter to 0
1: minimum light
level;
5: maximum light
level
Year/month/ date
3.2.1 Key’s Function in parameters setup
Press ‘F’ and ‘V/A’ simultaneously whiles in the metering display mode to get to the
system parameter setting mode. In parameter setting mode, pressing ‘F’ and ‘V/A’
simultaneously will exit the system parameter setting mode and return to the metering
data mode.
In the setting mode:
• ‘V/A’ can be used to confirm changes or go to the next screen
• ‘F’ can be used to change a setting or enter edit mode. A digit
When in edit mode:
• Press ‘F’ to increase the number of the flashing digit
• Press ‘V/A’ to switch the flashing digit
• Press ‘V/A’ on the last digit to confirm the change; the cursor should stop flashing.
Once you are in the settings mode, you will be required to type in a password on the
‘PASS’ screen.
• Enter your password or leave it as default ‘0000’ if it wasn’t changed.
• Press ‘V/A’ to enter the system parameter settings mode.
3.2.2 Configure AcuDC to work with Shunt
If the meter is wired to use a shunt to measure the current, you need to configure the full
range current setting and shunt output range in the AcuDC so that it can read accurately
from the shunt.
26
Find Quality Products Online at: sales@GlobalTestSupply.com
www.GlobalTestSupply.com
Page 32

V: 1.0 Revised: Jan. 2018
Chapter 3: Installation - Conguration Parameter Set-up
Press ‘F’ and ‘V/A’ simultaneously whiles in the metering display mode to get to the
system parameter setting mode. In the parameter setting mode, Press ‘V/A’ until you get
to the ‘I In’ screen. Enter the rated current input of the shunt in this screen.
SET
Press ‘F’ to change this setting. A digit will begin to flash and you
will enter the edit mode. Press ‘F’ to increase the value of the
flashing digit and press ‘V/A’ to switch the flashing digit. Press
‘V/A’ when on the last digit to confirm the change; the cursor will
Fig 3-2 Full range
current setting
NOTE: The setting can be configured in the range of 20-50000A.
NOTE: Only indirect current wiring has this screen.
stop flashing at this point
SET
Press ‘F’ and ‘V/A’ simultaneously whiles in the metering display
mode to get to the system parameter setting mode. In the
parameter setting mode, press ‘V/A’ until the screen ‘I o’ displays.
This setting corresponds to the output range of the shunt. Press
‘F’ to change this setting. The first digit will begin to flash. Press
Fig 3-3 Full range
shunt setting
‘F’ to increase the value of the flashing digit. Use ‘V/A’ to switch
the flashing digit. Press ‘V/A’ to confirm the change on the last
flashing digit to go to the next screen.
NOTE: The setting can be configured in the range of 50-100mV.
3.2.3 Configure AcuDC to work with Current Hall Effect Sensor
If the meter is wired to measure current using a Hall Effect sensor, you will have to
configure the full range current setting and Current Hall Effect sensor output range in the
AcuDC, so that it can read accurately from the Hall Effect Sensor. To change the settings
from the meter’s display, first get to the parameter setting mode.
27
Find Quality Products Online at: sales@GlobalTestSupply.com
www.GlobalTestSupply.com
Page 33

V: 1.0 Revised: Jan. 2018
AcuDC 240 Series
DC Energy & Power meters
SET
Refer to section 3.2.2 configure AcuDC to work with Hall Effect
Sensor, first set the full range current setting as shown in Fig
3-2. Press ‘F’ and ‘V/A’ simultaneously whiles in the metering
display mode to get to the system parameter setting mode. In
the parameter setting mode, Press ‘V/A’ until you get to the ‘I In’
Fig 3-4 Current Hall
Effect sensor setting
screen as shown in Fig 3-2. Enter the rated current input of the
shunt in this screen. After setting up the current range, press
‘V/A’ until the screen ‘I P’ displays. This setting corresponds to the
output range of the Hall Effect Sensor. Press ‘F’ to change this
setting and to select required output. Press ‘V/A’ to confirm this
setting; the cursor will stop flashing at this point.
NOTE: The default setting is ‘0’ for 4~20mA/0~±5V. The other mode is ‘1’ for
4-12~20mA/0~±4V.
3.2.4 Configure AcuDC to work with Current and Voltage Hall Effect Sensor
If the meter is wired to measure current and voltage using a current hall effect sensor and
voltage hall effect sensor respectively, You need to configure the settings in the AcuDC so
that it can read accurately from both Hall Effect Sensors.
Refer to section 3.2.2 configure AcuDC to work with shunt, first set up the current input
range as shown in Fig 3-2 full range current setting.
SET
After setting up the current range, press ‘V/A’ to go to the next
screen, as shown in Fig 3-5. This will be the ‘I P’ screen. This
setting corresponds to the output range of the current Hall
Effect Sensor. Press ‘F’ to change this setting and to select
required output. Press ‘V/A’ to confirm this setting; the cursor will
Fig 3-5 Current Hall
stop flashing at this point.
Effect sensor setting
NOTE: The default setting is ‘0’ for 4~20mA/0~±5V. The other mode is ‘1’ for
4-12~20mA/0~±4V.
28
Find Quality Products Online at: sales@GlobalTestSupply.com
www.GlobalTestSupply.com
Page 34

V: 1.0 Revised: Jan. 2018
Chapter 3: Installation - Conguration Parameter Set-up
SET
Fig3-6 Range
Voltage setting
After setting up the output range of the Current Hall Effect
Sensor, as shown in Fig 3-5, press ‘V/A’ to go to the next screen.
This will be the ‘U In’ screen, as shown in Fig 3-6. Enter the
rated voltage of the Voltage Hall Effect Sensor. Press ‘F’ to
change this setting. A digit will begin to flash and you will
enter edit mode. Press ‘F’ to increase the value of the flashing
digit. Press ‘V/A’ to switch the flashing digit. Press ‘V/A’ when
on the last digit to confirm the change; the cursor will stop
flashing at this point.
SET
After setting up the rated voltage of the voltage Hall Effect
Sensor, as shown in Fig 3-6, press ‘V/A’ to go to the next screen.
This will be the ‘U P’ screen. This setting corresponds to the
output range of the voltage Hall Effect Sensor. Press ‘F’ to
change this setting and to select required output. Press ‘V/A’
Fig 3-7 Voltage Hall
Effect Sensor setting
to confirm this setting; the cursor will stop flashing at this
point.
NOTE: The default setting is ‘0’: 0~±5V. The other mode is ‘1’: for 0~±4V.
3.2.5 Clear Energy, Ah and DI Counter
SET
To clear the readings from the meter display mode, first get
to the Setting mode. Press ‘F’ and ‘V/A’ simultaneously whiles
in the metering display mode to get to the system parameter
setting mode. In parameter setting mode, press ‘V/A’ until
you get to the ‘EdEL’ screen, as shown in Fig 3-8. The screen
Fig 3-8 Clear Energy
displays ‘No’, which means energy not cleared. Press ‘F’ twice
and it will show ‘YES’, which means ‘clear energy’, and the
energy will be cleared to 0. After you choose ‘YES’ or ‘NO’,
press ‘V/A’ to confirm and go to the next screen.
SET
Press ‘F’ and ‘V/A’ simultaneously whiles in the metering
display mode to get to the system parameter setting mode. In
parameter setting mode, press ‘V/A’ until you get to the ‘AdEL’
screen, as shown in Fig 3-9. The screen displays ‘No’, which
means charge not cleared. Press ‘F’ twice and it will show
Fig 3-9 Clear Ah
‘YES’, which means clear charge Ah, and the charge Ah will
be cleared to 0. After you choose ‘YES’ or ‘NO’, press ‘V/A’ to
confirm and go to the next screen.
29
Find Quality Products Online at: sales@GlobalTestSupply.com
www.GlobalTestSupply.com
Page 35

V: 1.0 Revised: Jan. 2018
AcuDC 240 Series
DC Energy & Power meters
SET
Press ‘F’ and ‘V/A’ simultaneously whiles in the metering
display mode to get to the system parameter setting mode. In
parameter setting mode, press ‘V/A’ until you get to the ‘ddEL’
screen, as shown in Fig 3-10. The screen displays ‘No’, which
means DI counter not cleared’. Press ‘F’ twice and it will show
Fig 3-10 DI Counter
Reset
‘YES’, which means clear Di counter , and DI counter will be
cleared to 0. After you choose ‘YES’ or ‘NO’, press ‘V/A’ to confirm
and go to the next screen.
3.2.6 Set Backlight Brightness
To set the backlight brightness from the meter display mode, first get to the Setting
mode.
SET
Press ‘F’ and ‘V/A’ simultaneously whiles in the metering
display mode to get to the system parameter setting mode.
In the parameter setting mode, press ‘V/A’ until you get to the
‘bL’ screen, as shown in Fig 3-11. There are 5 levels backlight
brightness. ‘1’ is minimum light level and ‘5’ is maximum light
Fig 3-11 Backlight
Brightness Setting
level. Press ‘F’ to select and press ‘V/A’ to confirm and go to the
next screen.
3.2.7 Meter Clock Setting
SET
Press ‘F’ and ‘V/A’ simultaneously whiles in the metering
display mode to get to the system parameter setting mode. In
parameter setting mode, press ‘V/A’ until you get to the ‘dATE’
screen, as shown in Fig 3-12. Press ‘F’ to change this setting. A
digit will begin to flash and you can change the number. Press
Fig 3-12 Date
Adjustment
‘F’ to increase the value of the flashing digit. Press ‘V/A’ to switch
the flashing digit. Press ‘V/A’ when on the last digit to confirm
the change; the cursor will stop flashing at this point. Press ‘V/A’
to confirm and go to the time setting screen.
SET
Press ‘F’ and ‘V/A’ simultaneously whiles in the metering display
mode to get to the system parameter setting mode. In the
parameter setting mode, press ‘V/A’ until you get to the ‘TinE’
screen, as shown in Fig 3-13. The meter uses the 24-hour clock
system. The time shown in Fig 3-15 is 14:19:52. Press ‘F’ to change
Fig 3-13 Time
Adjustment
this setting. A digit will begin to flash and you can change the
number. Press ‘F’ to increase the value of the flashing digit. Press
‘V/A’ to switch the flashing digit. Pressing ‘V/A’ when on the last
digit will confirm the change; the cursor will stop flashing at this
point. Press ‘V/A’ to confirm and go to the next screen.
30
Find Quality Products Online at: sales@GlobalTestSupply.com
www.GlobalTestSupply.com
Page 36

V: 1.0 Revised: Jan. 2018
Chapter 3: Installation - Conguration Parameter Set-up
3.2.8 Password Setting
SET
Press ‘F’ and ‘V/A’ simultaneously whiles in the metering
display mode to get to the system parameter setting mode. In
parameter setting mode, press ‘V/A’ until you get to the ‘PASS’
screen, as shown in Fig 3-14. Press ‘F’ to change this setting. A
digit will begin to flash and you can change the number. Press
Fig 3-14 Password
Setting
‘F’ to increase the value of the flashing digit. Press ‘V/A’ to switch
the flashing digit. Press ‘V/A’ when on the last digit to confirm
the change; the cursor will stop flashing at this point. Press ‘V/A’
to confirm and go to the next screen.
By now the parameter settings are almost completed, except for the I/O module setting.
Pressing ‘F’ and ‘V/A’ simultaneously will exit system parameter settings mode and return
to the metering data mode.
3.3 AcuDC Communication Setup
NOTE: Only meters with communication options have device address, baud rate and
parity setting screens.
To set communication parameters from the meter display mode, you must first press
the ‘F’ and ‘V/A’ buttons simultaneously to get to the parameter setting mode. The
communication parameter setup includes address setup, Baud rate setup, and parity
setting, as shown in table 3-3.
SET
Communication address can be any integer 1 ~ 247. Fig 3-15
shows the address number is 1. Press ‘F’ to change this setting.
The first digit will begin to flash and you can change the edit
mode. Press ‘F’ to increase the value of the flashing digit. Press
‘V/A’ to switch the flashing digit. Press ‘V/A’ when on the last
Fig 3-15
Communication
digit to confirm the change; the cursor will stop flashing at this
point. Press ‘V/A’ to confirm and scroll to the next screen.
Address Setup
NOTE: Modbus-RTU communication protocol requires that all meters on the same
communication bus should have different addresses.
SET
After address setup, the second screen is Baud rate setting
page, or in parameter setting mode, press ‘V/A’ until see ‘bPS’
on the screen. Baud rate can be set as 1200, 2400, 4800, 9600,
19200 and 38400. Fig 3-18 shows the baud rate is 19200 bps.
Press ‘F’ to select the desired baud rate, and then press ‘V/A’ to
Fig 3-16 Baud Rate
confirm and go to the next screen.
Setting
31
Find Quality Products Online at: sales@GlobalTestSupply.com
www.GlobalTestSupply.com
Page 37

V: 1.0 Revised: Jan. 2018
AcuDC 240 Series
DC Energy & Power meters
SET
Fig 3-17 Parity
Setting
NOTE: All devices on the same communication bus should use the same baud rate and
parity settings.
After Baud rate setup, the next screen is the Parity setting page,
or in parameter setting mode, press the ‘V/A’ button until you see
‘CHEC’ on the screen. Parity can be set as EVEN: even parity, 1 stop
bit; ODD: odd parity, 1 stop bit; 1: no parity, 1 stop bit; 2: no parity, 2
stop bits. Fig 3-17 shows no parity, and 1 stop bit. Press ‘F’ to select
the desired baud rate, and then press ‘V/A’ to confirm and go to
the next screen.
3.4 I/O Parameter Setup
I/O module has two optional types: AO(Analog Output) type and RO(Relay Output) type.
In the system parameter setting operation, hold the ’F” key for 3 seconds to enter the AO
parameter setting mode, or hold the ‘V/A’ key for 3 seconds to enter the RO parameter
setting mode. In the AO or RO setting mode, key functions are the same as in system
parameter settings mode. ‘F’ key is used to increase value by 1 for the flashing digit.
‘V/A’ key is used to confirm the flashing digit and move to the cursor. At the last digit of
the parameter, pressing ‘V/A’ key will confirm and go to the next screen. On ant screen,
pressing ‘F’ and ‘V/A’ simultaneously will exit AO or RO parameter settings mode and
return to the system parameter settings mode.
Note: only the meters have AO or RO functions have the valid operations for the
corresponding AO or RO parameter setting .
3.4.1 Meter Clock Setting
For the module that supports the Analog Output function, it offers two AO channels. The
AO parameter can be voltage, current and power. AO upper and lower limits include ‘sign’
and ‘percentage’ digit. The sign digit has three options”:
represents (±). The range of the percentage digit is ‘0.00~1.00’, representing ‘0%~100%’
of the full range value. When the AO parameter is set as voltage, the upper and lower
limit setting is ‘0%~100%’. When AO parameter is set as current or power, there are four
modes:’ 0%~ +100%’; 0%~ -100%’;’-100%~ +100%’ and ‘0%~ ±100%’.
NOTE:
1. There is no ‘sign’ digit when AO is set as voltage. ‘sign’ digit is invisible when percentage is 0.
2. For limit setting, 1.00 is 100%, 0 is 0%, and 0.25 is 25%.
represents (+), represents (-),
32
Find Quality Products Online at: sales@GlobalTestSupply.com
www.GlobalTestSupply.com
Page 38

V: 1.0 Revised: Jan. 2018
Chapter 3: Installation - Conguration Parameter Set-up
SET
In parameter setting mode, hold ‘F’ for 3 seconds until the screen
‘AotP’ displays (as shown in Fig 3-18), the meter is in AO parameter
setting mode. It is the AO output setting. There are four AO
output modes: 0: 0 ~ 5V; 1: 1 ~ 5V; 2: 0 ~ 20mA; 3: 4 ~ 20mA. Press
‘F’ key to select the type number (0, 1, 2 or 3), and then press
Fig 3-18 AO Output
Setting
‘V/A’ key to confirm and scroll to the next screen setting page.
For example, Fig 3-18 shows the output type is 3, it means its AO
output type is 4~20mA mode.
NOTE: AO output type is determined by the equipped I/O module you ordered; incorrect
parameter setting will result in invalid AO output value.
SET
In AO parameter setting mode, press ‘V/A’ until the screen ‘Ao 1P’
displays (as shown in Fig 3-19). It is AO1 parameter setting. There
are three options: 0: voltage; 1: current; 2: power. Press ‘F’ key to
select the parameter number (0, 1, or 2), and then press ‘V/A’ key
to confirm and scroll to the next screen setting page. Fig 3-19
Fig 3-19 AO1
shows the AO1 is se t as current.
Parameter Setting
NOTE: AcuDC 241 and 242 do not have this screen. AO1 is set as what is being measured.
SET
Fig 3-20 AO1 Lower
Limit Setting
SET
Fig 3-21 AO1 Up Limit
Setting
In AO parameter setting mode, press ‘V/A’ until the screen ‘Ao 1L’
displays (as shown in Fig 3-20). It is AO1 lower limit setting, range
is ‘0.00 ~ 1.00’. There is no ‘sign’ digit when the limit is 0. When
the limit is not 0, the ‘sign’ digit will be visible, the sign can be
adjusted by moving the cursor to the digit. Press ‘F’ and ‘V/A’ to
edit the value, and then press ‘V/A’ key to confirm and scroll to the
next screen setting page. Fig 3-20 shows the AO1 lower limit is set
as 0.
In AO parameter setting mode, press ‘V/A’ until the screen ‘Ao 1H’
displays (as shown in Fig 3-21). It is AO1 upper limit setting, range
is ‘-100% ~ +100%’. The entire upper limit’s absolute value cannot
be smaller or equal to the lower limit’. Under no circumstance
can the upper limit be 0. Press ‘F’ to edit the value, and then press
‘V/A’ key to confirm and scroll to the next screen setting page. Fig
3-21 shows the AO1 up limit is set as +100%.
33
Find Quality Products Online at: sales@GlobalTestSupply.com
www.GlobalTestSupply.com
Page 39

V: 1.0 Revised: Jan. 2018
AcuDC 240 Series
DC Energy & Power meters
SET
In AO parameter setting mode, press ‘V/A’ until the screen ‘Ao 2P’
displays (as shown in Fig 3-22). It is AO2 parameter setting. There
are three options: 0: voltage; 1: current; 2: power. Press ‘F’ key to
select the parameter number (0, 1, or 2), and then press ‘V/A’ key
to confirm and scroll to the next screen setting page. Fig 3-22
Fig 3-22 AO2
shows the AO2 is set as voltage.
Parameter Setting
NOTE: 241 and 242 do not have this screen. AO1 is set as what is being measured.
SET
In AO parameter setting mode, press ‘V/A’ until the screen ‘Ao 2L’
displays (as shown in Fig 3-23). It is AO1 lower limit setting, range
is ‘0.00 ~ 1.00’. There is no ‘sign’ digit when the limit is 0. When
the limit is not 0, the ‘sign’ digit will be visible, the sign can be
adjusted by moving the cursor to the digit. Press ‘F’ to edit the
Fig 3-23 AO2 Lower
Limit Setting
value, and then press ‘V/A’ key to confirm and scroll to the next
screen setting page. Fig 3-23 shows the AO1 lower limit is set as 0.
SET
In AO parameter setting mode, press ‘V/A’ until the screen ‘Ao
2H’ displays (as shown in Fig 3-22). It is the AO2 upper limit
setting, range is ‘-100% ~ +100%’. The entire upper limit’s absolute
value cannot be smaller or equal to the lower limit’. Under no
circumstance can the upper limit be 0. Press ‘F’ to edit the value,
Fig 3-24 AO2 Up
Limit Setting
and then press ‘V/A’ key to confirm and scroll to the next screen
setting page. Fig 3-24 shows the AO1 up limit is set as +100%.
3.4.2 RO parameter setting
In the system parameter setting operation page after successfully entering the password,
hold the ‘V/A’ key for 3 seconds to enter the RO parameter setting page. The I/O module
that contains the Relay Output function offers two RO channels. There are three
modes for RO: Latch, Momentary and alarm. The mode setting depends on the object
requirement i.e. A circuit breaker use Momentary. The momentary delay time is 300-5000
ms. Due to the relay action time error, this delay time has up to 3ms error.
34
Find Quality Products Online at: sales@GlobalTestSupply.com
www.GlobalTestSupply.com
Page 40

V: 1.0 Revised: Jan. 2018
Chapter 3: Installation - Conguration Parameter Set-up
SET
Fig 3-25 RO1 Mode
Setting
SET
Fig 3-26 RO1
Momentary Delay
Time
SET
Fig 3-27 RO1 Alarm
Parameter Setting
RO1 mode setting: In the parameter setting mode, hold ‘V/A’ for 3
seconds until the screen ‘Ro1F’ displays (as shown in Fig 3-23), the
meter is in RO parameter setting mode. There are 3 RO1 modes:
0: Latch; 1: Momentary; 2: Alarm. Press ‘F’ key to select the mode
number (0, 1 or 2), and then press ‘V/A’ key to confirm and scroll
to the next screen setting page. For example, Fig 3-25 shows the
RO1 mode is Latch.
RO1 momentary delay time setting: In RO parameter setting
mode, if RO1 mode is set as 1, Momentary, press ‘V/A’ key until the
screen ‘Ro1d’ displays. The delay range in 300 ~ 5000 ms. Press
‘F’ to set the delay time. And then press ‘V/A’ key to confirm and
scroll to the next screen setting page. Fig 3-26 shows the RO1
momentary delay time is 500ms, or 0.5s.
RO1 alarm parameter setting: In RO parameter setting mode, if
RO1 mode is set as 2, Alarm, press ‘V/A’ key until the screen ‘Ro1P’
displays. There are 4 options: 0: no alarm; 1: voltage; 2: current; 3:
power. Press ‘F’ to select setting and press ‘V/A’ key to confirm
and scroll to the next screen setting page. Fig 3-27 shows the RO1
alarm is ‘no alarm’.
SET
RO1 alarm inequality setting: In RO parameter setting mode, if
RO1 mode is set as 2, Alarm, press ‘V/A’ key until the screen ‘Ro1S’
displays. There are 2 options: 0: smaller than; 1: larger than. Press
‘F’ to select and press ‘V/A’ key to confirm and scroll to the next
screen setting page.
Fig 3-28 RO1 Alarm
Inequality Setting
SET
RO1 alarm threshold range setting: In RO parameter setting
mode, if RO1 mode is set as 2, Alarm, press ‘V/A’ key until the
screen ‘Ro1u’ displays. The threshold setting range is the same as
measurement range. Voltage: 0 ~ 3000V; Current: 0 ~ 50000A;
Power: 0- 60000kW. Press ‘F’ to edit the value, and press ‘V/A’ key
Fig 3-29 RO1 Alarm
to confirm and scroll to the next screen setting page.
Threshold Range
Setting
35
Find Quality Products Online at: sales@GlobalTestSupply.com
www.GlobalTestSupply.com
Page 41

V: 1.0 Revised: Jan. 2018
AcuDC 240 Series
SET
DC Energy & Power meters
SET
Fig 3-30 RO1 Alarm
Delay Setting
SET
Fig 3-31 RO2 Mode
Setting
SET
Fig 3-32 RO2
Momentary Delay
Time
RO1 alarm delay setting: In RO parameter setting mode, if RO1
mode is set as 2, Alarm, press ‘V/A’ key until the screen ‘Ro1t’
displays. The alarm delay time range is 0 ~ 255 s. In Fig 3-30,
the alarm delay time is 15 seconds. If the alarm condition is
met, after 15 second, the alarm will be triggered; or if the alarm
condition is no longer met, after 15 seconds, the alarm will be
restored. Press ‘F’ to edit the value, and press ‘V/A’ key to confirm
and scroll to the next screen setting page.
RO2 mode setting: In RO parameter setting mode, press ‘V/A’
until the screen ‘Ro2F’ displays (as shown in Fig 3-31). There are
3 RO2 modes: 0: Latch; 1: Momentary; 2: Alarm. Press ‘F’ key to
select the mode number (0, 1 or 2), and then press ‘V/A’ key to
confirm and scroll to the next screen setting page. For example,
Fig 3-29 shows the RO2 mode is Latch.
RO2 momentary: In RO parameter setting mode, if RO1 mode
is set as 1, Momentary, press ‘V/A’ key until the screen ‘Ro2d’
displays. The delay range in 300 ~ 5000 ms. Press ‘F’ to set the
delay time and then press ‘V/A’ key to confirm and scroll to the
next screen setting page. Fig 3-30 shows the R21 momentary
delay time is 500ms, or 0.5s.
SET
RO2 alarm parameter setting : In RO parameter setting mode,
if RO2 mode is set as 2, Alarm, press ‘V/A’ key until the screen
‘Ro2P’ displays. There are 4 options: 0: no alarm; 1: voltage; 2:
current; 3: power. Press ‘F’ to select and press ‘V/A’ key to confirm
and scroll to the next screen setting page. Fig 3-33 shows the
Fig 3-33 RO2 Alarm
RO2 alarm parameter is set as ‘voltage’.
Parameter Setting
RO2 alarm inequality setting: In RO parameter setting mode,
if RO2 mode is set as 2, Alarm, press ‘V/A’ key until the screen
‘Ro2S’ displays. There are 2 options: 0: smaller than; 1: larger than.
Press ‘F’ to select and press ‘V/A’ key to confirm and scroll to the
next screen setting page.
Fig 3-34 RO2 Alarm
Inequality Setting
36
Find Quality Products Online at: sales@GlobalTestSupply.com
www.GlobalTestSupply.com
Page 42

V: 1.0 Revised: Jan. 2018
Chapter 3: Installation - Conguration Parameter Set-up
SET
RO2 alarm threshold range setting: In RO parameter setting
mode, if RO2 mode is set as 2, Alarm, press ‘V/A’ key until the
screen ‘Ro2u’ displays. The threshold setting range is the same as
measurement range. Voltage: 0 ~ 3000 V; Current: 0 ~ 50000A;
Power: 0~ 60000kW. Press ‘F’ to edit the value and press ‘V/A’ key
Fig 3-35 RO2 Alarm
to confirm and scroll to the next screen setting page.
Threshold Range
Setting
SET
RO2 alarm delay setting: In RO parameter setting mode, if RO2
mode is set as 2, Alarm, press ‘V/A’ key until the screen ‘Ro2t’
displays. The alarm delay time range is 0 ~ 255, unit: second. In
Fig 3-36, the alarm delay time is 15 second. If the alarm condition
is met, after 15 second, alarm will be triggered; or if the alarm
Fig 3-36 RO2 Alarm
Delay Setting
condition is no longer met, after 15 seconds, the alarm will be
restored. Press ‘F’ to edit the value, and press ‘V/A’ key to confirm
and scroll to the next screen setting page.
Table 3-3 I/O Parameter Setting
Label Paramters Options Description
AO (Analogy
Output)
RO
AO Output 0; 1; 2; 3
AO1 Parameter 0; 1; 2 0: voltage; 1: current; 2: power
AO1 lower limit 0.00 ~ 1.00 0%-100%
AO1 up limit -1.00 ~ +1.00
AO2 parameter 0; 1; 2 0: voltage; 1: current; 2: power
AO2 lower limit 0.00 ~ 1.00 0%~100%
AO2 up limit -1.00 ~ +1.00
RO1 mode 0; 1; 2
RO1 momentary delay
time
RO1 alarm parameter 0; 1; 2; 3 0: no alarm; 1: voltage; 2: current; 3: power
300 ~ 5000 Unit: ms
The entire upper limit’s absolute value
should be larger than the lower limit.
The entire upper limit’s absolute value
should be larger than the lower limit.
0: 0 ~ 5V; 1: 1 ~ 5V;
2: 0 ~ 20mA; 3: 4 ~ 20mA
-100%~100%
-100%~100%
0: Latch;
1:Momentary;
2: Alarm
37
Find Quality Products Online at: sales@GlobalTestSupply.com
www.GlobalTestSupply.com
Page 43

V: 1.0 Revised: Jan. 2018
AcuDC 240 Series
DC Energy & Power meters
Label Paramters Options Description
RO
RO1 alarm inequality 0; 1
RO1 alarm threshold
range
RO1 alarm delay 0 ~ 255 unit: second
RO2 mode 0; 1; 2
RO2 momentary delay
time
RO2 alarm parameter 0; 1; 2; 3
RO2 alarm inequality 0; 1
RO2 alarm threshold
range
RO2 alarm delay 0 ~ 255 unit: second
Voltage: 0 ~ 3000 V;
Current: 0 ~ 50000A;
Power: 0~ 60000kW.
300 ~ 5000 Unit: ms
0: no alarm; 1: voltage; 2: current;
Voltage: 0 ~ 1200V;
Current: 0 ~ 50000A;
Power: 0~ 6000kW
0: smaller than;
1: larger than
0: Latch;
1:Momentary;
2: Alarm
3: power
0: smaller than;
1: larger than
38
Find Quality Products Online at: sales@GlobalTestSupply.com
www.GlobalTestSupply.com
Page 44

AcuDC 240 Series
DC Power and Energy Meters
Chapter 4: Viewing Metering Parameters via Display
4.1 General Display on the AcuDC
4.2 View the Meter and Load Running Time
4.3 View the Serial Number from the Meter
Find Quality Products Online at: sales@GlobalTestSupply.com
www.GlobalTestSupply.com
Page 45

V: 1.0 Revised: Jan. 2018
AcuDC 240 Series
CHAPTER 4: VIEWING METERING PARAMETERS – VIA
DISPLAY
You can view different information from the metering screen. For example, you can view voltage,
current, power, energy, electric charge and clock information.
In the metering screen, press ‘F’ to go to next screen, press ‘V/A’ to go to the different windows to
view different information.
4.1 General Display on the AcuDC
AcuDC 240 normally displays the metering screen, which shows real-time measured
data, such as voltage, current, power, energy, meter clock, DI counter etc., as shown in
table 4-1.
DC Energy & Power meters
The first screen on the metering screen shows voltage, current and power. Please note
that AcuDC241 only shows voltage and AcuDC242 only shows current. Only AcuDC243
shows voltage, current and power at the same time.
40
Find Quality Products Online at: sales@GlobalTestSupply.com
www.GlobalTestSupply.com
Page 46

V: 1.0 Revised: Jan. 2018
Chapter 4: Viewing Metering Parameters via Display
V
Fig 4-1 Voltage
Display (AcuDC 241)
k
Fig 4-2 Current
Display (AcuDC 242)
1
2
3
V
A
kW
Fig 4-3Multifunction
Display (AcuDC 243)
For the AcuDC 241, it only displays voltage, and there is a unit ‘V’
shown at the top right corner. For example, the screen in Fig. 4-1
shows it is AcuDC 241, and the voltage is 220.2V.
For the AcuDC 242, it only displays current, and there is a unit ‘A’
shown at the top right corner. For example, the screen in Fig. 4-2
Shows it is AcuDC 242, and the current is 49.99A.
For the AcuDC 243, the screen displays current, voltage and
power, and the units are ‘V, A and kW’ shown at the top right
corner. The first line displays voltage, the second line displays
current and the third line displays power. For example, the voltage
shown in the left figure is 220.2V; the current shown in the left
figure is 49.99A, the power shown in the left figure is 11.00KW.
Communication status is active.
NOTE: Communication status is displayed on every screen in AcuDC 243.
Press ‘F’ to view the Energy data.
You can press ‘V/A’ on the energy screen to switch between different types of energy.
E1 = Import Energy (consumed energy), E2 = Export Energy (generated energy) , E3 =
Total Energy (absolute sum of import energy and export energy), and E4 = Net Energy
(algebraic sum of import energy and export energy).
kWh
kWh
kWh
(a) Import Energy (b) Export Energy (c) Total Energy (d) Net Energy
Fig 4-4 Energy Display
kWh
41
Find Quality Products Online at: sales@GlobalTestSupply.com
www.GlobalTestSupply.com
Page 47

V: 1.0 Revised: Jan. 2018
AcuDC 240 Series
Press ‘F’ to go to the third screen. The third screen shows Electric charge.
You can press ‘V/A’ on the electric charge screen to switch between different types of
charges. Ah1 = Import Charge, Ah2 = Export Charge, Ah3 = Total Charge (absolute sum of
Import Charge Ah and Export Charge Ah), and Ah4 = Net Charge (algebraic sum of Import
Charge Ah and Export Charge Ah).
DC Energy & Power meters
(a) Import Charge (b) Export Charge
Fig 4-5 Charge Display
Press ‘F’ to go to the fourth screen. The fourth screen shows clock information. For
example, screen displayed in Fig 4-6a shows the date is 2014:04:09; screen displayed in
Fig 4-6b shows the time is 14:19:52. You can press ‘V/A’ on the clock information screen to
switch between the date and time.
(a) Date Display
Fig 4-6 Clock Information Display
If the meter is equipped with DI counting function (AcuDC 240 with I/O module), press ‘F’
key to go to the DI count display screen. You can press ‘V/A’ on the DI counting screen to
switch between the DI1 and DI2 counting.
(c) Total Charge
SET
(b) Time Display
(d) Net Charge
(a) DI1 Count Display
Fig 4-7 DI Count Display
42
Find Quality Products Online at: sales@GlobalTestSupply.com
www.GlobalTestSupply.com
(b) DI2 Count
Display
Page 48
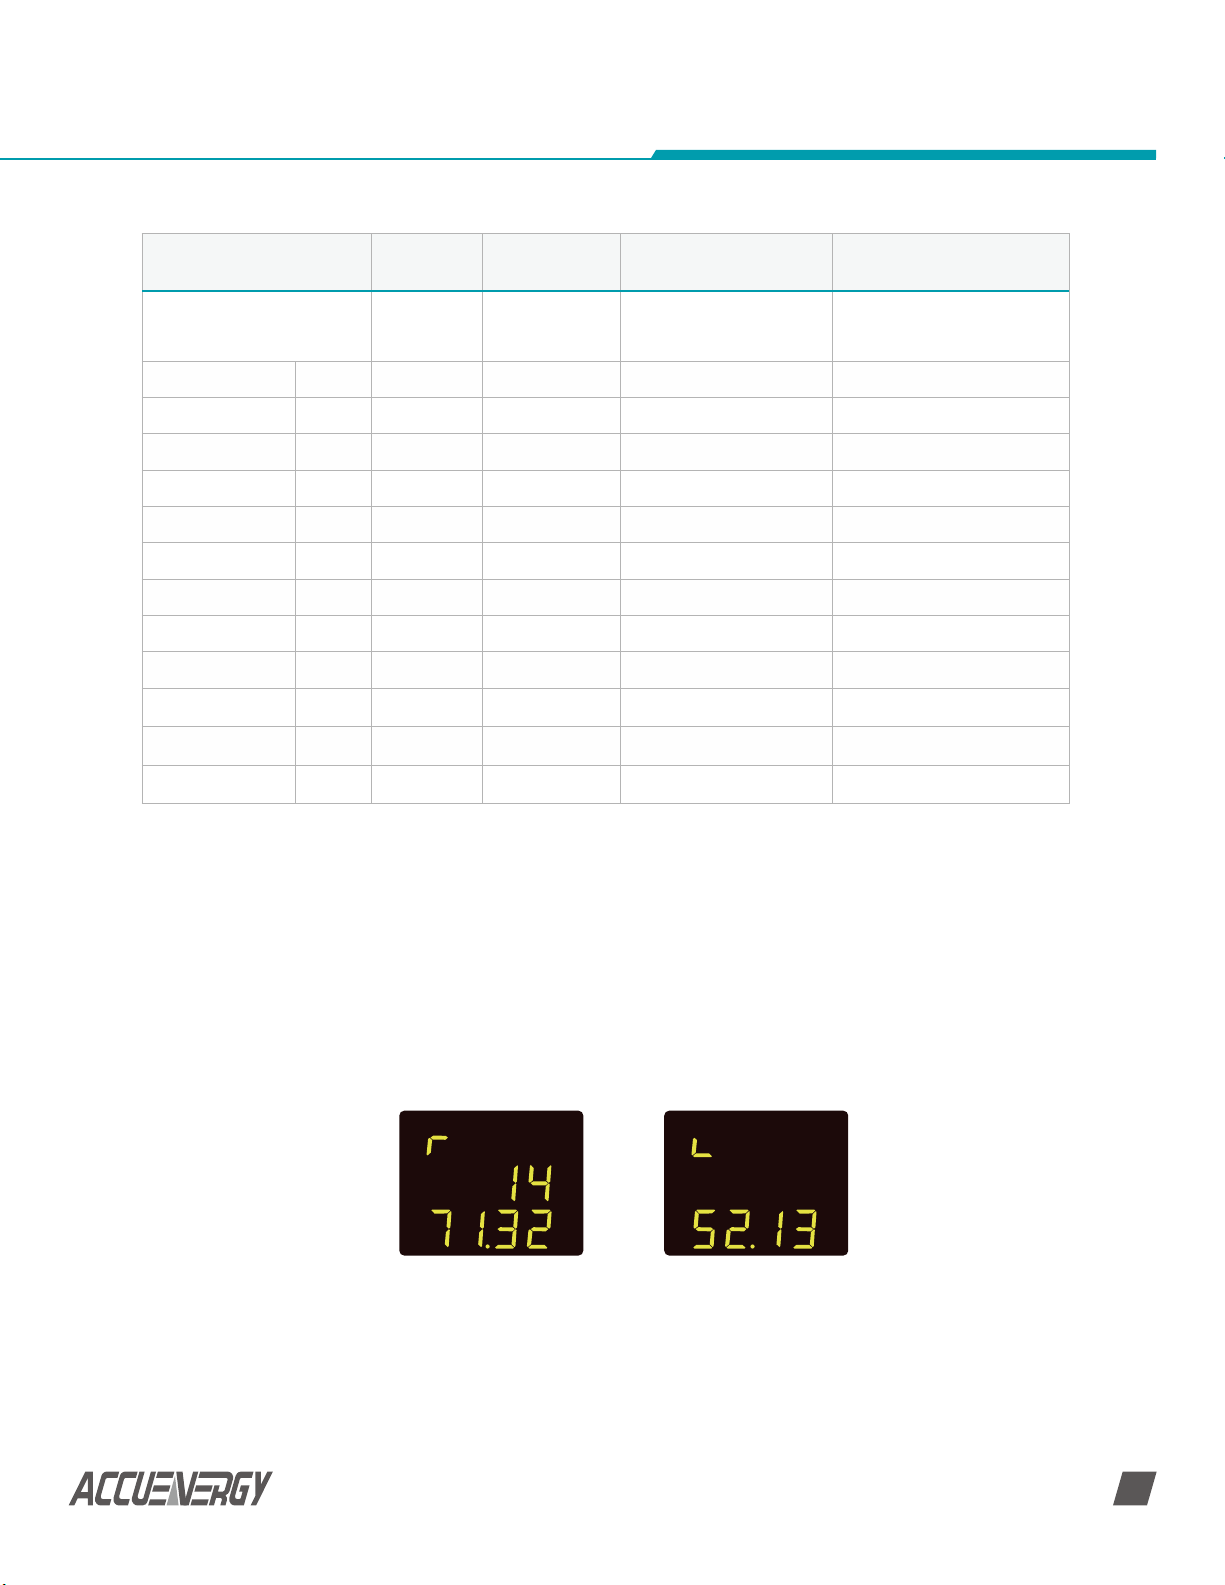
V: 1.0 Revised: Jan. 2018
Chapter 4: Viewing Metering Parameters via Display
Screen No. Widnow No. Description Operation
Voltage Current Power 1 1
Energy E1 2 1 E1: import energy Press ‘F’ at last screen
E2 2 E2: export energy Press ‘V/A’
E3 3 E3: Total energy Press ‘V/A’
E4 4 E4: net energy Press ‘V/A’
Charge Ah1 3 1 Ah1: import charge Press ‘F’ at last screen
Ah2 2 Ah2: export charge Press ‘V/A’
Ah3 3 Ah3: Total charge Press ‘V/A’
Ah4 4 Ah4: net charge Press ‘V/A’
Meter Clock Date 4 1 Year/month/day Press ‘F’ at last screen
Time 2
DI count number
DI1
Count
DI2
Count
5 1 Press ‘F’ at last screen
2 Press ‘V/A’
241 only displays voltage;
242 only displays current;
243 displays all
Hour/min/sec
24-hour clock
First screen in metering data
display mode
Press ‘V/A’
4.2 View the Meter and Load Running Time
If you press down the ‘F’ button for about 3 seconds while in the metering data mode,
you will get to the meter information display mode. You can press ‘F’ to exit the meter
information display mode.
• In this meter information display mode, you can press ‘V/A’ to switch between the
meter running hours and load running hours. ‘r’ means meter running hours while ‘L’
means load running hours.
(a) Meter Running
Time
(b) Load Running
Time
Fig 4-8 Running Time Display
43
Find Quality Products Online at: sales@GlobalTestSupply.com
www.GlobalTestSupply.com
Page 49

V: 1.0 Revised: Jan. 2018
AcuDC 240 Series
4.3 View the serial number from the meter
If you press down the ‘V/A’ button for about 3 seconds while in the metering data mode,
you will get to the serial number display mode. You can press ‘V/A’ to exit the serial
number display mode.
NOTE: This screen displays the last 8 digits of the meter’s serial number.
DC Energy & Power meters
Fig 4-9 Serial Number
44
Find Quality Products Online at: sales@GlobalTestSupply.com
www.GlobalTestSupply.com
Page 50

AcuDC 240 Series
DC Power and Energy Meters
Chapter 5: Viewing Real-Time Readings
via Acuview Software
5.1 Connection Setup
5.1.1 Wiring
5.1.2 Acuview software setup
5.2 Configuration Parameters Setup
5.2.1 General meter parameter setting
5.2.2 Configure the Data Log using the
meter’s memory
5.2.3 Configure the Data Log to log to
computer memory
5.3 Viewing Metering Parameters
5.3.1 Real-time Metering
5.3.2 Reading Data Log on
meter’s onboar memory
5.3.3 Reading Data Log on a
computer’s memory
Find Quality Products Online at: sales@GlobalTestSupply.com
www.GlobalTestSupply.com
Page 51

V: 1.0 Revised: Jan. 2018
AcuDC 240 Series
CHAPTER 5: Viewing Real-time Readings Via AcuView
Software
This chapter will mainly discuss how to use the meter via the communication port using
software. It is highly recommended that previous chapters be read before moving onto
Chapter 5, a familiarity with Modbus would also be helpful.
5.1 Connection Setup
5.1.1 Wiring
Refer to section 2.3.6(Communications Wiring)
5.1.2 Acuview Software Setup
1. New Connection:
A connection is required before communicating with the meter. To add a new
connection, do one of the following:
1) Click Setting > Connection Manager
DC Energy & Power meters
or
2) Click the icon
The Connection Manager is shown as in Fig 5-1.
Fig 5-1 Connection Manager
• New: add a new connection
• Delete: Delete the select connection
• Edit: Edit the selected connection settings.
• Close: Close the window
• Status: ‘Available’ means Com Port is active, and ‘not Available’ means Com Port is
inactive. If the status is blank, it means that Com Port has not been established.
46
Find Quality Products Online at: sales@GlobalTestSupply.com
www.GlobalTestSupply.com
Page 52

V: 1.0 Revised: Jan. 2018
Chapter 5: Viewing Real-Time Readings via Acuview Software
2. Connection Settings:
Set the connection parameters. The Connection Settings box is shown on the screen as in
Fig. 5-2 Click ‘OK’ after settings finish.
1) Click Operation > Add Device
or
2) Click the icon
Fig 5-2 Acuview Software Connection Settings
• Name: Give connection a name
• Type: Select the serial port that the RS485 connection is using
• Com Port: Select the serial port that the RS485 connection is using
• Baud Rate: Should match the baud rate in the meter settings.
• Parity: Should match the parity in the meter settings.
• Scan Interval: Used to adjust the time interval between two message(200ms or
500ms is recommended)
NOTE: Baud Rate and Parity must match between meter and software.
NOTE: How to find ‘Com Port’ in your computer
Right click on ‘Computer’, then click ‘Properties’ menu. In the pop up window click on
‘Device Manager’ from the left navigation panel to find the port number. In the device
Manager window, double click on ‘Port (COM&LPT)’ from the dropdown list. Find the ‘USB
Serial Port (COMx)’ the number in brackets is the port number, i.e. COM4. Please select
the corresponding Com Port here.
47
Find Quality Products Online at: sales@GlobalTestSupply.com
www.GlobalTestSupply.com
Page 53

V: 1.0 Revised: Jan. 2018
AcuDC 240 Series
3. Add Device:
After performing step 1 and 2 above, you need to add a device to communicate with. To
add a new device, do one of the following:
1) Click Operation >Add Device
or
2) Click the icon
The Add Device box is shown as Fig 5-3. Click ‘OK’ after settings finish.
DC Energy & Power meters
Fig 5-3 Add Device
• Device Type: The model of the device you are going to communicate with
• Connection: Select a connection for the communication
• Device Address: Should match the address in the meter settings
• Description: Device description such as where the device is used, for example,
‘Building 1’.
48
Find Quality Products Online at: sales@GlobalTestSupply.com
www.GlobalTestSupply.com
Page 54

V: 1.0 Revised: Jan. 2018
Chapter 5: Viewing Real-Time Readings via Acuview Software
4. Connection:
You can read all the measurement data after you successfully complete Step 3. To
connect, do one of the following:
1) Click Operation > Connect
Or
2) Click the icon
Or
3) Press F9 on keyboard
If the connection is successful, the screen will show the measured data on the screen, and
you will see ‘Com Failure = 0, Log Failure = 0’ at the bottom right corner on the screen.
If the connection is not successful, no measured data will appear on the screen, and you
will see ‘Com Failure = 1, Log Failure = 0’ at the bottom right corner on the screen in red.
NOTE: If connection is not successful, please make sure: The physical connection of the
device is correct; the communication parameters, such as Baud Rate, Parity, device type
and device address are not properly set.
5.2 Configuration Parameters Setup
5.2.1 General Meter Parameter Setting
• From the left navigation panel click on the ‘Settings’ tab and then on ‘General’. You
can set up the system parameters and I/O settings from this section, as shown in Fig
5-4.
• Click on ‘Update Device’ after making changes, so that the changes can be saved on
the meter.
Parameters can be setup with following rules:
Security and Communication: You can set the meter’s password, device address, Baud
Rate and parity from this section and the meter will make the corresponding changes.
Voltage and Current: If you are measuring your voltage using a voltage Hall Effect sensor
and/or your current using either a Hall Effect sensor or a shunt, you will have to set the
Voltage and/or Current sections.
49
Find Quality Products Online at: sales@GlobalTestSupply.com
www.GlobalTestSupply.com
Page 55

V: 1.0 Revised: Jan. 2018
AcuDC 240 Series
RO1 Output Mode/RO2 Output Mode: This is available with the ‘X3’ module
Choose between the three modes:
• Latch: To manually turn on and off the relay
• Momentary: To turn on the relay for a set number of seconds before it goes back off.
• If momentary mode is selected, set the delay time ‘On Time’; the range is 300-
5000ms. The delay time has an error of up to 3ms (due to the relay action time
error)
• Alarm: To trigger the relay output through an alarm event.
RO Alarm Limit: Set the Alarm Channel, Setting, Setpoint and Delay (in sec) for both RO1
and RO2; this is needed if RO1/RO2 Output mode is set as ‘Alarm’
DC Energy & Power meters
Fig 5-4 General settings
50
Find Quality Products Online at: sales@GlobalTestSupply.com
www.GlobalTestSupply.com
Page 56

V: 1.0 Revised: Jan. 2018
Chapter 5: Viewing Real-Time Readings via Acuview Software
Raw Channel of AO1/Raw Channel of AO2: The settings are available with the X1 and X2
modules
Select the parameter (Voltage, Current, Power) you will like to send as an Analog Output.
Set the High and Low Limit based on the parameter you have selected.
Note:
• When AO parameter is set as voltage, the upper and lower limit setting range is
between 0% - 100%. E.g. it can be set as: 0% - 100%, 0% - 50% etc.
• When AO parameter is set as current or power, there are four different modes for
the upper and lower limit setting range. It can be between: 0% - +100%, 0% - -100%,
-100% - +100%, and 0% - ±100%. E.g. it can be set as: 0% - +50%, 0% - -50% etc.
• Upper Limit cannot be 0%
Other:
• You can adjust the backlight brightness under the Backlight Adjustment section. The
range is from 1 to 5.
DI 1 Type/ DI 2 Type:
Select DI 1 or DI 2 as:
• State: DI will act as a switch status monitor
• Counter: DI will act as a pulse counter.
NOTE: You can ‘import’ a saved device profile to quickly setup the meter parameters:
Click Tools->Import Device Settings, select the desired file and click ‘Open’, and after
importing successfully, click ‘Update Device’, or click Tools->Import and Update Device,
select the desired file.
You also can save the current settings to a file via the export device profile function in
‘Tools’.
5.2.2 Configure the Data Log using the meter’s onboard memory
You can set up the meter to log data on the onboard memory.
• From the left navigation panel click on the settings tab then click ‘Data Log’ to access
the data log setting page (as shown in Fig 5-5).
51
Find Quality Products Online at: sales@GlobalTestSupply.com
www.GlobalTestSupply.com
Page 57

V: 1.0 Revised: Jan. 2018
AcuDC 240 Series
Parameter Selection: Select the parameters you would like to log (from the left
box), click ‘Add’ to add them to the box on the right.
DC Energy & Power meters
Fig 5-5 Data Log readings
Enable Data Log: Make sure you check the box ‘Enabled’ to enable data log.
Time Setting: There are three different Logging Modes.
• Continuous: This will start logging data immediately, after the ‘Update Device’ button
is clicked.
• In this mode, you will have to set the Logging Interval.
• Scheduling: This will start logging data from a set Start Time.
• In this mode, you will have to set the Logging Interval and Start Time.
NOTE: When the memory is full, a memory sector is deleted and the data logging
will continue for the above two modes.
• Interval: This will log data from a start time to an end time.
• In this mode, you will have to set the Logging Interval, as well as the Start Time
and End Time.
NOTE: When the memory is full, the data logging will stop. Make sure to click on
‘Update Device’ after making changes, so that the changes can be saved on the
meter.
NOTE: When you click on ‘Update Device’, the meter’s data log memory will be erased.
52
Find Quality Products Online at: sales@GlobalTestSupply.com
www.GlobalTestSupply.com
Page 58

V: 1.0 Revised: Jan. 2018
Chapter 5: Viewing Real-Time Readings via Acuview Software
5.2.3 Configure the data log to log the readings on the computer’s memory
This applies to AcuDC 240 series meters with communication option; the meters do not
need to have onboard memory since the data will be logged directly on the computer’s
memory.
You can set up the meter to log data directly on the computer memory. You must always
be connected to the software for this data log method to work.
You can access this data log setting by clicking on the ‘Settings’ option located on the
menu toolbar, and then clicking on ‘Data Log Settings’ or click the icon
Fig 5-6 Accessing Data Log
The Data Log Setting window will open. This is shown in Fig 5-6.
In data log setting, as shown in Fig 5-7, make sure you check the ‘Enabled’ box in the
window.
Under the ‘Logging Items of Selection’ Section: click on the required groups of
parameters you will like to log.
Under the ‘Logging Options’ Section:
53
Find Quality Products Online at: sales@GlobalTestSupply.com
www.GlobalTestSupply.com
Page 59

V: 1.0 Revised: Jan. 2018
AcuDC 240 Series
DC Energy & Power meters
Fig 5-7 Data Log settings
In data log setting, as shown in Fig 5-7, make sure you check the ‘Enabled’ box in the
window.
Under the ‘Logging Items of Selection’ Section: click on the required groups of
parameters you will like to log.
Under the ‘Logging Options’ Section:
• Choose the ‘Logging Data Interval’.
• Choose between the options ‘Log data until file is full’ or ‘Specify Log file duration’
• If ‘Specify Log file duration’ is selected: Choose how often you want a new file created.
• Choose the ‘Log file format’ you want the file(s) saved as.
Enter the preferred name for the file in ‘Log file name’.
Choose the ‘Log file folder location’ where the file(s) will be saved.
Once everything is set, click ‘OK’.
Finally, make sure you click the icon
the computer. You can click the icon
on the top of the screen to start data logging on
on the top of the screen to stop data logging.
54
Find Quality Products Online at: sales@GlobalTestSupply.com
www.GlobalTestSupply.com
Page 60

V: 1.0 Revised: Jan. 2018
Chapter 5: Viewing Real-Time Readings via Acuview Software
WARNING: If ‘Excel’ is chosen as the ‘Log file format’: After you click on the icon to
start data logging, a warning window will pop up. Take note of the warning in order to
prevent your files from being corrupt.
Fig 5-8 Warning
To get help or more information on the Acuview software, please click ‘help’ in the main
menu bar, of click the icon
.
55
Find Quality Products Online at: sales@GlobalTestSupply.com
www.GlobalTestSupply.com
Page 61

V: 1.0 Revised: Jan. 2018
AcuDC 240 Series
5.3 Viewing Metering Parameters
5.3.1 Real-Time Metering
From the left navigation panel click on the ‘Readings’ tab and then select ‘Real-Time
Metering’ to view the meter’s real time data. You can read voltage, current, energy, charge
etc, as shown in Fig 5-9.
You can modify the value of energy and charge by clicking the underlined figures. And
you can also reset the energy, charge, DI counter and Max and Min by clicking ‘Reset’, the
values will reset to 0.
On this reading window you can also control relay 1 and relay 2.
DC Energy & Power meters
Fig 5-9 Reading Real Time Meter (change another picture, with load, this reading
without load, so voltage is 0)
56
Find Quality Products Online at: sales@GlobalTestSupply.com
www.GlobalTestSupply.com
Page 62

V: 1.0 Revised: Jan. 2018
Chapter 5: Viewing Real-Time Readings via Acuview Software
5.3.2 Reading Data Log on Meter’s Onboard Memory
From the left navigation panel click on the ‘Readings’ tab and then select ‘Data Log’
to retrieve the meter’s logged readings. The parameter settings for data log in meter’s
onboard memory refer to section 5.2.2 (Configure the Data Log using the meter’s onboard
memory).
On this window you can view the data log, while the maximum record number is 85995.
Fig 5-12 Reading Data Log on Meter’s Onboard Memory
57
Find Quality Products Online at: sales@GlobalTestSupply.com
www.GlobalTestSupply.com
Page 63

V: 1.0 Revised: Jan. 2018
AcuDC 240 Series
5.3.3 Reading Data Log on the computer’s memory
Find the data log files from the specified folder location where the file was saved. The
parameter settings for data log on the computer’s memory refer to section 5.2.3. If you
chose the default path, there is a folder named MonData in the Acuview installation
directory where all the data log files are stored. By default, each file name consists of
device description, device type, port(Serial mode), device address and data logging
starting time whose format is YYYYMMDD(Year, Month, Day).
DC Energy & Power meters
After you open a data log file, you will see the following items: ‘Time U (V) I (A) P (kW)’.
The file content is the same whether data is saved as .txt or .csv or .Excel.
58
Find Quality Products Online at: sales@GlobalTestSupply.com
www.GlobalTestSupply.com
Page 64

AcuDC 240 Series
DC Power and Energy Meters
Appendix
A. Troubleshooting
B. Modbus Register Map
B.1 MODBUS-RTU Protocol
B.2 Communication Format
B.3 AcuDC 240 Communication
Address Table
C. Ordering Information
D. Glossary of Definitions
Find Quality Products Online at: sales@GlobalTestSupply.com
www.GlobalTestSupply.com
Page 65

V: 1.0 Revised: Jan. 2018
AcuDC 240 Series
APPENDIX
This chapter will mainly discuss how to use the meter via the communication port using
software. It is highly recommended that previous chapters be read before moving onto
Chapter 5, a familiarity with Modbus would also be helpful.
A. Troubleshooting
My AcuDC 243 is displaying the correct current but the power (kW) is negative.
Check to see if the AcuDC is installed on the negative terminal of the load.
Why is my AcuDC 243 measuring the wrong current with the Current Hall Effect
Sensor?
A connection is required before communicating with the meter. To add a new
connection, do one of the following:
• The Hall Effect Sensor should be installed on the negative side of the load.
• Ensure that the Hall Effect sensor is being powered. If the sensor was purchased from
Accuenergy then the sensor will need a ±15V dc power supply.
• Ensure that the wiring of the sensor is to the AcuDC is correct.
• Terminal 3 of the sensor should be connected to ‘I+’ of the AcuDC 243.
• Terminal 4 of the sensor should be connected to ‘I-‘of the AcuDC 243.
•• Terminal 4 of the sensor must also be connected to Ground.
•• Check that the settings in the meter are configured to read accurately from that
sensor.
DC Energy & Power meters
•• Press ‘F’ and ‘V/A’ simultaneously whiles on the meter data mode to get to the
settings mode.
•• A password screen will display. Leave the password as default ‘0000’ and press ‘V/A’ to
enter the setting mode; the communication address ‘AddR’ screen will display next.
•• Press ‘V/A’ until you get to the ‘I In’ screen. Enter the rated current input of the Hall
Effect Sensor in this screen.
•• Press ‘F’ to change this setting. A digit will begin to flash and you will enter the edit
mode.
•• Press ‘F’ to increase the value of the flashing digit
•• Press ‘V/A’ to switch the flashing digit
•• Press ‘V/A’ when on the last digit to confirm the change; the cursor will stop
flashing at this point
60
Find Quality Products Online at: sales@GlobalTestSupply.com
www.GlobalTestSupply.com
Page 66

V: 1.0 Revised: Jan. 2018
SET
•• Press ‘V/A’ to go to the next screen. This will be the ‘I P’ screen. This setting
corresponds to the output range of the Hall Effect Sensor.
•• Press ‘F’ to change this setting and to select required output.
NOTE: The default setting is ‘0’ for 4-20mA/0-±5V. The other mode is ‘1’ for
4-12-20mA/0-±4V.
•• Press ‘V/A’ to confirm this setting; the cursor will stop flashing at this point
SET
Appendix
Why is my AcuDC 243 measuring the wrong current with the shunt I am using?
• The shunt should be installed on the negative side of the load.
• Ensure that the AcuDC 243 is wired correctly to the shunt so that it can be read
accurately.
• The positive output from the shunt should be connected to the AcuDC 243 ‘I+’
terminal.
• The negative output from the shunt should be connected to the ‘AcuDC 243
‘I-‘terminal.
• If the voltage is also being measured ensure that the positive DC source is
connected to the AcuDC 243 ‘V+’ terminal whiles the AcuDC 243 ‘V-‘ terminal should
be connected to the ‘I-‘ terminal on the AcuDC 243.
• Ensure that the shunt being used outputs a signal in the range of 50-100mV to work
with the meters current input.
• Check that the settings in the meter are configured to read accurately from the shunt.
• Press ‘F’ and ‘V/A’ simultaneously whiles on the meter data mode to get to the
settings mode.
61
Find Quality Products Online at: sales@GlobalTestSupply.com
www.GlobalTestSupply.com
Page 67

V: 1.0 Revised: Jan. 2018
AcuDC 240 Series
• A password screen will display. Leave the password as default ‘0000’ and press ‘V/A’ to
enter the setting mode; the communication address ‘AddR’ screen will display next.
• Press ‘V/A’ until you get to the ‘I In’ screen. Enter the rated current input of the shunt
in this screen.
• Press ‘F’ to change this setting. A digit will begin to flash and you will enter the edit
mode.
• Press ‘F’ to increase the value of the flashing digit
• Press ‘V/A’ to switch the flashing digit
• Press ‘V/A’ when on the last digit to confirm the change; the cursor will stop
flashing at this point.
DC Energy & Power meters
SET
• Press ‘V/A’ to go to the next screen. This will be the ‘I o’ screen. This setting
corresponds to the output range of the shunt.
• Press ‘F’ to change this setting. The first digit will begin to flash and you will enter
the edit mode.
• Press ‘F’ to increase the value of the flashing digit
• Press ‘V/A’ to switch the flashing digit
• Press ‘V/A’ when on the last digit to confirm the change; the cursor will stop
flashing at this point
SET
Why won’t my meter connect to the AcuView software?
• The physical connection of the device is incorrect, please refer to section 2.3.6;
• The communication parameters, such as Baud Rate, Parity, device type, device
address are not properly selected the same as the meter.
• The “Com Port” in the software is not selected as the same as the computer. Please
refer to section 5.1.2.
62
Find Quality Products Online at: sales@GlobalTestSupply.com
www.GlobalTestSupply.com
Page 68

V: 1.0 Revised: Jan. 2018
B. Modbus Register Map
This chapter will discuss how to operate the meter via the communication port using
software. Before starting this chapter, you should be familiar with Modbus and read
other chapters of this manual to make sure that you have a good understanding of the
functions and applications of this product.
This chapter includes: Modbus protocol, communication format and communication
address table.
B.1 MODBUS-RTU Protocol
Modbus RTU protocol is used for AcuDC 240’s communication. Data format and error
check methods are defined in Modbus protocol. The half duplex query and respond
mode is adopted in Modbus protocol.
Modbus allows master device (PC, PLC etc.) to communicate with slave devices, it will not
allow data exchange between slave devices. Therefore, terminal devices will not engage
the communication link at initialization, only response to the master’s request.
Appendix
B.1.1 Transmission Mode
The mode of transmission defines the data structure within a frame and the rules used to
transmit data.
• Coding System 8 bit
• Start Bit 1 bit
• Data Bits 8bits
• Parity Even/ Odd/ None2/ None1
• Stop Bit 1/2bit
• Error Checking CRC
63
Find Quality Products Online at: sales@GlobalTestSupply.com
www.GlobalTestSupply.com
Page 69

V: 1.0 Revised: Jan. 2018
AcuDC 240 Series
B.1.2 Modbus Protocol
1. Frame
When data frame reaches the terminal unit, the unit removes the data frame’s header,
reads the data, if there is no error, it’ll implement the data’s task. Afterwards, the unit
puts its own data with the acquired header, and sends back the frame to the sender. The
response data frame contains: Address, Data and CRC Check. Any error will cause a failure
to respond.
Address Function Data Check
2. Address Field
The address field is at the start of the frame. It is composed of 1 byte (8 bits), its decimal
value range is 0~255.
DC Energy & Power meters
Table B-1 Data Frame Format
8-Bits 8-Bits N X 8-Bits 16-Bits
A master addresses a slave by placing the slave address in the address field of the
message. When the slave sends its response, it places its own address in this address field
of the response to let the master know which slave is responding.
3. Function Field
When a message is sent from a master to a slave device, the function code field tells the
slave what kind of action to perform.
Table B-2 Function Code
Code Meaning Action
01 Read RO Status Obtain Relay Output Current Status (ON/OFF)
02 Read DI status Obtain Digital Input Current Status(ON/OFF)
03 Read holding register
05 Control RO Control Relay Output(ON/OFF))
Obtain Current Binary Value of One or Multiple
Registers
16 Preset multiple registers Place Specific Binary Value into Multiple Registers
64
Find Quality Products Online at: sales@GlobalTestSupply.com
www.GlobalTestSupply.com
Page 70

V: 1.0 Revised: Jan. 2018
4. Data Field
Data field contains the data that terminals need to complete the request and the data
that terminals respond to the request. This Data may be a numerical value, address or
setting. For example, Function Code tells the terminal to read one register, Data Field
needs to specify from which register and how many registers to read.
5. Error Check Field
The field allows the error check by master and slave devices. Due to electrical noise and
other interfaces, a group of data may be changed while transmitting from one location
to the other. Error Check ensures master or slave devices do not respond to the distorted
data during the transmission, which enhance the system security and efficiency. Error
Check uses 16-bit Cyclic Redundancy Check (CRC 16).
6. CRC Check
Every message includes an error checking field which is based on the Cyclical
Redundancy Check(CRC) method. The CRC field checks the contents of the entire
message. It is applied regardless of any parity check method used for the individual
characters of the message. The CRC field is two bytes long, containing a 16-bit binary
value. The CRC value is calculated by the transmitting device, and is appended to the
message.
Appendix
The receiving device recalculates the CRC value during reception of the message, and
compares the calculated value to the actual value it received in the CRC field.
An error will be reported if the two values are not equal. CRC calculation is first started by
preloading the whole 16-bit register to 1’s. The process begins by applying successive 8-bit
bytes of the message to the current contents of the register. Only the eight bits of data in
each character are used for generating the CRC. Start and stop bits, and the parity bit, do
not apply to the CRC.
When generating the CRC, each 8-bit character is exclusive ORed with the register
contents. The result is shifted towards the least significant bit (LSB), with a zero filled into
the most significant bit (MSB) position. The LSB is extracted and examined, if the LSB
equals to 1, the register is exclusive ORed with a preset, fixed value; if the LSB equals to 0,
no action will be taken. This process is repeated until eight shifts have been performed.
After the last (eighth) shift, the next 8-bit byte is exclusive ORed with the register’s current
value, and the process repeats for eight more shifts as described above. The final contents
of the register, after all the bytes of the message have been applied, the final contents of
the register, which should exchange the high-byte and low-byte, is the CRC value. When
the CRC is appended to the message, the low-order byte is appended first, followed by
the high-order byte.
65
Find Quality Products Online at: sales@GlobalTestSupply.com
www.GlobalTestSupply.com
Page 71

V: 1.0 Revised: Jan. 2018
AcuDC 240 Series
B.2 Communication Format
This section will illustrate the format indicated in Table B-3.
DC Energy & Power meters
Table B-3 Protocol Illustration (Hex value and Decimal value)
Addr Fun
06
Hex
Dec 6 3 0 0 0 33 132 101
H
03H 00H 00H 00H 21H 84H 65H
Data Start
Reg Hi
Data Start
Reg Lo
Data # of
Regs Hi
Data # of
Regs Lo
CRC16 Hi CRC 16 Lo
Addr: Slave device address
Data start reg hi: Start register address, high byte
Data start reg lo: Start register address, low byte
Data# of reg hi: Number of registers, high byte
Data# of reg lo: Number of registers, low byte
CRC 16 hi: CRC high byte
CRC 16 lo: CRC low byte
B.2.1 Read Relay Output Status (Function Code 01)
Query
The master device sends query frame to the slave device. Function Code 01 allows users
to acquire the relay output status (1=ON, 0=OFF) of the slave device with the specified
address. Along with slave device address and function code, query frame must contain
the relay register starting address and the number of registers to be read.
AcuDC 240 relay output address starts from 0000H (Relay 1=0000H, Relay 2=0001H).
Table B.4 depicts reading Relay 1 and 2 statuses from slave address 17.
Table B-4 Query Frame of Reading Relay Output Status
Addr Fun
Hex 11H 01H 00H 00H 00H 02H BFH 5BH
Dec 17 1 0 0 0 2 191 91
66
Data Start
Reg Hi
Data Start
Reg Lo
Data # of
Regs Hi
Data # of
Regs Lo
CRC16 Hi CRC 16 Lo
Find Quality Products Online at: sales@GlobalTestSupply.com
www.GlobalTestSupply.com
Page 72

V: 1.0 Revised: Jan. 2018
Response
The slave device answers the master device’s query. The response frame contains slave
device address, function code, data quantity and CRC check. Each relay utilizes one bit
(1=ON, 0=OFF). Table B-5 depicts the response frame.
Table B-5 Response Frame of Reading Relay Output Status
Addr Fun Byte Count Data CRC16 Hi CRC 16 Lo
Hex 11H 01H 01H 02H D4H 89H
Dec 17 1 1 2 212 137
Data Bytes
7 6 5 4 3 2 1 0
Appendix
0 0 0 0 0 0 1 0
(Relay 1=OFF, Relay 2=ON)
B.2.2 Read DI Status (Function Code 02)
Query
This function allows the user to obtain DI status ON/OFF (1=ON, 0=OFF). On top of slave
device address and function code, query frame must contain the digital input register,
starting address and the number of registers to be read. AcuDC 240 DI address starts
from 0000H (DI1-0000H, DI2-0001H).
Table B.6 depicts reading DI1 to DI2 status of the slave device with the address of 17.
Table B-6 Query Frame of Reading DI Status
Addr Fun
Hex 11H 02H 00H 00H 00H 02H FBH 5BH
Data Start
Reg Hi
Data Start
Reg Lo
Data # of
Regs Hi
Data # of
Regs Lo
CRC16 Hi CRC 16 Lo
Dec 17 2 0 0 0 2 251 91
67
Find Quality Products Online at: sales@GlobalTestSupply.com
www.GlobalTestSupply.com
Page 73

V: 1.0 Revised: Jan. 2018
AcuDC 240 Series
Response
The slave device answers the master device’s query. The response frame contains slave
device address, function code, data quantity and CRC check. Each DI utilizes one bit
(1=ON, 0=OFF). Table B-7 depicts the response frame.
B.2.3 Read Data (Function Code 03)
Query
This function allows the master to obtain the measurement results from the meter. Table
B.6 depicts reading slave device (address 1) voltage. The AcuDC 240 voltage address is
0200H-0201H.
DC Energy & Power meters
Table B-7 Response Frame of Reading DI Status
Addr Fun Byte Count Data CRC16 Hi CRC 16 Lo
Hex 11H 02H 01H 01H 64H 88H
Dec 17 2 1 1 251 136
Table B-8 Query Frame of Reading Voltage
Addr Fun
Hex 01H 03H 02H 00H 00H 02H C5H B3H
Dec 1 3 2 0 0 2 197 179
Data Start
Reg Hi
Data Start
Reg Lo
Data # of
Regs Hi
Data # of
Regs Lo
CRC16 Hi CRC 16 Lo
Response
Response frame contains slave device address, function code, data quantity and CRC
check.
Table B-9 depicts the response of V=402851D8H (2.6299953V)
Table B-9 Response Frame of Reading Voltage
Addr Fun Byte Count Data1 Hi Data1 Lo Data2 Hi Data2 Lo CRC16 Hi CRC 16 Lo
Hex 01H 03H 04H 40H 28H 51H D8H 52H 31H
Dec 1 3 4 64 40 81 216 82 49
68
Find Quality Products Online at: sales@GlobalTestSupply.com
www.GlobalTestSupply.com
Page 74

V: 1.0 Revised: Jan. 2018
B.2.4 Control Relay Output (Function Code 05)
Query
This query frame forces the rely status to ON or OFF. The AcuDC 240 relay output address
starts from 0000H(Relay 1= 0000H, Relay 2= 0001H).
Data FF00H changes the relay status to ON, data 0000H changes the relay status to OFF.
The relay will not be influenced by any other data input.
The following is to query slave device 1 to set relay status as ON.
Table B-10 Query Frame of Control Relay Status
Addr Fun DO Addr Hi DO Addr Lo Value Hi Value Lo CRC16 Hi CRC 16 Lo
Hex 01H 05H 00H 00H FFH 00H 8CH 3AH
Appendix
Dec 1 5 0 0 255 0 140 58
Response
The correct response to this request is to send back the received data after the relay status
is changed.
Table B-11 Response Frame of Control Relay Status
Addr Fun DO Addr Hi DO Addr Lo Value Hi Value Lo CRC16 Hi CRC 16 Lo
Hex 01H 05H 00H 00H FFH 00H 8CH 3AH
Dec 1 5 0 0 255 0 140 58
69
Find Quality Products Online at: sales@GlobalTestSupply.com
www.GlobalTestSupply.com
Page 75

V: 1.0 Revised: Jan. 2018
AcuDC 240 Series
B.2.5 Read Data (Function Code 03)
Query
Function Code 16 (10 H Hex) allows the user to modify the contents of multiple registers.
AcuDC 240 system parameters can be written by this function code.
The following example depicts how to preset slave device 1’s AO1 parameter (current),
lower limit sign (+), lower limit value (0%), upper limit sign(+), upper limit value (100%)
DC Energy & Power meters
Table B-12 Query Frame of Preset Multiple Registers
Addr Fun
Data Start
Reg Hi
Data Start
Reg Lo
Data # of
Regs Hi
Data # of
Regs Lo
Byte Count Value 1 Hi Value 1 Lo
Hex 01H 10H 01H 09H 00H 05H 0AH 00H 01H
Dec 1 1 9 0 5 10 0 1
Value 2 Hi
Value
2 Lo
Value 3 Hi
Value
3 Lo
Value 4 Hi
Value
4 Lo
Value 5 Hi
Value
5 Lo
CRC 16 Hi CRC 16 Lo
00H 00H 00H 00H 00H 00 00H 64H C5H 8AH
0 0 0 0 0 0 0 100 197 138
Response
The correct response is to send back the address, function code; data starting address,
data number, CRC check after the value is changed.
Table B-13 Preset Multiple Registers Response
Addr Fun
Data Start
Reg Hi
Hex 01H 10H 01H 09H 00H 05H D1H F4H
Dec 1 16 1 9 0 5 209 244
70
Find Quality Products Online at: sales@GlobalTestSupply.com
www.GlobalTestSupply.com
Data Start
Reg Lo
Data # of
Regs Hi
Data # of
Regs Lo
CRC 16 Hi CRC 16 Lo
Page 76

V: 1.0 Revised: Jan. 2018
B.3 AcuDC240 Communication Address Table
Basic Measurement Parameter Address
Use Function Code 03 to read
Table 5-14 Real-Time Measurement Address Table
Address (Hex) Address (dec) Parameter Data Type Property
0200H- 0201H 512- 513 Voltage Float R
0202H- 0203H 514- 515 Current Float R
0204H- 0205H 516- 517 Power Float R
0206H- 0207H 518- 519 AO1 Float R
Appendix
0208H- 0209H 520- 521 AO2 Float R
020AH- 020BH 522- 523
020CH- 020DH 524- 525
DI1 Count
Value
DI2 Count
Value
UINT32 R
UINT32 R
NOTE: The high byte is followed by the low byte.
Running Time
The data space below is for running time; function code: 03 Read.
Table B-15 Running Time Address Table
Address (Hex) Address (dec) Parameter Range Data Type Property
0280H-0281H 640- 641
0282H- 0283H 642- 643
Meter run-
ning time
Load run-
ning time
0 ~
999999999
0 ~
999999999
long R
long R
71
Find Quality Products Online at: sales@GlobalTestSupply.com
www.GlobalTestSupply.com
Page 77

V: 1.0 Revised: Jan. 2018
AcuDC 240 Series
Energy
The data space below is for energy;
Function Code: 03 Read; 16 Write
Address (Hex) Address (dec) Parameter Range Data Type Property
0300H- 0301H 768- 769 Import energy 0 ~ 999999999 long R/W
0302H- 0303H 770- 771 Export energy 0 ~ 999999999 long R/W
0304H- 0305H 772- 773 Total energy 0 ~ 999999999 long R/W
DC Energy & Power meters
Table B-16 Energy and Charge (Ah) Address Table
0306H- 0307H 774- 775 Net energy
0308H- 0309H 776- 777 Import Ah 0 ~ 999999999 long R/W
030AH- 030BH 778- 779 Export Ah 0 ~ 999999999 long R/W
030CH- 030DH 780- 781 Total Ah 0 ~ 999999999 long R/W
030EH- 030FH 782- 783 Net Ah
0 ~ ±
999999999
0 ~ ±
999999999
long R/W
long R/W
The relationship between the register value and the real value (Rx is the register value).
Table B-17 The relationship between Register Value and Real Value
Parameter Relationship Unit
Voltage Real=Rx V
Current Real=Rx A
Power Real=Rx kW
Energy Real=Rx/100 kWh
Ah Real=Rx/100 Ah
AO Real=Rx
Running Time Real=Rx/100 Hour
72
Find Quality Products Online at: sales@GlobalTestSupply.com
www.GlobalTestSupply.com
V or mA(depends on the AO
Type)
Page 78

V: 1.0 Revised: Jan. 2018
Real-Time Clock Area
(Data obtained only by AcuDC 243 meter equipped with storage function.)
Table B-18 Real Time Clock Address Table
Address (Hex) Address (dec) Parameter Range Data Type Property
0284H 644 Year 2000 ~ 2099 Word R/W
0285H 645 Month 1 ~ 12 Word R/W
0286H 646 Day 1 ~ 31 Word R/W
0287H 647 Hour 0 ~ 59 Word R/W
0288H 648 Minute 0 ~ 59 Word R/W
0289H 649 Second 0 ~ 59 Word R/W
MAX records
(Data obtained only by AcuDC 243 meter equipped with storage function.)
Appendix
Function code: 03H for reading
Table B-19 MAX Records Address Table
Address
(Hex)
0400H-
0401H
0402H
0404H High byte: minute; low byte: second
0405H-
0406H
0407H
0409H High byte: minute; low byte: second
040AH-
040BH
Parameter Range Data Type Property
Voltage MAX Float R
High byte: year; low byte: month
Time of occurrence,
Year, Month, Day, Hour,
Minute, Second
Current MAX Float R
High byte: year; low byte: month
Time of occurrence,
Year, Month, Day, Hour,
Minute, Second
Power MAX Float R
Word R0403H High byte: day; low byte: hour
Word R0408H High byte: day; low byte: hour
040CH
Time of occurrence,
040DH High byte: day; low byte: hour
040EH High byte: minute; low byte: second
Find Quality Products Online at: sales@GlobalTestSupply.com
Year, Month, Day, Hour,
Minute, Second
www.GlobalTestSupply.com
High byte: year; low byte: month
Word R
73
Page 79

V: 1.0 Revised: Jan. 2018
AcuDC 240 Series
MIN records
(Data obtained only by AcuDC 243 meter equipped with storage function.)
Function code: 03H for reading
DC Energy & Power meters
Table B-20 MIN Records Address Table
Address
(Hex)
0460H-
0461H
0462H 1122
0464H 1124
0465H-0466H 1125-1126 Current MIN Float R
0467H 1127
Address
(dec)
1120-1121 Voltage MIN Float R
Parameter Range Data Type Property
High byte: year; low byte:
Time: Year, Month,
Day, Hour, Minute,
Second
High byte: minute; low byte:
High byte: year; low byte:
Time: Year, Month,
Day, Hour, Minute,
Second
month
Word R0463H 1123 High byte: day; low byte: hour
second
month
Word R0468H 1128 High byte: day; low byte: hour
0469H 1129
046AH-
046BH
046CH 1132
046EH 1134
74
1130-1131 Power MIN Float R
Time: Year, Month,
Day, Hour, Minute,
Second
High byte: minute; low byte:
second
High byte: year; low byte:
month
Word R046DH 1133 High byte: day; low byte: hour
High byte: minute; low byte:
second
Find Quality Products Online at: sales@GlobalTestSupply.com
www.GlobalTestSupply.com
Page 80

V: 1.0 Revised: Jan. 2018
Data Logging Setting
(Data obtained only by AcuDC 243 meter equipped with storage function .)
Function code: 03H for reading, 16H for presetting
Table B-21 Data Logging Setting Address Table
Appendix
Address (Hex) Address (dec) Parameter Range Initial Value Data Type Property
0500H 1280
0501H 1281
0502H 1282 Interval time 1 ~ 1440 (Minute) 5 Word R/W 1
0503H 1283
0504H 1284
0505H 1285
0506H 1286
Enable data
logging
Mode of data
logging
Start time
(year, month)
Start time
(day, hour)
Start time
(minute)
End time
(year, month)
0: Disable
1: Enable
0: mode 1, continuous
mode (start after set
parameters)
1: mode 2, timing start
and stop
2: mode 3, specifies
the start time (hour,
minute)
High Byte: year(00~99)
Low Byte: Month(1-12)
High Byte: day(1~31)
Low Byte: hour (0~23)
High Byte: min-
ute(0~59)
Low Byte: reserve
High Byte: year(00~99)
Low Byte: Month(1-12)
0 Word R/W 1
0 Word R/W 1
Word R/W 1
Word R/W 1
Word R/W 1
(Only
used in
mode 2)
Word R/W 1
Register
Number
0507H 1287
0508H 1288
0509H 1289
050AH 1290
050BH-
0524H
1291-1316
Find Quality Products Online at: sales@GlobalTestSupply.com
End time
(day, hour)
End time
(minute)
The specified
start recording
time: hour and
minute
Number of regis-
ters in a log
The contents of
a log (ModBus
Register)
www.GlobalTestSupply.com
High Byte: day(1~31)
Low Byte: hour (0~23)
High Byte: min-
ute(0~59)
Low Byte: reserve
High Byte: hour(0~23)
Low Byte: min-
ute(0~59)
Register number: 1~26 0 Word R/W 1
(Only
used in
mode 3)
0 Word R/W 26
Word R/W 1
Word R/W 1
Word R/W 1
75
Page 81

V: 1.0 Revised: Jan. 2018
AcuDC 240 Series
The contents of one log
Users can select any parameters they want to log from the 13 parameters. In order to
generate historical logs for the selected parameters, users should program the meter so
that selected parameters from the corresponding Modbus registers can be copied to the
historical log record. That is to say, if you want to log a certain parameters, only need to set
the corresponding Modbus address in the register of data logging. One parameter in the
meter is taking up two Modbus registers. The 13 parameters are voltage, current, power,
import energy, export energy, total energy, net energy, , import Ah, export Ah, total Ah, net
Ah, DI1 count value and DI2 count value.
For example” log the current data, register 0200H and 0201H programmed to be
recorded.
The number of Registers in a log
In a log, a parameter using two registers, if you select all of 13 parameters, there are 26
registers to be used.
DC Energy & Power meters
76
Find Quality Products Online at: sales@GlobalTestSupply.com
www.GlobalTestSupply.com
Page 82

V: 1.0 Revised: Jan. 2018
Log Statue Block
(Data obtained only by AcuDC 243 meter equipped with storage function make sense.)
Function code: 03H for reading
Table B-22 Log Status Address Table
Appendix
Address (Hex) Address (dec) Parameter Range Data Type Property
0700H-0701H 1792-1793 MAX Records 0~350890 Unit32 R 2
0702H-0703H 1794-1795 Used Records 0~350890 Unit32 R 2
0704H 1796
0705H-0706H 1797-1798
0707H-0708H 1799-1800
0709H
070AH
070BH 1803
070CH
070DH
070EH 1806
070FH 1807 Memory status
1801
1802
1804
1805
MAX records in the
Retrieval window
Newest NO. of
records
Oldest NO. of
records
Newest Record Time
stamp
Oldest Record Time
stamp
High Byte: year(00~99)
Low Byte: Month(1-12)
High Byte: day(1~31)
Low Byte: hour (0~23)
High Byte: minute(0~59)
Low Byte: reserve
High Byte: year(00~99)
Low Byte: Month(1-12)
High Byte: day(1~31)
Low Byte: hour (0~23)
High Byte: minute(0~59)
Low Byte: reserve
High Byte: reserve
Low Byte: FEH, memory is
erasing; other, erased
Word R 1
Unit32 R 2
Unit32 2
Word R 3
Word R 3
Word R 1
Register
Number
1) MAX Record
The MAX number of Record of logs is determined by the maximum capacity and the
memory space occupied by one log.
2) Number of records
Number of records is the number of records that has currently been logged, which should
be less than or equal to MAX number.
77
Find Quality Products Online at: sales@GlobalTestSupply.com
www.GlobalTestSupply.com
Page 83

V: 1.0 Revised: Jan. 2018
AcuDC 240 Series
3) MAX Records in the Retrieval Window
In the Retrieval Window, the maximum number of records can be read.
4) Newest Serial No. of Records
The serial number of the first record is 1, and then is accumulated by 1 as one more record
is put in. The system will delete the old record when the storage memory is full, but the
serial number will not reset, continue to accumulate by the latest serial number.
5) Oldest Serial No. of Records
After storage memory is full, the system will delete the old data to record new data. The
Oldest Serial No. of records is the serial number of the oldest record under the current
state.
6) Latest Record Timestamp
The recording time of the latest record
7) Oldest Record Timestamp
DC Energy & Power meters
The recording time of the oldest record
8) Memory Status
Check the status of the memory. To check whether it is in erasing.
Log Statue Block
(Data obtained only by AcuDC 243 meter equipped with storage function make sense.)
Function code: 03H for reading, 16H for presetting.
Table B-23 Log Retrieval Address Table
Address
(Hex)
0601H-0602H 1537-1538 Starting Record No.
0603H 1539
0604H-067BH 1540-1659 Window
Address
(dec)
Parameter Range Data Type Property
Records number(High
byte)
Record status(low
byte) read only, write
invalidate
Oldest No. of Records ~ Newest No. of
High byte: 1~ the MAX record number in
Low byte: 0~ the MAX record number in
a window: effective number of records in
FDH: Non-effective ‘Start record No.’ or
invalid ‘record number in a window’;
Window data: time mark(6 Bytes) +
Records +1
the window
the window;
FEH: memory is erasing;
FFH: Non-effective data
[data1~dataN](4N bytes)
Invalid data set to 0
UNIT32 R/W
Word R/W
78
Find Quality Products Online at: sales@GlobalTestSupply.com
www.GlobalTestSupply.com
Page 84

V: 1.0 Revised: Jan. 2018
1) Starting Record No.
The Starting Record No. is accumulated by the number of records in one window after
reading the records in that window. If the new Starting Record No. is larger than the
Latest Serial No., then the Starting Record No. equals to the Latest Serial No. of Records
plus 1.
For example, the initial Starting Record No. of Records is 34, after reading 8 records in one
window, the Starting Record No. automatically turns into 42.
2) Records number
The number of records that fit within a window, which should not be larger than the
maximum record number in one window
The MAX number of records is 240 divided by the size of bytes of one record.
3) Record status
This parameter shows the status of the read data in current window, and is characterized
by the validity of read data. If display data is invalid, window data should be ignored.
If parameters set up correctly and read data is correct, it will return a valid data record
number, otherwise it will return error. This parameter is read-only.
Appendix
0~maximum records that one window can display: number of valid records in the
window.
FDH: Invalid ‘Starting record No.’ or invalid ‘record number in a window’;
FEH: Memory is erasing
FFH: The window is displaying invalid data
4) Window
Window displays valid record data, read-only.
The contents of each record is: time mark (6 bytes) + [data1 ~ data N] (4N bytes).
Note: the number of records in the window is an integer.
79
Find Quality Products Online at: sales@GlobalTestSupply.com
www.GlobalTestSupply.com
Page 85

V: 1.0 Revised: Jan. 2018
AcuDC 240 Series
System Parameter Setting Address
The system parameter settings, including communication settings and I/O settings, use
Function Code 03H to read, Function Code 16H to preset.
DC Energy & Power meters
Table B-24 System Parameter Settings
Address
(Hex)
0100H 256 Password 0~9999 0000 Word R/W
0101H 257 Device Address 1~247 1 Word R/W
0102H 258 Baud Rate
0103H 259 Parity Setting
0104H 260
0105H 261
0106H 262
0107H 263
0108H 264
0109H 265 AO1 Parameter
010AH 266
Address
(dec)
Parameter Range Default Data Type Property
Full Range
Current Value
Full Range
Shunt Value
Current Hall
Effect Sensor(V)
Current
Hall Effect
Sensor(mA)
Full Range
Voltage Value
Voltage
Hall Effect
Sensor(mA)
AO1 Lower Limit
Sign
1200; 2400; 4800
9600; 19200; 38400
0: Even; 1: Odd;
2: None 2, and
3: None 1
20~50000A 20 Word R/W
50~100mV 100 Word R/W
0: 0~±5V;
1: 0~±4V
0: 4~20mA;
1: 4~12~20mA
5~9999 1000 Word R/W
0: 0~±5V;
1: 0~±4V
0: voltage;
1: current;
2: power
0: +; 1: -; 2: ± 0 Word R/W
19200 Word R/W
3 Word R/W
1
1 Word R/W
0 Word R/W
010BH 267 AO1 Lower Limit 0 ~ 100(%) 0 Word R/W
010CH 268
010DH 269
010EH 270 AO2 Parameter
010FH 271
0110H 272
0111H 273
80
Find Quality Products Online at: sales@GlobalTestSupply.com
AO1 Upper
Limit Sign
AO1 Upper
Limit
AO2 Lower
Limit Sign
AO2 Lower
Limit
AO2 Upper
Limit Sign
0: +; 1: -; 2: ± 0 Word R/W
0 ~ 100(%) 100 Word R/W
0: voltage;
1: current;
2: power
0: +; 1: -; 2: ± 0 Word R/W
0 ~ 100(%) 0 Word R/W
0: +; 1: -; 2: ± 0 Word R/W
0 Word R/W
www.GlobalTestSupply.com
Page 86

V: 1.0 Revised: Jan. 2018
Appendix
Address
(Hex)
0112H 274 AO2 Upper Limit 0 ~ 100(%) 100 Word R/W
0113H 275 RO1 Mode
0114H 276
0115H 277
0116H 278
0117H 279
011AH 282 RO2 Mode
011BH 283
011CH 284
011DH 285
011EH 286
011FH0120H
0121H 289
Address
(dec)
280-281
287-288
Parameter Range Default Data Type Property
RO1 Momentary
Time Delay
RO1 Alarm Pa-
rameter
RO1 Alarm In-
equality
RO1 Alarm Time
Delay
RO1 Alarm
Threshold
RO2 Momentary
Time Delay
RO2 Alarm Pa-
rameter
RO2 Alarm In-
equality
RO2 Alarm Time
Delay
RO2 Alarm
Threshold
Backlight Bright-
ness Level
0: Latch; 1: Momentary;
2: Alarm
300~5000ms 1000 Word R/W
0: No Alarm; 1: Voltage; 2:
Current; 3: Power
0: Smaller than;
1: Larger than
0~255 S 5 Word R/W
The same as full range
values
0: Latch; 1: Momentary;
2: Alarm
300~5000ms 1000 Word R/W
0: No Alarm; 1: Voltage; 2:
Current; 3: Power
0: Smaller than;
1: Larger than
0~255 S 5 Word R/W
The same as full range
values
1~5 5 Word R/W
2 Word R/W
0 Word R/W
0 Word R/W
Float
2 Word R/W
0 Word R/W
0 Word R/W
Float R/W
0122H 290 Clear Energy 0X0A: Enable Word W
0123H 291
0124H 292
0125H 293 DI Working Mode
0126H 294
0127H 295 Clear Ah 0X0A: Effective Word W
0128H 296
0129H 297
Clear Meter Run-
ning Hour
Clear Load Run-
ning Hour
Clear DI Count
Value
Clear MAX/MIN
Value
Clear Data Log-
ging
0X0A: Enable Word W
0X0A: Enable Word W
according to Bit value:
0: Level mode;
1: Count mode;
Bit0: DI1 working mode;
Bit1: DI2 working mode
according to Bit value:
0: Not clear;
1: Clear
Bit0: Clear DI1
Bit1: Clear DI2
0X0A: Effective Word W
0X0A: Effective Word W
3 Word R/W
Word W
81
Find Quality Products Online at: sales@GlobalTestSupply.com
www.GlobalTestSupply.com
Page 87

V: 1.0 Revised: Jan. 2018
AcuDC 240 Series
DI Status
Use Function Code 02 to read DI status.
Address (Hex) Address (dec) Parameter Range Data Type Property
0000H 0 DI1 1=ON; 0= OFF Bit R
0001H 1 DI2 1=ON; 0= OFF Bit R
Relay Status
Use Function Code 01 to read Relay Status, Function Code 05 to control.
Address (Hex) Address (dec) Parameter Range Data Type Property
DC Energy & Power meters
Table B-25 DI Address Table
Table B-26 Relay Status Table
0000H 0 DO1 1=ON; 0= OFF Bit R/W
0001H 1 DO2 1=ON; 0= OFF Bit R/W
NOTE:
1. Data Type: ‘Bit’ is 1-bit binary; ‘Word’ is 16-bit unsigned integer; ‘Integer’ is 16-bit signed
integer; ‘Float’ is 32-bit floating point.Table B-26 Relay Status Table
2. Read/Write: ‘R’ is read only, reading DI is Function Code 02H; reading DO is Function
Code 01H; reading the other parameter is 03H; ‘R/W’ is read/write, write(control) relay by
Function Code 05H; Use Function Code 10H to write system parameters. Writing into nonwritable address is forbidden.
82
Find Quality Products Online at: sales@GlobalTestSupply.com
www.GlobalTestSupply.com
Page 88

V: 1.0 Revised: Jan. 2018
C. Ordering Information
AcuDC 240
Appendix
Power Supply Option
Current Option
Voltage Option
Datalogging
Communication
I/O Option
P1: 100-240Vac 50/60Hz, 100-300Vdc
P2: 20-60Vdc
A0: 0~±10A
A1: Shunt (50~100mV)
A2: Current Hall Effect Sensor (4~20mA/12mA±8mA)
A3: Voltage Hall Effect Sensor (0~±5V/0~±4V)
1000V: Nominal Input Voltage 1000Vdc
600V: Nominal Input Voltage 600Vdc
300V: Nominal Input Voltage 630Vdc
60V: Nominal Input Voltage 60Vdc
5V: Nominal Input Voltage (0-5V/0-4V), ratio settable
NC: No Communication
C: RS485, Modbus RTU
X0: No I/O
X1: 2DI+2AO (4~20mA/0~20mA)
X2: 2DI+2AO (0~5V/1~5V)
X3: 2DI+2RO
X4: 2DI+2DO
X5: 2DI+ ±15Vdc
ND: No Datalogging
D: Datalogging (Acudc 243 Only)
Model
AcuDC 241: Voltage Meter
AcuDC 242: Current Meter
AcuDC 243: Multifunction
Example: AcuDC 243 - 300 - A2 - P1 - X1 - C - D
NOTE: When the input voltage is above 1000V, or the system design requires an isolation
sensor, the voltage input can be selected as Via Hall Effect Sensor (0~5 V). The Voltage Hall
Effect Sensor output range requires 0~5 V.
83
Find Quality Products Online at: sales@GlobalTestSupply.com
www.GlobalTestSupply.com
Page 89

V: 1.0 Revised: Jan. 2018
AcuDC 240 Series
D. Glossary of Definitions
AWG: American Wire Gauge, is an U.S. standard of wire conductor sizes. The ‘gauge’ is
related to the diameter of the wire. Larger ‘gauge’ means smaller diameter and thinner
wire.
AO (Analog Output): is a measurable electrical signal with a defined range that is
generated by a controller and sent to a controlled device. The AcuDC 240 series power
meter can output analog voltage or analog current. When it outputs analog voltage, the
range of voltage is from 0 to 5V or from 1 to 5V. When it outputs analog current, the range
of current is from 0 to 20mA or from 4 to 20mA.
Baud Rate: Baud rate is the data transmission rate. In the AcuDC 240 series power meter,
the Baud Rate is used to define the communication rate of RS485, which can be set as
1200, 2400, 4800, 9600, 19200 or 38400.
Charge: the flow of electric charge is called electric current. In the AcuDC 240 series
power meter, the unit of charge is Ah (ampere hour), which equals to the charge
transferred by a steady current of oneampereflowing for one hour
DC Energy & Power meters
Import Charge: Charge that flows to the load from the grid or source
Export Charge: Charge that flows to the grid or source from the load
Total Charge: absolute sum of import charge and export charge
Net Charge: algebraic sum of import charge and export charge
DC: Direct Current is the electrical current which flows consistently in one direction.
DI counter: Digital Input counter for interfacing with devices that output pulses such as a
gas meter.
EMC filter: is a passive electronic device (comprised of multiple components) for
suppressing conducted interference found on any signal or power line to improve the
immunity from EMI (Electromagnetic Interference) signals in the surrounding setting.
Energy: is the integration of power over a defined time increment, measured in unit
of kWh (kilowatt hours). A kWh represents a constant load of 1000 watts for one hour.
Almost all electric bills are based on energy, so energy is a very important measurement
parameter.
Import Energy: energy that is consumed by the load from the grid or source.
Export Energy: energy that is absorbed by the grid or source from the load.
Total Energy: absolute sum of import energy and export energy
Net Energy: algebraic sum of import energy and export energy
84
Find Quality Products Online at: sales@GlobalTestSupply.com
www.GlobalTestSupply.com
Page 90

V: 1.0 Revised: Jan. 2018
Hall Effect Sensor: is atransducer that is used to measure current and voltage.
I/O (Input/Output) Module: is interface card where data is transferred to accomplish a
function.
Parity: refers to a technique of checking whetherdatahas been lost or written over when
it is moved from one place in storage to another or when transmitted. Usually parity has
odd parity, even parity or no parity. ‘No parity’ means it will not transmit or check a parity
bit.
Power: is the rate at whichelectric energyis transferred by anelectric circuit. Power is an
instantaneous reading. Power = Voltage X Current, measured in unit of watts.
RO(Relay Output): A relay is an electrical switch that opens and closes under control of
another electrical circuit. Existence of relays as outputs makes it easier to connect with
external devices.
Shunt: is a device which allowselectric currentto pass around another point in
thecircuitby creating a low resistance path.
Appendix
85
Find Quality Products Online at: sales@GlobalTestSupply.com
www.GlobalTestSupply.com
 Loading...