

Page 1
Technical Data Sheet No.: VTX180002 Rev. D
Date of Issue: September 2010
US Patent No. 4,862,750
OPERATING MANUAL
Vortex Meter
Page 2

Aalborg7is a registered trademark of Aalborg Instruments & Controls.
NOTE: Aalborg7 reserves the right to change designs and dimensions at its sole
discretion at any time without notice. For certified dimensions please contact Aalborg7.
Page 3

TABLE OF CONTENTS
1. GENERAL INFORMATION...................................................
1.1 General................................................................................................
1.2 Principles of Operation........................................................................
1.3 Sensor Operation.................................................................................
1.4 Calibration Factor.................................................................................
2. HANDLING AND STORAGE.................................................
2.1 Handling Precautions..........................................................................
2.2 Storage................................................................................................
3. INSTALLATION................................................................
3.1 Installation...........................................................................................
3.2 Selecting the Installation Site...............................................................
3.3 Piping Guidelines.................................................................................
3.4 Temperature and Pressure Taps..........................................................
3.5 Orientation...........................................................................................
3.6 Alignment Rings and Gaskets..............................................................
3.7 Identification Check..............................................................................
3.8 Installation Procedure..........................................................................
4. ELECTRONICS.....................................................................
4.1 Description................................................................................................
4.2 Specifications............................................................................................
4.3 Handling and Storage................................................................................
4.4 Mounting....................................................................................................
4.5. Wiring Connections..................................................................................
4.5.1 Power Supply Connections.......................................................................
4.5.2 Analog 4-20 mA Output Signals Connections............................................
4.5.3 Programmable optically isolated Output Signals Connections....................
4.5.4 Programmable optically isolated Flow Pulse Output
Signal Connections................................................................................
4.5.5 Communication Parameters and Connections..........................................
5. LCD KEYPAD OPERATION: DATA ENTRY AND CONFIGURATION...........
5.1 Display Indications......................................................................................
5.2 Menu Sequence.......................................................................................
5.3 Parameter Entry.........................................................................................
5.3.1 Submenu Program protection....................................................................
5.3.2 Submenu Flow Meter Info..........................................................................
5.3.3 Submenu Measuring Units........................................................................
5.3.4 Submenu L1 Alarm Menu...........................................................................
5.3.4.1 Submenu L2 Flow Alarm..........................................................................
5.3.4.2 Submenu L2 Temperature Alarm (*optional).......................................
1
1
1
1
2
2
2
3
3
3
3
5
5
6
6
7
7
8
8
9
10
11
11
12
13
13
14
15
15
15
19
22
22
23
24
26
26
29
Page 4

5.3.4.3 Submenu L2 Pressure Alarm (*optional).............................................
5.3.5 Submenu L1 Totalizer Menu................................................................
5.3.5.1 Submenu L2 Totalizer#1 and Totalizer#2 Menus..................................
5.3.5.2 Submenu L2 Pulse Output Menu................................................................
5.3.6 Submenu L1 Output Menu...................................................................
5.3.6.1 Submenu L2 Analog 4-20mA Menus....................................................
5.3.6.2 Submenu L2 Digital Optical Outputs Menus.........................................
5.3.6.3 Submenu L2 RS-485 Address Menus..................................................
5.3.7 Submenu L1 Calibration Menu................................................................
5.3.7.1 Submenu L2 PWM DSP Menu................................................................
5.3.7.2 Submenu L2 FFT DSP Menu................................................................
5.3.7.3 Submenu Meter Size.............................................................................
5.3.7.4 Submenu Meter Full Scale Range........................................................
5.3.7.6 Submenu Meter Low Flow Cut Off.......................................................
5.3.7.7 Submenu Meter Low Frequency Cut Off..............................................
5.3.7.8 Submenu Meter High Frequency Cut Off.............................................
5.3.7.9 Submenu Meter Vortex DSP Filter Coefficient..........................................
5.3.7.10 Submenu Meter Calibration Pilot Timer...............................................
5.3.8 Submenu L1 Date/Time Adjust Menu..................................................
5.3.9 Submenu L1 Fluid Menu........................................................................
5.3.9.1 Submenu L2 Flowing Fluid Menu........................................................
5.3.9.2 Submenu L2 Goyal-Doraiswamy Menu................................................
5.3.9.3 Submenu L2 API 2540 Menu..............................................................
5.3.9.4 Submenu Nat Gas AGA8 Menu............................................................
5.3.9.5 Submenu Other Gases Menu...............................................................
5.3.9.6 Submenu Cust Flow. Cond Menu........................................................
5.3.9.7 Submenu STD Temp. (F)......................................................................
5.3.9.8 Submenu STD Pres. (PSIA).................................................................
5.3.9.9 Submenu NORM Temp. (C).................................................................
5.3.9.10 Submenu NORM Pres. (KPA)..............................................................
5.3.10 Submenu L1 Diagnostic Menu.............................................................
5.3.10.1 Submenu L2 System Events Reg. Menu.............................................
5.3.10.2 Submenu L2 System Events Log Menu...............................................
5.3.10.3 Submenu Raw Pulse Counts................................................................
5.3.10.4 Submenu Pulse Frequency..................................................................
5.3.10.5 Submenu PWM Frequency...................................................................
5.3.10.6 Submenu AWD Frequency....................................................................
5.3.10.7 Submenu DSP FFT Output...................................................................
5.3.10.8 Submenu DSP FFT Output...................................................................
5.3.10.9 Submenu DSP FFT Average..................................................................
5.3.10.10 Submenu Piezo Sensors RMS.............................................................
5.3.10.11 Submenu Sensor Attenuation...............................................................
5.3.10.12 Submenu T/P ADC Output...................................................................
5.3.10.13 Submenu DAC Outputs Value..............................................................
5.3.10.14 Submenu CPU Temperature.................................................................
30
32
32
34
36
37
37
38
38
39
42
44
44
45
45
45
45
45
46
46
46
48
49
50
50
50
52
52
52
52
52
53
57
60
60
60
60
60
60
60
60
61
61
61
61
Page 5

5.3.11 Submenu L1 Display Menu......................................................................
5.3.11.1 Submenu Display Mode...........................................................................
5.3.11.2 Submenu Screen Cycle Time...................................................................
5.3.11.3 Submenu Screen Mask............................................................................
5.3.12 Submenu L1 Data Log Menu....................................................................
5.3.12.1 Submenu Data Logger Mode...................................................................
5.3.12.2 Submenu Data Log Configuration...........................................................
5.3.12.3 Submenu Log # of Samples.....................................................................
5.3.12.4 Submenu Process Variable.......................................................................
5.3.12.5 Submenu Samples Interval......................................................................
5.3.12.6 Submenu DL Start Condition...................................................................
5.3.12.7 Submenu DL Stop Condition...................................................................
5.3.12.8 Submenu Data Log Status.......................................................................
6. ANALOG CIRCUITRY CALIBRATION.............................................
6.1 Analog 4-20 mA output Circuitry calibration...........................................
6.1.1 Initial setup..............................................................................................
6.1.2 Analog 4-20 mA channel#1 output calibration.........................................
6.1.3 Analog 4-20 mA channel#2 output calibration.........................................
6.2 Temperature and Pressure Sensors Calibration*......................................
7. START UP...........................................................................
7.1 Cautions Prior to Start Up........................................................................
8. TROUBLESHOOTING.............................................................
8.1 Common Conditions................................................................................
8.2 Troubleshooting Guide.............................................................................
APPENDIX
APPENDIX A EEPROM VARIABLES........................................................
APPENDIX B VORTEX METER ASCII SOFTWARE INTERFACE COMMANDS........
APPENDIX C MECHANICAL DRAWINGS...................................................
APPENDIX D ELECTRICAL INTERCONNECT OPTIONS..................................
APPENDIX E CIRCUIT DIAGRAMS........................................................
WARRANTY..................................................................................
61
61
62
62
62
62
63
63
63
63
63
64
64
65
65
66
66
67
68
68
68
69
69
70
73
80
102
104
108
112
Page 6
1
1. GENERAL INFORMATION
1.1 General
Vortex Shedding is not new. Da Vinci observed vortex shedding in 1513. Von
Karman provided an empirically determined formula for it in 1911-1912. One
observes it as eddies downstream of a rock or a piling in a fast moving stream.
Yet, it wasn’t until it was successfully developed and installed in the late 1960’s
that this significant development in the science of flow measurement was given
considerable attention by industry.
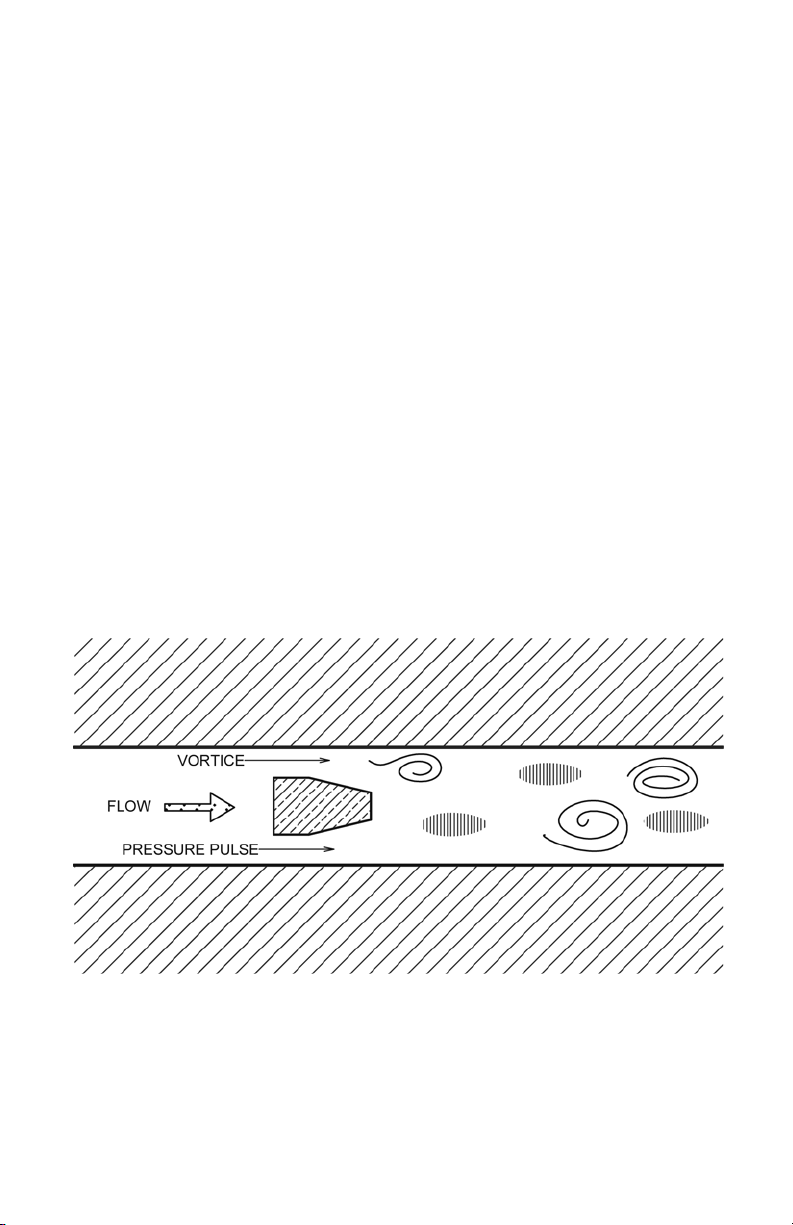
1.2 Principles of Operation
With the controlled use of an obstruction installed in a given pipeline, vortices
are generated downstream of the obstruction when fluid or gas flows through
a pipe. A vortex is a swirling low pressure eddy which forms alternately from
side to side of the bluff body. With each eddy, there is formed a corresponding
high pressure pulse opposite the bluff body. (See Figure 1.) These pulses are
directly proportional to the velocity of a given fluid. Each pulse represents given
volumetric units of fluid for a given line size. Since each pulse represents a unit
volume, the output is therefore linear with respect to flow rate.
FIGURE 1
Page 7
2
1.3 Sensor Operation
Two pressure sensing devices are mounted in the pipe wall of the flow meter.
Inserted in its center is a stainless steel bluff body, on either side
of which alternating stresses are induced in response to the forming and
shedding of vortices. The piezo electric sensors detect the pressure pulses, and
their energy content is amplified in the preamplifier and processed to furnish an
output proportional to the rate of flow.
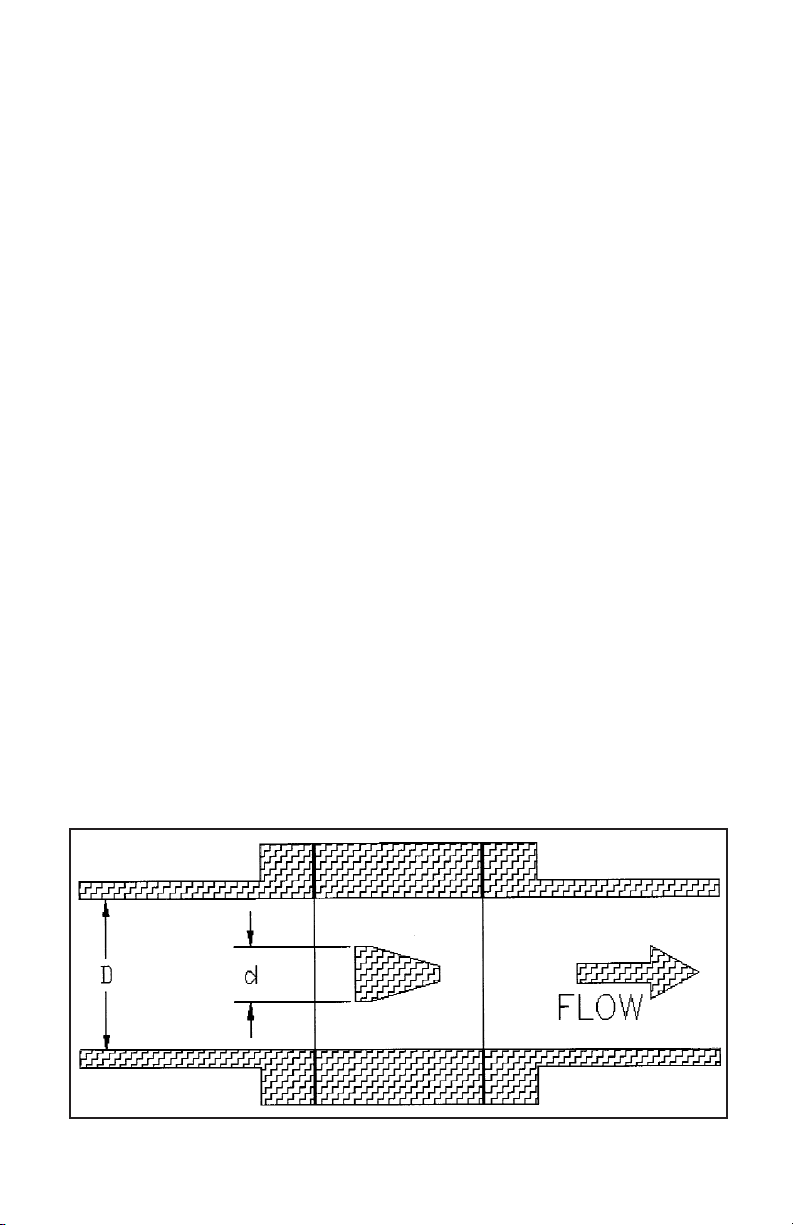
1.4 Calibration Factor
The frequency at which vortices are shed is a linear function of fluid velocity,
and therefore, a measure of flow. Vortex frequency is insensitive to density (temperature, pressure), the total volumetric flow of compressible fluids should however be adjusted to flow conditions other then calibration conditions. In the range
covered by the particular flowmeter, vortex frequency is insensitive to specific
gravity, viscosity, and temperature of the fluid and depends only upon the width
(d) in inches and shape of the flow element, and the inside diameter (D) of the
pipeline in inches.
The frequency is: F = SV/d
where : F = Karman vortex frequency
S = constant (Strouhal Number)
V = fluid velocity at the flow element
d = face width of the element
The frequency relationship is accurately linear and reproducible, eliminating the
need for “wet calibration.” (See Figure 2.)
2. HANDLING AND STORAGE
FIGURE 2
Page 8

3
2.1 Handling Precautions
The vortex flow meter has been tested at the factory. When the instrument is
received, it should be inspected for damage due to mishandling during
shipment. If damage is evident, report it to the carrier immediately and have
them present when the case is opened. They are responsible for any damage
during shipment. If you have any problems or questions, consult the factory or
your local representative.
2.2 Storage
After receiving the Flow Meter, care should be taken to avoid unnecessary
damage. If the meter is not scheduled to be installed soon after delivery, the
following steps should be observed:
A) After inspection, the meter should be repacked into its original packing.
B) If the meter being stored has been previously installed, care should be
taken to remove all process fluids and corrosives.
C) Select a clean, dry site free of mechanical vibration, shock and chemical
corrosives.
3. INSTALLATION
3.1 Installation
The Aalborg7 vortex flow meter is designed to operate under a wide variety of conditions. To ensure its longevity of operation, precautions should be taken before
and during its installation.
3.2 Selecting the Installation Site
A) The vortex meter requires a minimum of 20 straight diameters upstream
and 5 straight unobstructed diameters of downstream piping. One
diameter is equal to the internal pipe diameter. This is necessary to ensure
regulated formation of vortices. (See Figure 3 for the piping requirements
chart for various piping recommendations.)
B) Choose a site with minimal mechanical vibrations.
C) Avoid areas of high humidity or corrosive atmosphere where possible.
D) When installing the meter, choose a site which is accessible and allows
ease of wiring and maintenance.
Page 9
4
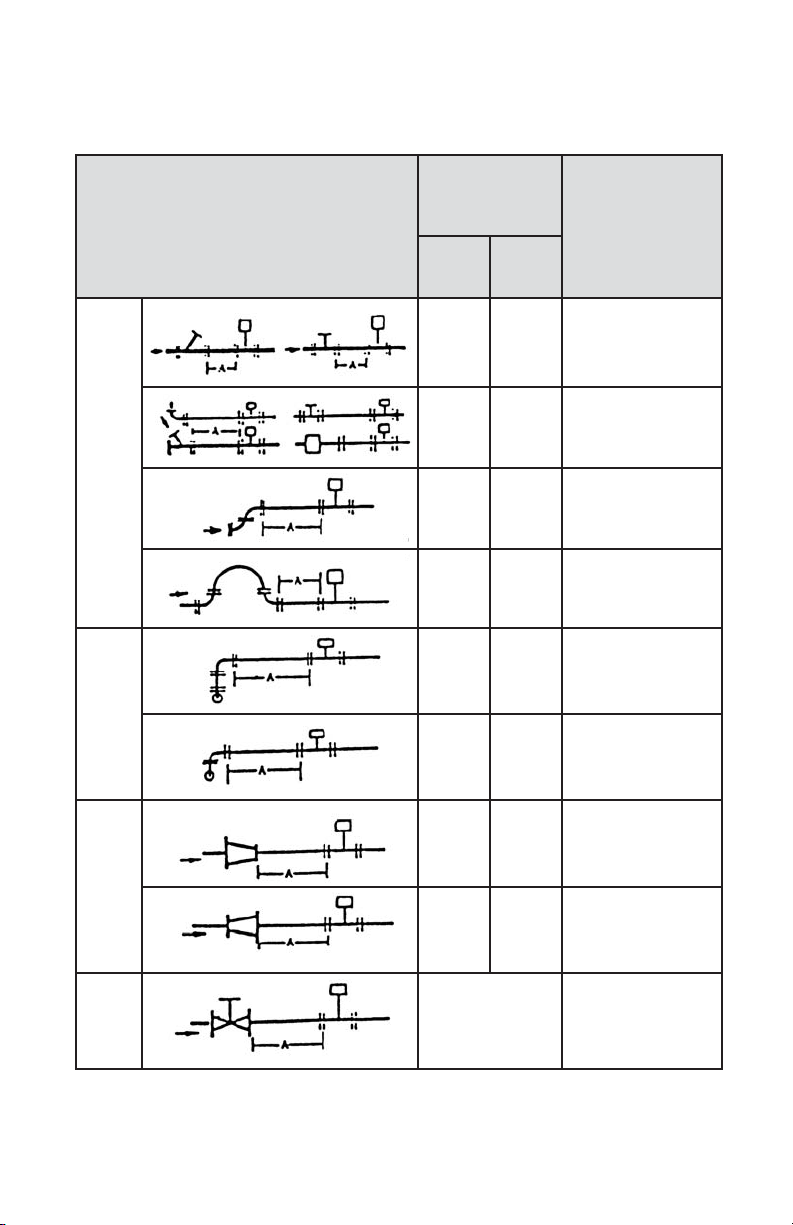
Piping Table
3.3 Piping Guidelines
FIGURE 3
TYPICAL PIPING
Recommended
Straight Pipe
Length “A”
REMARKS
Without
Vanes
With
Vanes
15D* 15D Closed branch
20D 15D
Elbow, Tee,
Branch pipe
25D 15D Elbow, 2 places
25D 15D Long-radius bends
30D
25D
15D
15D
Elbow
Long-radius bend
40D
35D
20D
20D
Elbow
Long-radius bend
20D 15D
Contracting pipe
40D 20D
Expanding pipe
Recommend Meter
Be Installed
Upstream
Regulating,
reducing valves Ball,
check valves
Shut-off valve
ALL FITTINGS IN SAME PLANE
FITTINGS IN
TWO PLANES
VARIED SECTION
VALVES
Page 10

5
Note : Straight pipe length on the downstream side to be 5 pipe
diameters minimum. *D = Pipe internal diameter.
To ensure the high accuracy of flow measurement specified on the identification
sheet, piping and installation instructions must be followed carefully.
A) The pipe immediately up and down stream of the flow meter must be of
sufficient length, straight and free of obstructions. Refer to the piping
requirements chart for exact dimensions (Figure 3).
B) It is recommended that straightening vanes be used on all vortex meters,
but it is not necessary.
C) The schedule of the pipe being used must match the schedule of the
meter for at least 20 diameters upstream and 5 diameters downstream of
the flow meter.
D) When the vortex meter is being used as a controller, it is recommended
that any regulating valve be located downstream of the flow meter.
E) Weld beads on the internal wall of the pipe before or after the flow meter
should be ground flush with the pipe wall before the meter is installed.
F) Proper style and proper size gaskets should always be used when
installing the flow meter.
G) The meter body and signal processor may be rotated into any position
permitted by the pipe flanges. The flow meter has no moving
parts and is not position sensitive.
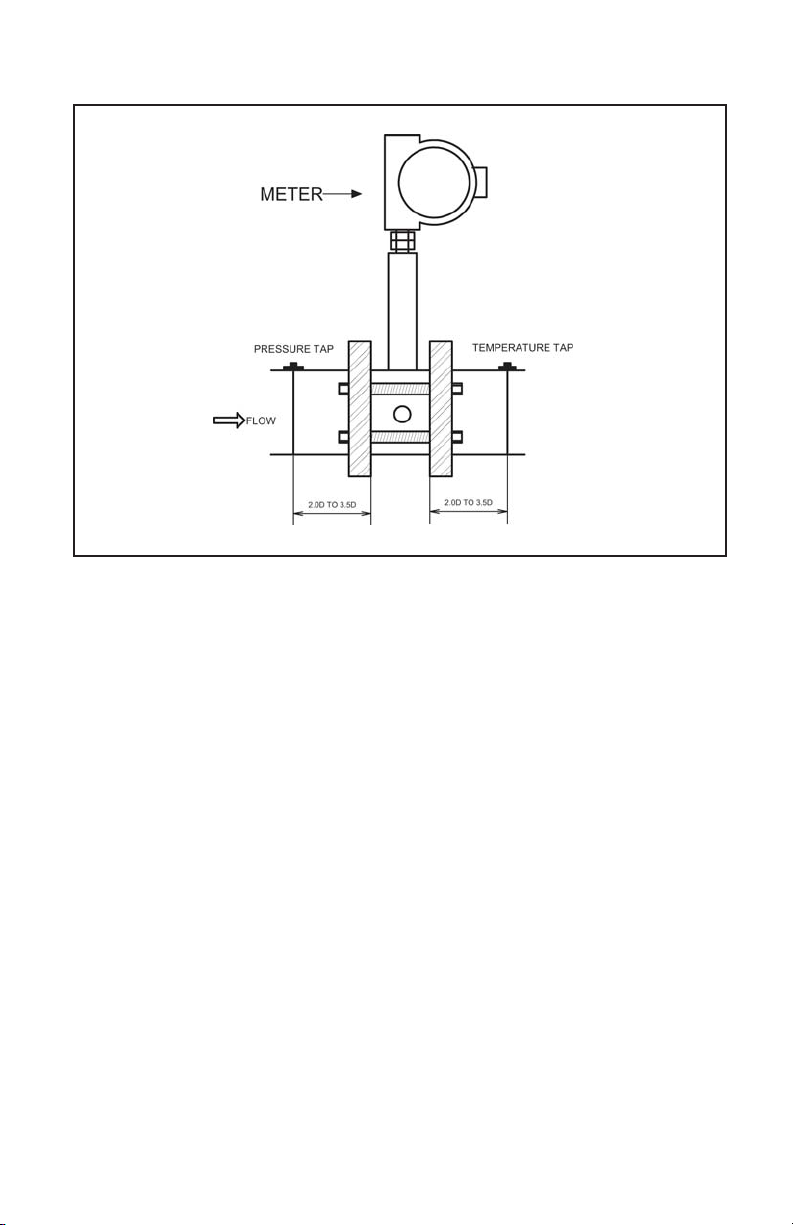
3.4 Temperature and Pressure Taps (Optional)
Installation of temperature and pressure transducers (if used) should be in
accordance with the manufacturer’s specifications.
A) The temperature transducer should be installed between 2.5 and 3.5
diameters from the downstream side of the wafer body. Consult the
factory for the exact dimensions, or refer to additional information at the
end of this manual.
B) The pressure transducer should be installed between 2.0 and 3.5
diameters from the upstream side of the wafer body. Consult the factory
for the exact dimensions, or refer to additional information at the end of
this manual (See Figure 4).
Page 11
6
3.5 Orientation
FIGURE 4
The flow meter uses piezo-electric sensing elements with no moving parts. This
eliminates wear and allows for vertical or horizontal installation.
3.6 Alignment Rings and Gaskets
Alignment rings may be provided with the meter and should be used to ensure
proper alignment of the flow meter to the pipe flanges. Misalignment can result
in percentage errors and can even result in a non-functional meter.
Gasket size and correct installation are essential to accurate measurement.
Care should be taken when installing the flow meter to prevent the slightest
protrusion of the gasket into the flow line. The I.D. of the gasket should be 1/8
inch larger than the I.D. of the meter. This will prevent the gasket from slipping
into the line during installation.
3.7 Identification Check
Before continuing on to the installation of the flow meter, be sure that all of the
parameters of the application match or fall within the limits specified by the identification sheet. If more than one meter has been purchased, check the I.D.
sheet versus the meter tag to ensure that the correct meter is being installed.
Page 12

7
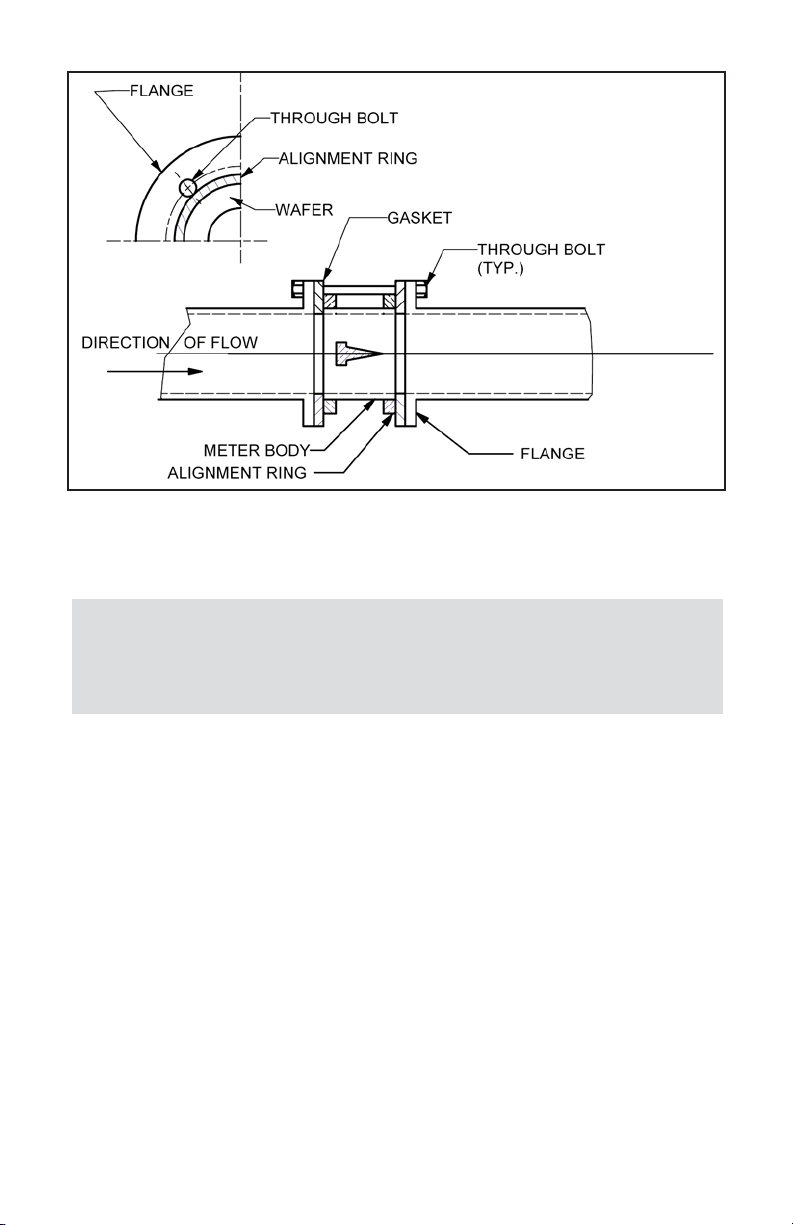
3.8 Installation Procedure
The Vortex Wafer flow meter is a flangeless style meter. It is installed between
pipe flanges using alignment rings through bolts and gaskets. The inside
diameter of the surrounding pipe should be identical to the I.D. of the meter.
The following installation procedures should be used to insure proper alignment
of the flow meter which in turn will insure accuracy:
A) Check the weldmount mating flanges for internal weld bead. If weld bead
exists in the pipeline, it must be ground flush with the pipe wall. Failure to
do this will result in high percentage errors and erratic outputs.
B) Check the pipe for proper alignment on both sides of the installation
location.
C) Check the overall piping. Be sure it meets or exceeds minimum straight
upstream and downstream requirements, approximately 20 diameter
upstream and 5 diameters downstream.
D) Check for adequate clearance on both sides of the signal processor
housing. A minimum distance of 24 inches is required for ease of wiring
and maintenance.
E) For meters over 150 lb. flange ratings, place the two purchased alignment
rings over the ends of the meter body.
F) Place the flange gaskets between the meter body and the opposing
flanges of the pipeline. Be sure that the arrow on the meter body is
indicating the correct direction of flow.
G) Insert the bolts through the bolt holes in the flanges and run the nuts
onto the bolts. Snug the nuts tight enough to hold the alignment.
H) Check the alignment of the meter body to the pipeline. Check the
concentricity of the gaskets, being sure that they are not protruding into
the flow line. The bolts should bear against the outside of the flange bolt
holes. (See Figure 5, end view of flange, alignment ring and gasket.)
Page 13
8
4. ELECTRONICS
WARNING!
WIRING THE TRANSMITTER WITH THE POWER ON MAY RESULT IN
INTERNAL DAMAGE OR LOSS OF MEMORY! PLEASE MAKE ALL
WIRING CONNECTIONS BEFORE SWITCHING ON THE POWER.
4.1 Description
The Smart Transmitter is supplied with all vortex flow meter. It is designed to
be locally mounted or wall mounted, remote from the meter, for easy user access.
The local keypad/display can be programmed to display various process variables:
instantaneous volumetric and mass flow rate, total flow, temperature*, pressure*
and density* in engineering units.
The flow rate can be displayed in 30 different volumetric and 25 mass flow engineering units. Flow meter parameters and functions can be programmed remotely via the RS-232/RS-485 interface or locally via LCD/KeyPad using multi level
menus. Vortex flow meters support various functions including: two programmable flow Totalizers, low, high or range flow, temperature* and pressure* Alarms,
two digital programmable optically isolated outputs, two programmable (for different process variables: volumetric flow, mass flow, temperature*, pressure*) 420 mA analog outputs, programmable optically isolated flow rate Pulse output,
battery backed Real Time Clock [RTC], programmable process Variable Data Log
FIGURE 5
Page 14

9
(total 15872 records) with date and time stamp, extensive Diagnostic events log
and register, and feature a password protected access to the process parameters
to ensure against tampering or resetting.
(* - optional feature)
4.2 Specifications
Fluid Types:
Steam, Gas, Liquid.
Flow Accuracy (Including Linearity):
±1% of AR.
Repeatability:
±0.25% of full scale.
Ambient Temperature:
-12 °C to 65 °C (-15 °F to 149 °F).
Fluid Temperature:
-20 °C to 232 °C std./to 260 °C opt.
(-3 °F to 450 °F std./to 500 °F opt).
Fluid Temperature Measurement Range*:
-20 to 260C (-4 to 500 °F).
Temperature Accuracy (Including Linearity)*:
+/- 0.5C
Fluid Pressure Measurement Range*:
can be ordered for following options: 0 - 100 PSIA
0 - 200 PSIA
0 - 300 PSIA
0 - 500 PSIA
0 - 750 PSIA
0 - 1000 PSIA
Pressure Accuracy (Including linearity)*
: +/- 0.5% of full scale.
Fluid Proof Pressure*:
3 X F.S.
Fluid Burst Pressure*:
10 X F.S.
Flow Response Time:
Adjustable based on Noise Redaction Filter (NRF) and
Damping settings (minimum 1000 ms).
Analog Output Signals:
Linear 4-20 mA, self-powered (sourcing type,
non-isolated), 600 ohms maximum loop resistance.
Optically Isolated Outputs:
UCE @ 40Vdc, ICE @ 150 mA (Voltage –
Isolation: 5000 Vrms).
Page 15

10
Optically Isolated Flow Pulse Output:
UCE @ 60Vdc, ICE @ 50 mA (Voltage –
Isolation: 5000 Vrms).
Flow Meter Input Power:
15 to 30 Vdc, 100 mV maximum peak to peak
output noise. Power consumption: +15Vdc (150 mA maximum); +24Vdc (100
mA maximum); Circuit board have built-in polarity reversal protection, 300mA
resettable fuse provide power input protection. 115 or 230 Vac transformer
(optional).
Communication Interface:
RS-232 standard (RS-485 optional).
Communications Parameters (RS-232/RS-485):
Baud rate: ...................... 9600 baud
Stop bit: ...................... 1
Data bits: ...................... 8
Parity: ...................... None
Flow Control: ...................... None
Display:
Local 2x16 characters LCD. In the process mode can be set to display
statically or dynamically (with preset interval time) up to 13 different combinations of the process and diagnostic parameters.
Key Pad:
4 push button key pad.
CE Compliance: EMC Compliance with 89/336/EEC as amended.
Emission Standard: EN 55011:1991, Group 1, Class A
Immunity Standard: EN 55082-1:1992
(* - optional feature)
4.3 Handling and Storage
The smart transmitter has been tested and programmed at the factory. When
the transmitter is received, it should be inspected for damage due to mishandling
during shipment. If damage is evident, report it to the carrier immediately
and have them present when the carton is opened. The carrier is responsible for
any damage during shipment. If you have any problems or questions, consult
the factory or your local representative.
After receiving the unit, handle with care to avoid any unnecessary damage. If
the unit is not scheduled to be installed immediately after delivery, the following
steps should be observed:
Page 16

A) After inspection, the transmitter should be repacked into its original
packing.
B) Select a clean, dry place to store the meter.
C) Avoid areas of extreme temperatures. The unit should be stored in an area
that falls between -15 °F and +149 °F.
4.4 Mounting
The transmitter enclosure for remote option has two mounting feet for easy wall
mounting. The enclosure should be located within 100 feet from the pipeline
sensor, and ideally should be at eye level for easy viewing and access to the keypad for programming.
High-Temperature Installations:
Install the meter body so the electronics are positioned to the side of or below
the pipe. Insulation may be required around the pipe to maintain a temperature
below 149 °F (65 °C).
4.5. Wiring Connections
The transmitter module fits snugly within the enclosure, but will slide out by
hand without the necessity of a tool for removal.
11
CAUTION: Make proper grounding connections before switching on
power. Grounding the flow meter and transmitter modules is one of
the most important procedures of Vortex installation. Proper
grounding ensures correct and accurate flow measurement.
Use dedicated Grounding Clamp on the meter and transmitter body
(see pages 105-107) to make the proper connection to building
protective earth.
WARNING:
Some of the IC devices used in the transmitter are static sensitive and
may be damaged by improper handling. When adjusting or servicing
the transmitter, use of a grounded wrist strap is recommended to
prevent inadvertent damage to the integral solid state circuitry.
Page 17

12
CAUTION: Do not apply power voltage above 30Vdc. Doing so will
cause Vortex meter damage or faulty operation.
Make sure power is OFF when connecting or disconnecting any cables
in the system.
The TB1 – TB4 terminals accept 14 to 24 gauge wires, but 18 gauge shielded
wire (Belden 8760) or 20 gauge shielded wire (Belden 9154) is recommended.
When making wiring connections, cable glands should be fitted and sealed to
prevent moisture entering the enclosure.
4.5.1 Power Supply Connections
The power supply requirements for Vortex flow meter are: 15 to 30 Vdc 100 mV
maximum peak to peak output noise, (unipolar power supply)
Terminal TB1, Pin 1 --------------- DC Power (+)
Terminal TB1, Pin 2 --------------- DC Power (-)
Terminal TB1, Pin 3 --------------- GND, building protective earth
(connect to dedicated GND clamp
inside of the enclosure).
The (+) and (-) power inputs are each protected by a 300mA M (medium timelag) resettable fuse. If a shorting condition or polarity reversal occurs, the fuse
will cut power to the flow transducer circuit. Disconnect the power to the unit,
remove the faulty condition, and reconnect the power. The fuse will reset once
the faulty condition has been removed.
NOTE: For remote transmitter option use shielded twisted pair cable in
order to reduce EMI on sensors signals. Use 24 AWG or larger wire and
do not exceed 100 feet (30 meters). Use supplied cable termination kit
to properly terminate the transmitter end of the signal cable.
The termination kit includes:
1. Molex 3 position Connector Housing (P/N: 50-57-9403) 1 ea.
2. Molex Female Connector Terminals (P/N: 16-02-1114) 3 ea.
Make sure to connect terminal #4 on the meter side to pin #2
(central pin) on the Molex connector (see APPENDIX D on page 104
for more details)
Page 18

13
This linear output signal by default represents 0-100% of the selected process
variable full scale range. User may adjust 4mA and 20 mA settings individually
for each output if different range of the process variable is required (see
Paragraph 5.3.12.4)
Terminal TB3, Pin 1 --------------- (+) Plus 4-20mA Analog Output#1
Terminal TB3, Pin 2 --------------- (-) Minus 4-20mA Analog Output#1
Terminal TB3, Pin 3 --------------- (+) Plus 4-20mA Analog Output#2
Terminal TB3, Pin 4 --------------- (-) Minus 4-20mA Analog Output#2
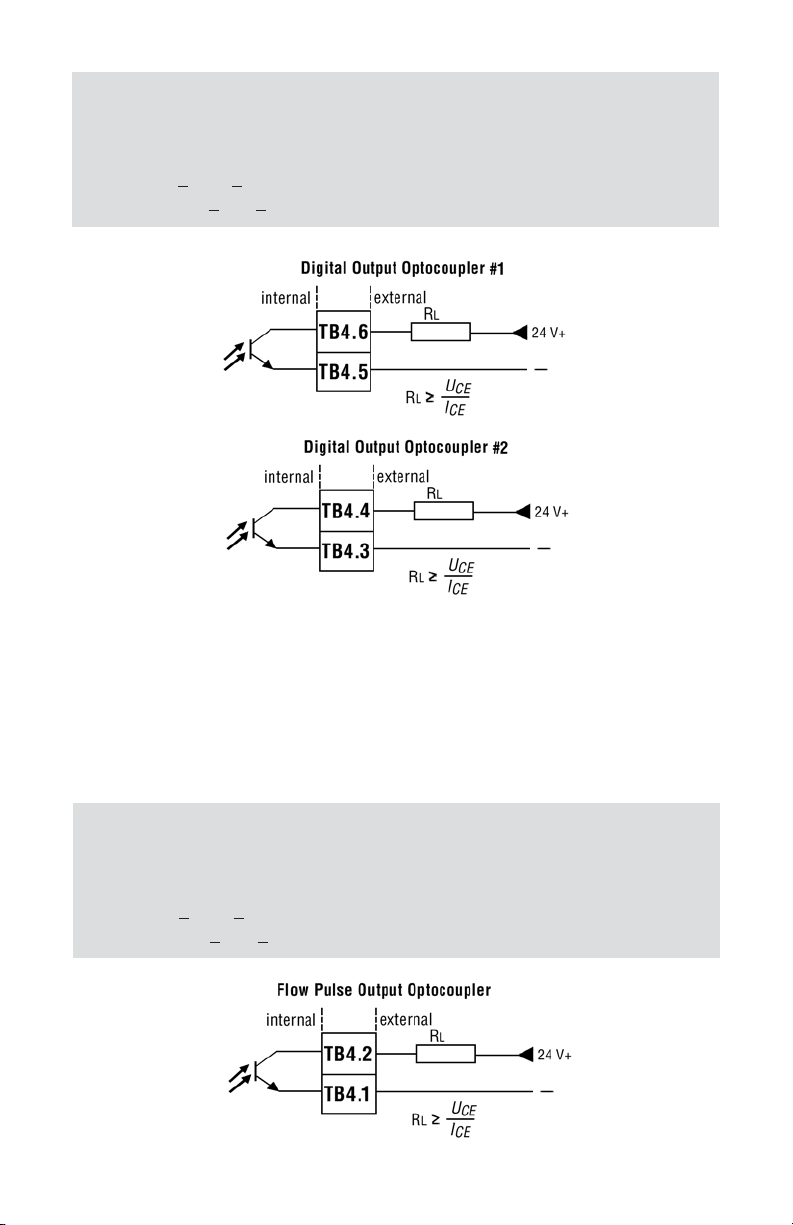
4.5.3 Programmable optically isolated Output
Signals Connections
Optocoupler #1 - Terminal TB4 (pins 6 and 5):
Terminal TB4 Pin 6 --------------- Plus (+) (passive)
Terminal TB4 Pin 5 --------------- Minus (-) (passive)
Optocoupler #2 - Terminal TB4 (pins 4 and 3):
Terminal TB4 Pin 4 --------------- Plus (+) (passive)
Terminal TB4 Pin 3 --------------- Minus (-) (passive)
WARNING: The 4-20 mA current loop output is self-powered (sourcing
type, non-isolated). Do NOT connect an external voltage source to the
output signals.
4.5.2 Analog 4-20 mA Output Signals Connections
Vortex Flow Meters are equipped with two calibrated 4-20 mA output signals
(which can be assigned to any of four process variables: Volumetric Flow, Mass
Flow, Temperature*, Pressure*).
CAUTION: When connecting the load to the output terminals, do not
exceed the rated values shown in the specifications. Failure to do so
might cause damage to this device. Be sure to check if the wiring and
the polarity of the power supply is correct before turning the power ON.
Wiring error may cause damage or faulty operation.
Use of the Vortex flow meter in a manner other than that specified in this manual
or in writing from Aalborg, may impair the protection provided by the equipment.
Page 19
14
4.5.4 Programmable optically isolated Flow Pulse
Output Signal Connections
Terminal TB4 (pins 2 and 1):
Terminal TB4 Pin 2 --------------- Plus (+) (passive)
Terminal TB4 Pin 1 --------------- Plus (-) (passive)
WARNING: Optically isolated Flow Pulse output require application of
external DC voltage across terminals. Do not exceed maximum allowed
limits for voltage and current provided below:
2 V <
UCE < 60 V
0.2 mA < ICE < 50 mA
WARNING: Optically isolated outputs require application of external DC
voltage across terminals. Do not exceed maximum allowed limits for
voltage and current provided below:
2 V <
UCE < 40 V
0.2 mA <
ICE < 150 mA
Page 20

15
4.5.5 Communication Parameters and Connections
The digital interface operates via RS-232 (optional RS-485) and provides access
to applicable internal data including: flow, temperature*, pressure*, totalizers
and alarm settings, flow calibration settings, process fluid parameters and engineering units selection.
Communication Settings for RS-232/RS-485 communication interface:
Baud rate: ………………… 9600 baud
Stop bit: ……………………1
Data bits: …………………. 8
Parity: ………………… None
Flow Control: ………………… None
RS-232 communication interface connection:
Crossover connection has to be established:
Terminal TB2 Pin 1 (Tx-) ------------ RS-232 RX (pin 2 on the DB9 connector)
Terminal TB2 Pin 2 (Rx+) ------------ RS-232 TX (pin 3 on the DB9 connector)
Terminal TB2 Pin 3 ------------- RS-232 SIGNAL GND (pin 5 on the DB9
connector)
RS-485 communication interface connection:
The RS485 converter/adapter must be configured for: multidrop, 2 wire, half
duplex mode. The transmitter circuit must be enabled by TD or RTS (depending on
which is available on the converter/adapter). Settings for the receiver circuit
should follow the selection made for the transmitter circuit in order to eliminate
echo.
Terminal TB2 Pin 1 (Tx-) --------------- RS-485 T(-) or R(-)
Terminal TB2 Pin 2 (Rx+) --------------- RS-485 T(+) or R(+)
Terminal TB2 Pin 3 --------------- RS-485 GND (if available)
5. LCD KEYPAD OPERATION:
DATA ENTRY AND CONFIGURATION
5.1 Display Indications
Initially, after the power is first turned on, the Banner Screen is shown for 1 second, then flow meter model number is shown in the first line of the display and
the revisions for EEPROM table and firmware in the second line. Subsequently
the actual process information is displayed.
Page 21

16
Figure 5.1: Vortex meter first Banner Screen
Figure 5.2: Vortex meter second Banner Screen
Figure 5.3: Vortex meter initial PI Screen
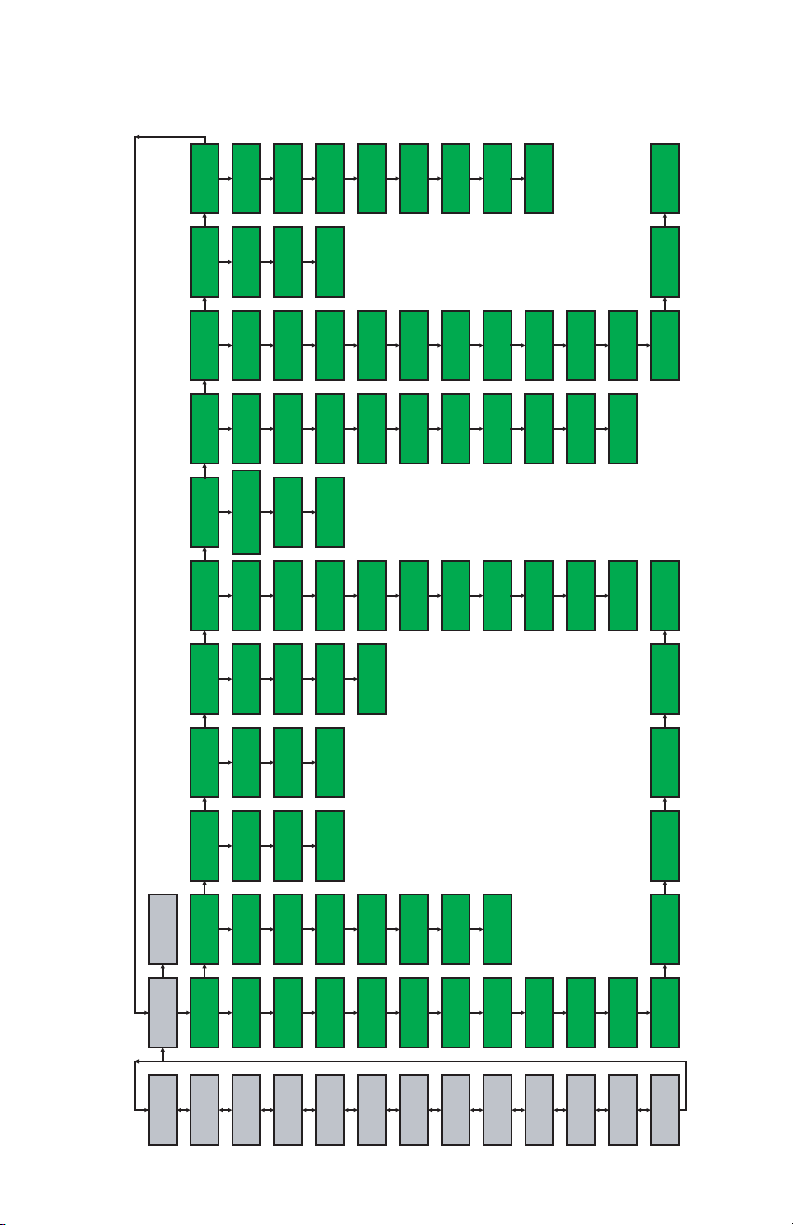
Based on flow meter configuration (with or without Temperature/Pressure
option), different parameters may be displayed in the Process Information (PI)
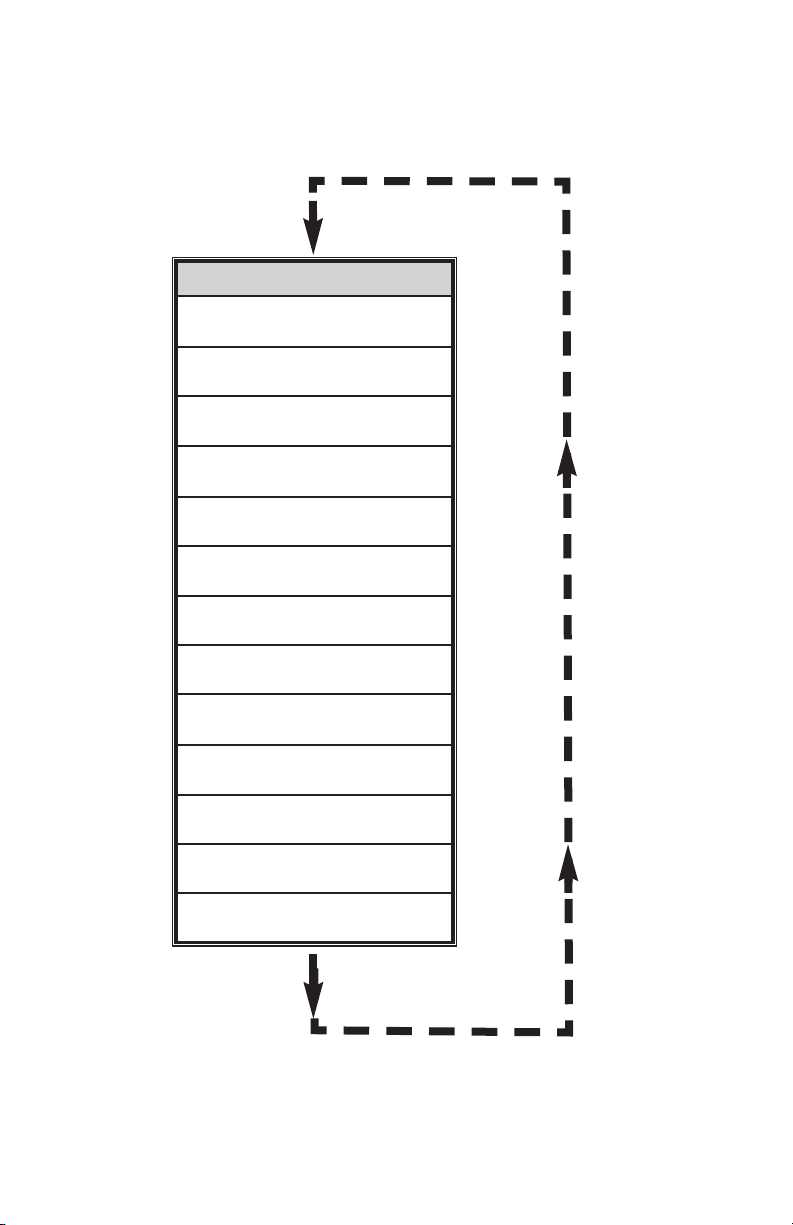
screen by pressing the Up or Dn pushbuttons.
Process Information screens can be configured to be static or dynamic (see
Paragraph 5.3.11 “Display Menu”). Using Screen Mask settings user can enable
(unmask) or disable (mask) up to 13 different process variable combinations (see
Figure 5.4). In the static mode pressing Up button, pages through the PI screens
in the forward direction, pressing Dn button, pages through the PI screens in the
reverse direction. When the last PI screen is reached, the firmware “wraps
around” and scrolls to the initial PI screen once again.
In the dynamic mode firmware initiates automatic screen sequencing with user
adjustable screen Cycle Time (see Paragraph 5.3.11.2 “Display Menu”). When the
last PI screen is reached, the firmware “wraps around” and scrolls to the initial PI
screen once again.
AALBORG VORTEX
SMART FLOW METER
VXW10L-44AB-L2D4
Fw: A001 Tbl: A001
325.3 litr/min
T1: 60639.3 litr
NOTE: Actual content of the LCD screen may vary depending on the
model.
Page 22

17
NOTE: Actual content of the LCD screen may vary depending on the
model.
NOTE: For devices without Temperature and Pressure measurement
hardware, the screens with T/P process info will display static data
entered during meter configuration procedure via Process Fluid menu
(see Paragraph 5.3.9).
Process Information Mode Screens
Page 23
18
Figure 5.4: Vortex meter Process Information Screens
Vol Flow
Total#1
Vol Flow
Total#2
Mass Flow
Total#1
Mass Flow
Total#2
Total #1
Total #2
Vol Flow
Temp Press
Mass Flow
Temp Press
Vol Flow
Mass Flow
Fa Stat.
Ta Stat. Pa Stat.
Vol Flow
RMS1 RMS2
Mass Flow
Density
Flow Velocity
Date/Time
F:PC F:PWM
F: WD F:FFT
Page 24

19
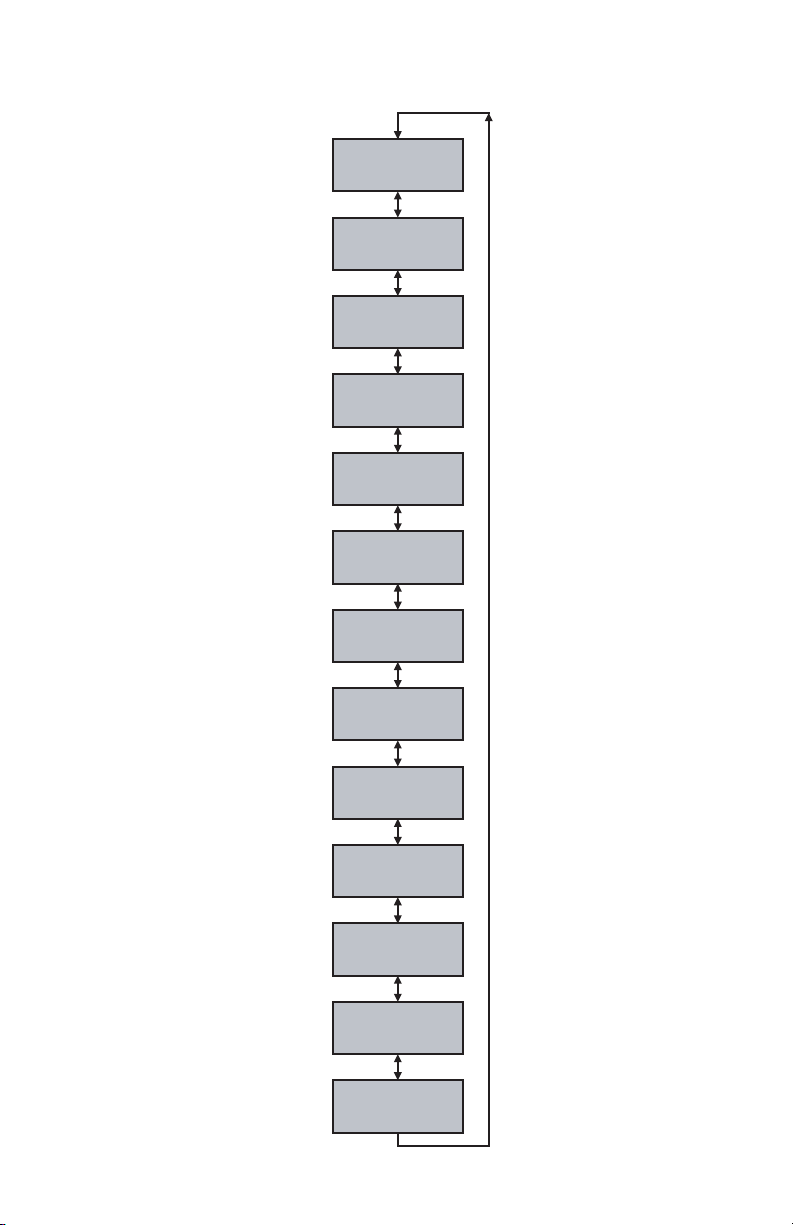
5.2 Menu Sequence
The listing below gives a general overview of the standard top-level display menu
sequence when running firmware version A001. The ESC pushbutton is used to
toggle between the process mode (PI screens) and the Setup menus.
The listing in Section 5.2 shows the standard display menu sequence and submenus using the UP button to move through the menu items. The first message
displayed the first time the ESC button is pressed after the meter is powered up is
“Prog. Protection ON”. Thereafter, pressing the ESC button while the flow meter
is in monitoring mode (PI screens) will display the parameter that was last exited.
Program Protection may be turned “off” by pressing the ENT pushbutton when
the Program Protection menu is displayed. The firmware will prompt with
“Change Prog Prot”. Pressing UP or DN button will toggle current protection status. If password is set to any value more than zero, the firmware will prompt with
“Enter Prot Code”. User has to enter up to 3 digits program protection code, in
order to be able to access password protected menus. Once correct password is
entered, program protection is turned off until unit is powered up again.
When the last menu item is reached, the firmware “wraps around” and scrolls to
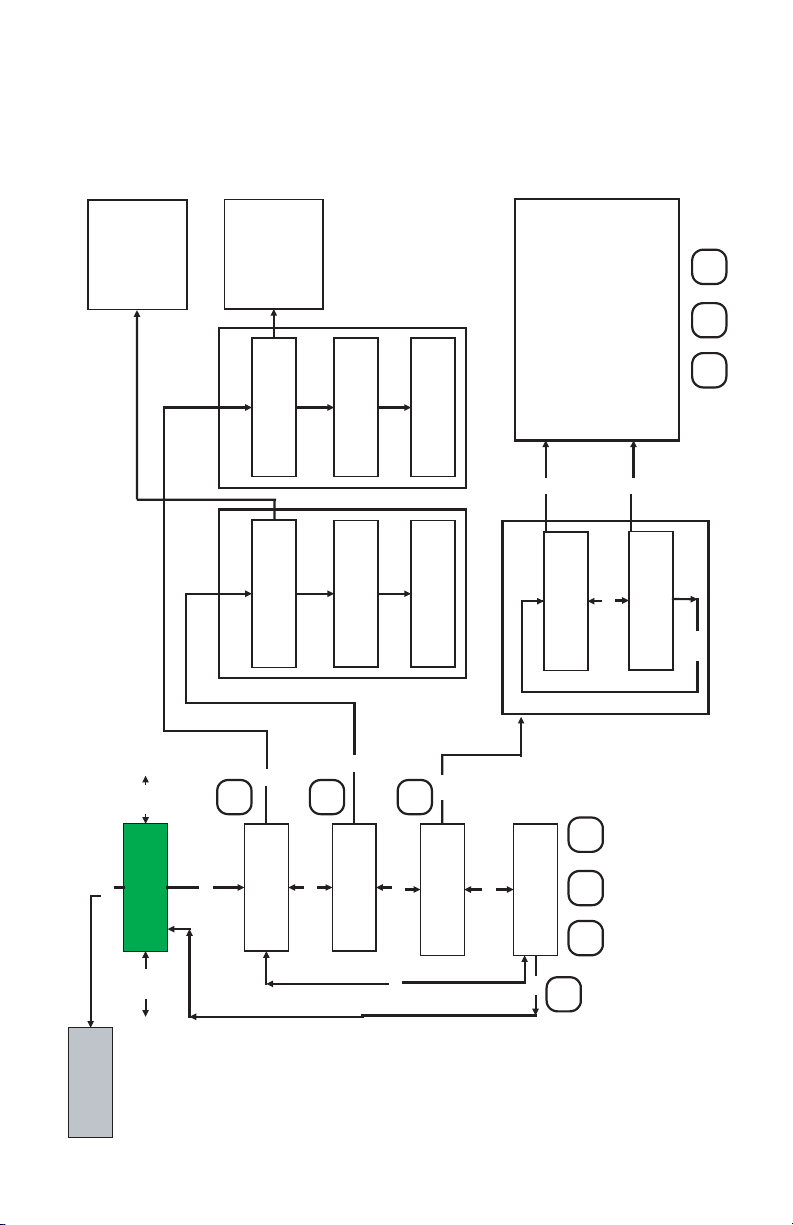
the first item on the menu once again (see Figure 5.5). The menu items in the first
column are upper-level configuration mode functions. Submenu selections are
shown on the Figure 5.6). The allowable selections of sub-menu items which are
selected by tabular means are shown in detail in Section 5.3.
Page 25
20
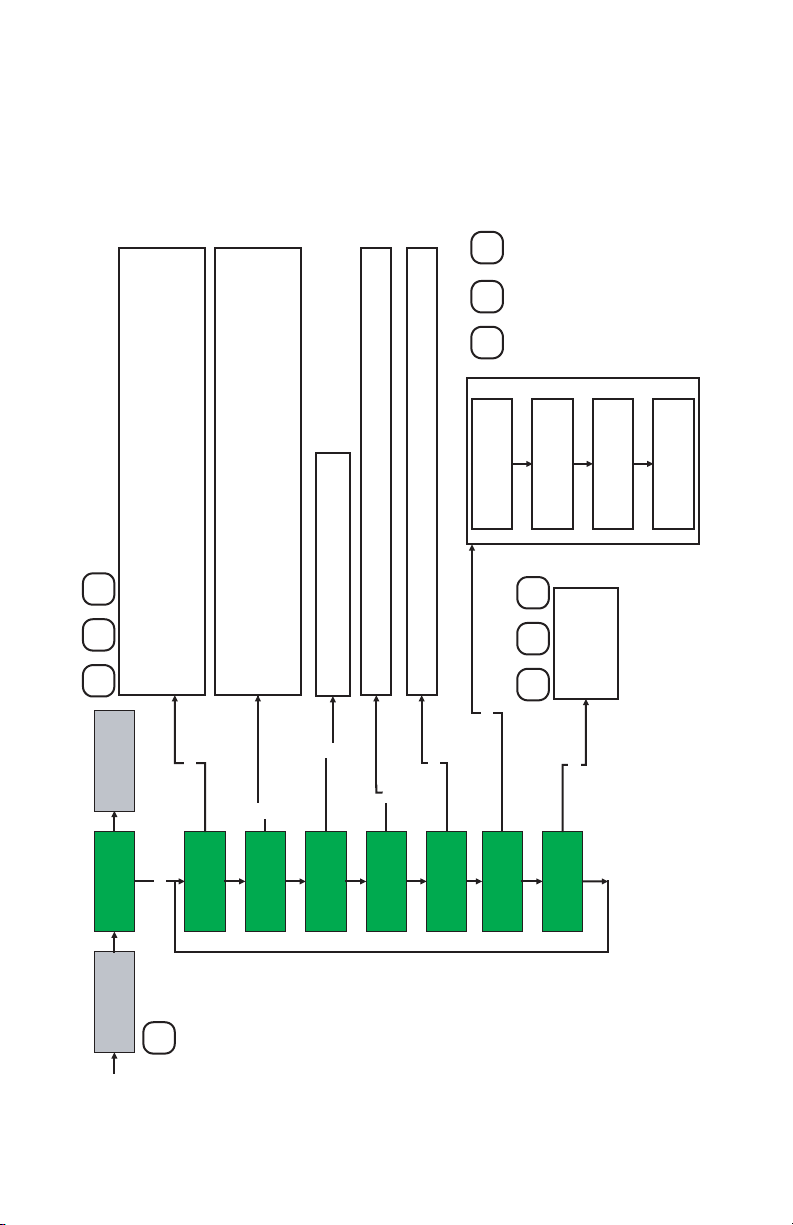
Top Level 1 Setup Menus
Prog. Protection
on/off
Prog. Prot. Code
old/new
Submenu L1
Flow Meter Info
Submenu
Measuring Units
Submenu L1
Alarm Menu
Submenu L1
Totalizer Menu
Submenu L1
Output Menu
Submenu L1
Calibration Menu
Submenu L1
Date/Time Adjust
Submenu L1
Fluid Menu
Submenu L1
Diagnostic Menu
Submenu L1
Display Menu
Submenu L1
Data Log Menu
Figure 5.5 Upper level 1 Setup Menu structure.
Page 26
21
Figure 5.6 Setup Menu structure
SETUP MENUS
Loop
Disabled
Sub menu L1
Data Log Menu
Data Log Mode:
Static
Sub menu L1
Display Menu
Display Mode:
3600
DataLog Config:
Log #of Sampls:
2 sec.
Sub menu
Screen Mask
Screen Time:
60 sec.
Vol Flo w
Log Interval:
Proces Vari able:
Unconditional
Flow Alarm Hi
Start Conditions:
DLI:2503 Ov:0
Stop Conditions:
Data Log Status
37.5 C
CPU Temp:
DAC Output:
#1:538 #2:1521
Sub menu L1
Sub menu L2
Sub menu L2
Diagnostic Menu
Fluid Menu
Flowing Fluid
Sub menu L1
Sub menu L2
Sub menu L1
Date/TimeAdjust
05/25/2010 09:40
Current Date/Time
Sub menu L1
Sub menu L2
CalibrationMenu
PWM DSPMenu
Setup Mode Screens
Output Menu
Sub menu L1
Sub menu L2
4-20mA Output1
Totalizer #1
Sub menu L1
Sub menu L2
Totalizer Menu
Flow Alarm
Alarm Menu
Sub menu L1
Sub menu L2
Menu
Password
litr/min
Sub menu L1
Vol Flo w Units
Measuring Units
Raw Pulses Cnt
API 2540.
Sub menu L2
Sub menu L2
Goyal-Dorais.
16:24:11
Set Date:
Set Time:
05/25/2010
0.750 inch
Meter Size
Sub menu L2
FFT DSPMenu
Sub menu L2
Sub menu L2
Optical Outputs
4-20mA Output2
Totalizer #2
Pulse Output
Sub menu L2
Sub menu L2
Sub menu L2
Sub menu L2
Temper. Alarm
Pressure Alarm
deg C
kg/min
Temper. Units
Mass Flow Units
560 T:2000 ms
Events Log File
Sys. Events Reg
280.2 280.0 Hz
280.2 280.0 Hz
PulseFrequency
PWMFrequency:
Other Gases.
Sub menu L2
Sub menu L2
Nat Gas AGA8
1001.170
Meter Factor
2800 Litr/min
Meter FS Range
11
RS-485 Address
PSI
g/cm^3
Density Units
Pressure Units
FFT Output:
FFT Aver age:
Sensors RMS:
280.6 280.1 Hz
280.5Hz A: 325
AWDFrequency:
21.0 C
STD Temp:
Sub menu L2
Cust Flow. Cond
5.0 %FS
50.00 Hz
Low Freq Cutoff
Low Flow Cutoff
Actual
Sub menu L2
UD Flow Units
Flow Units Cond
S1:425 S2:412
280.2Hz D:2223
21.0 C
14.70 PSIA
Normal Temp:
STD Pressure:
2.158
1009.00 Hz
Vortex Coeff.
Hi Freq Cutoff
T/P ADC Out:
T:1245 P:0547
S1:127 S2: 120
Sensor Attenuat
14.70 PSIA
Normal P ress:
25.6 Hours
Not Assigned
User Tag Name:
Calib. Pilot Time
08/21/2011
Calib. Date Due
08/21/2010
Calibration Date
Model Number:
VXW-10L-4S4A
248561-1
Serial Number:
A002
Status
Password
Scr eens
Proc ess M ode
Total#1
Vol Flo w
1000.0 L/min
Sub menu L1
Full Scal e Flow
Flow Meter Info
Total#2
Total#1
Vol Flo w
Mass Flow
Water
0.750 inch
Meter Size
Floing Fluid:
Total#2
Total #1
Total #2
Mass Flow
Inst alled
Comm. Interface
RS-485 ADD:11
Vol Flo w
Temp Press
4-20mA Output1
Vol Flo w
Mass Flow
Mass Flow
Temp Press
Vol Flo w
T/P Sensors
Disabled
Temperature
Optical Out #1
4-20mA Output2
Fa Stat.
Vol Flo w
RMS1 RMS2
Ta Stat. Pa Stat.
A001
Disabled
Optical Out #2
Density
Mass Flow
Firmware Ver:
EEPROM Ver:
Date/Time
F: WD F:FFT
Flow Velocity
F:PC F:PWM
Page 27

22
5.3 Parameter Entry
There are two methods of data entry: • Direct numerical number entry.
• Tabular Input from a table menu.
If menu with direct numerical entry is selected use Up button to increment digit
value from 0-9. Use Dn button to move cursor to another digit position. When
desired value is entered use ENT button to accept (save in the EEPROM) new
value.
If menu with tabular entry is selected, the available menu options can be set with
the Up and Dn buttons and are accepted by pressing ENT button.
5.3.1 Submenu Program protection
After power has been turned on, programming parameters may only be changed
by turning program protection “OFF”. There are two ways to turn off the program protection:
1. If program protection code (PP-code) is set to “0” (factory default), the
program protection is turned off by pressing ENTER key.
2. If a PP-code (1 to 255) other than “0” has been entered, this code must be
entered in order to turn the program protection “OFF”.
The PP-code can be changed after the program protection has been turned off.
In order to protect device configuration parameters when changing the PP-code
the old PP-code must be entered after ENTER has been pressed.
NOTE: During data entry the input values are checked for
acceptability. If data is not acceptable, it is rejected and a message
is generated indicating that the new data has not been accepted.
Prog. Protection code
Old PP-code ?
0
Page 28

23
Press ENTER key after entry of old PP-code.
Now enter the new PP-code (0-255) and press ENTER key. The new PP-code is
now valid to turn off the program protection. If the PP-code is forgotten, it can
be restored only via digital communication interface.
5.3.2 Submenu Flow Meter Info
This submenu contains information about the meter main configuration parameters. These items are informational only, not password protected and may not be
changed (read only).
New PP-code ?
0
Page 29
24
Figure 5.7 Submenu L1 Measuring Units structure.
5.3.3 Submenu Measuring Units
Ent
Dn Up
Cursor
1.000
Numerical Entry
UD Vol U. Factor
Tabular Entry
Ent
Dn Up
Alarm Menu
Sub menu L1
Sub menu L1
Measuring Units
bbl/sec, bbl/min, bbl/hr, bbl/day, Vol User
f^3/sec, f^3/min, f^3/hr, f^3/day, gal/sec, gal/min, gal/hr, gal/day,
Igal/sec, Igal/min, Igal/hr, Igal/day, MilL/sec, MilL/min, MilL/hr, MilL/day,
%FS, litr/sec, litr/min, litr/hr, litr/day, m^3/sec, m^3/min, m^3/hr, m^3/day,
Ent
Ent
litr/min
Vol Flow Units
Lton/day, Mass User
g/cm^3, kg/m^3, g/litr, kg/litr, lb/ft^3, lb/gal, lb/in^3
psi, bar, mbar, inHg, mmHg, kPa, MPa, atm, gcm2, kgc2, torr
Ston/sec, Ston/min, Ston/hr, Ston/day, Lton/sec, Lton/min, Lton/hr,
lb/sec, lb/min, lb/hr, lb/day, Mton/sec, Mton/min, Mton/hr, Mton/day,
gram/sec, gram/min, gram/hr, gram/day, kg/sec, kg/min, kg/hr, kg/day,
Ent
Mass Flow Units
deg F, deg C, Kelvin, Rankine
Ent
kg/min
deg C
Temper. Units
Ent
Ent
PSI
Pressure Units
g/cm^3
Density Units
UD VU Time Base
Ent
Tabular Entry
Dn Up
Ent
Sub menu L2
UD Flow Units
Numerical Entry
Tabular Entry
60 Sec
UD Mass U Factor
Actual
Normal
Standard
Ent
Actual
Flow Units Cond
Tabular Entry
1.000
60 Sec
UD MU Time Base
Sub menu L1
Flow Meter Info
Esc
to L1 Menu
Press Esc to return
Page 30

NOTE: Program the Measuring Units first because later menus may be
based on the units selected.
25
Use the Measuring Units Menu to configure the flow meter with the desired units
of measurement. These are global settings and determine what appears on all
process information screens and data log records. Units should be selected to
meet your particular metering needs.
The instantaneous flow rate may be simultaneously displayed in Volumetric and
Mass engineering units. In addition to conventional flow units user defined flow
engineering units may be configured for Volumetric and Mass flow units. Before
using Volumetric User defined flow unit make sure proper conversion factor of the
new unit with respect to one liter is set (the default entry is 1.00 Liter). Before
using Mass User defined flow unit make sure proper conversion factor of the new
unit with respect to one gram is set (the default entry is 1.00 gram) Also proper
time base values for both User Defined Units have to be set. The following selections are available: 1 second, 60 seconds (1 minute), 3600 seconds (1 Hour),
86400 seconds (1 Day). The default entry is 60 seconds.
The Volumetric flow rate for Gases may be shown with following units conditions:
Standard, Normal, and Actual. The temperature and pressure for Standard and
Normal conditions can be programmed in the Flowing Fluid menu (see Paragraph
5.3.9). By default Standard conditions are: 70 °F and 14.7 PSIA, Normal conditions are 0 °C and 101.3 KPa.
For flow meters with T/P hardware installed the actual process temperature and
pressure derived from corresponding sensors. For flow meters without T/P hardware the actual process temperature and pressure should be preset in the Flowing
Fluid menu (see Paragraph 5.3.9).
NOTE: Your flow meter is pre-programmed at the factory for your
application’s process fluid and T/P conditions and does not require any
reprogramming unless your process fluid or T/P conditions are
changed.
NOTE: If Gas is selected as flowing fluid, when Standard Volumetric
units are selected the prefix S will precede engineering units name on
the PI screens (for example: Slitr/min). When Normal Volumetric units
are selected the prefix N will precede engineering units name on the PI
screens (for example: Nlitr/min). For Actual Volumetric units there will
be no prefix in front of engineering unit name (for example: litr/min).
Flow Units Conditions settings only applicable for Volumetric Flow
units. For Liquids the Flow Units conditions are always Actual.
Page 31

5.3.4 Submenu L1 Alarm Menu
5.3.4.1 Submenu L2 Flow Alarm
Vortex flow meter provides the user with a flexible alarm/warning system that
monitors the Fluid Flow for conditions that fall outside configurable limits as well
as visual feedback for the user via the LCD or via an optically isolated outputs.
The flow alarm has several attributes which may be configured by the user via
LCD/Keypad or digital communication interface. These attributes control the conditions which cause the alarm to occur and to specify actions to be taken when the
flow rate is outside the specified conditions. Flow Alarm can be assigned to
Volumetric or Mass Flow reading.
Flow Alarm conditions become true when the current flow reading is equal or higher/lower than corresponding values of high and low flow alarm levels. Alarm action
can be assigned with preset delay interval (0-3600 seconds) to activate the optically isolated output (separate for High and Low alarm). Latch Mode control feature allows each optical output to be latched on or follow the corresponding alarm
status.
Following settings are available for Flow Alarm (see Figure 5.8):
a) Flow Alarm Mode Tabular entry
This function determines whether Flow Alarm is Enabled or Disabled.
The following selections are available: Enabled or Disabled. The default
entry is Disabled. Alarm Mode selections can be set with the Up and Dn
buttons and are accepted by pressing ENT button.
26
Page 32

27
Figure 5.8 Submenu L1 Alarm Menu structure.
Numerical
Tabular
Numerical
Tabular
Numerical
Tabular
Flow Alarm Mode
Esc
Disabled
Mass Flow
2.03 gram/sec
18.06 gram/sec
High Flow Alarm
Flow Alarm Delay
Ent
Ent
Sub Menu
Flow Alarm Cond.
Low Flow Alarm
Top Level 1 Setup
Ent
Up/Dn
Flow Alarm
Sub menu L2
Temper. Alarm
Up/Dn
Sub menu L1
Ent
Enter
Alarm Menu
Up/Dn Up/Dn
Sub menu L2
Disabled
1 second
Flow Alarm Latch
Numerical
Numerical
199.5 deg. C
90.0 PSI
Numerical
Tabular
Disabled
1 second
Temp Alarm Latch
Temp Alarm Delay
Disabled
1 second
Pres. Alarm Latch
Pres. Alarm Delay
Tabular
Disabled
10.0 deg. C
Low Temp Alarm
10.0 PSI
Low Pres. Alarm
High Temp Alarm
High Pres. Alarm
Temp Alarm Mode
Disabled
Pres Alarm Mode
Enter
Ent
Up/Dn
Sub menu L2
Pressure Alarm
Esc
Esc
Screen
Process
Sub Menu
Top Level 1 Setup
Page 33

28
b) Flow Alarm Conditions Tabular entry
Flow Alarm can be assigned to Volumetric or Mass Flow reading.
c) Low Flow Alarm Numerical entry
The limit of required Low Flow Alarm value can be entered in increments
of 0.1% from 0 - 100%F.S.
If a Low Alarm occurs, and one of the two optical outputs is assigned to the Low
Flow Alarm Event (see paragraph 5.3.5.2) the optically isolated output will be
activated when the flow is less than the Low Flow Alarm value.
The Low Flow Alarm condition is also indicated on the corresponding Process
Information Screen by displaying L character.
d) High Flow Alarm Numerical entry
The limit of required High Flow Alarm value can be entered in currently
active Volumetric or Mass Flow units.
If a High Alarm occurs, and one of the two optical outputs is assigned to the High
Flow Alarm Event (see Section 5.3.6.2) the optically isolated output will be activated when the flow is more than the High Flow Alarm value. The High Flow Alarm
condition is also indicated on the corresponding Process Information Screen by
displaying H character.
e) Flow Alarm Action Delay Numerical entry
The Flow Alarm Action Delay is a time in seconds that the Flow rate value
must remain above the high limit or below the low limit before an alarm
condition is indicated. Valid settings are in the range of 0 to 3600 seconds.
f) Flow Alarm Action Latch Tabular entry
The Flow Alarm Action Latch settings controls Latch feature when optically
isolated outputs are assigned to Flow Alarm event. Following settings are
available: Disable or Enabled.
By default, flow alarm is non-latching. That means the alarm is indicated
only while the monitored flow value exceeds the specified set conditions. If
NOTE: If Flow Alarm Conditions were changed, make sure to adjust
Low and High Flow Alarm settings in corresponding flow Engineering
Units.
NOTE: Note: The value of the Low Flow Alarm must be less than the
value of the High Flow Alarm.
NOTE: The value of the High Flow Alarm must be more than the value
of the Low Flow Alarm.
Page 34

29
optically isolated output is assigned to the Flow Alarm event, in some cases,
the Flow Alarm Latch feature may be desirable.
5.3.4.2 Submenu L2 Temperature Alarm (*optional)
Vortex flow meter with T/P option provides the user with a flexible alarm/warning
system that monitors the Fluid Temperature for conditions that fall outside configurable limits as well as visual feedback for the user via the LCD or via an optically
isolated outputs.
The temperature alarm has several attributes which may be configured by the user
via LCD/Keypad or digital communication interface. These attributes control the
conditions which cause the alarm to occur and to specify actions to be taken when
the temperature value is outside the specified conditions.
Temperature Alarm conditions become true when the current temperature reading
is equal or higher/lower than corresponding values of high and low temperature
alarm levels. Alarm action can be assigned with preset delay interval (0-3600 seconds) to activate the optically isolated output (separate for High and Low alarm).
Latch Mode control feature allows each optical output to be latched on or follow
the corresponding alarm status.
Following settings are available for Temperature Alarm (see Figure 5.8):
a) Temperature Alarm Mode Tabular entry
This function determines whether Temperature Alarm is Enabled or
Disabled. The following selections are available: Enabled or Disabled. The
default entry is Disabled. Alarm Mode selections can be set with the Up
and Dn buttons and are accepted by pressing ENT button.
b) Low Temperature Alarm Numerical entry
The limit of required Low Temperature Alarm value can be entered in
currently active Temperature Engineering units.
If a Low Temperature Alarm occurs, and one of the two optical outputs is assigned
to the Low Alarm Event (see Section 5.3.6.2) the optically isolated output
will be activated when the process temperature is less than the Low Temperature
Alarm value. The Low Temperature Alarm condition is also indicated on the corresponding Process Information Screen by displaying L character.
NOTE: The value of the Low Temperature Alarm must be less than
the value of the High Temperature Alarm.
Page 35

c) High Temperature Alarm Numerical entry
The limit of required High Temperature Alarm value can be entered in currently
active Temperature Engineering units.
If a High Alarm occurs, and one of the two optical outputs is assigned to the High
Alarm Event (see Section 5.3.6.2) the optically isolated output will be activated
when the process Temperature is more than the High Temperature Alarm value.
The Temperature Alarm condition is also indicated on the corresponding Process
Information Screen by displaying H character.
d) Temperature Alarm Action Delay Numerical entry
The Temperature Alarm Action Delay is a time in seconds that the Temperature
reading value must remain above the high limit or below the low limit before an
alarm condition is indicated. Valid settings are in the range of 0 to 3600 seconds.
e) Temperature Alarm Action Latch Tabular entry
The Temperature Alarm Action Latch settings controls Latch feature when
optically isolated outputs are assigned to Temperature Alarm event. Following
settings are available: Disable or Enabled.
By default, Temperature alarm is non-latching. That means the alarm is indicated
only while the monitored Temperature value exceeds the specified set conditions.
If optically isolated output is assigned to the Temperature Alarm event, in some
cases, the Temperature Alarm Latch feature may be desirable.
5.3.4.3 Submenu L2 Pressure Alarm (*optional)
Vortex flow meter with T/P option provides the user with a flexible alarm/warning
system that monitors the Fluid Pressure for conditions that fall outside configurable limits as well as visual feedback for the user via the LCD or via an optically
isolated outputs.
The Pressure alarm has several attributes which may be configured by the user via
LCD/Keypad or digital communication interface. These attributes control the conditions which cause the alarm to occur and to specify actions to be taken when the
pressure value is outside the specified conditions. Pressure Alarm conditions
become true when the current pressure reading is equal or higher/lower than
30
NOTE: The value of the High Temperature Alarm must be more than the
value of the Low Temperature Alarm.
Page 36

31
corresponding values of high and low pressure alarm levels. Alarm action can be
assigned with preset delay interval (0-3600seconds) to activate the optically isolated output (separate for High and Low alarm). Latch Mode control feature allows
each optical output to be latched on or follow the corresponding alarm status.
Following settings are available for Pressure Alarm (see Figure 5.8):
a) Pressure Alarm Mode Tabular entry
This function determines whether Pressure Alarm is Enabled or Disabled.
The following selections are available: Enabled or Disabled. The default
entry is Disabled. Alarm Mode selections can be set with the Up and Dn
buttons and are accepted by pressing ENT button.
b) Low Pressure Alarm Numerical entry
The limit of required Low Pressure Alarm value can be entered in
currently active Pressure Engineering units.
If a Low Pressure Alarm occurs, and one of the two optical outputs is
assigned to the Low Alarm Event (see paragraph 5.3.5.2) the optically
isolated output will be activated when the process pressure is less than
the Low Pressure Alarm value. The Low Pressure Alarm condition is also
indicated on the corresponding Process Information Screen by displaying
L character.
c) High Pressure Alarm Numerical entry
The limit of required High Pressure Alarm value can be entered in
currently active Pressure Engineering units.
If a High Alarm occurs, and one of the two optical outputs is assigned to
the High Alarm Event (see paragraph 5.3.5.2) the optically isolated output
will be activated when the process Pressure is more than the High
Pressure Alarm value. The Pressure Alarm condition is also indicated on
the corresponding Process Information Screen by displaying H character.
d) Pressure Alarm Action Delay Numerical entry
The Pressure Alarm Action Delay is a time in seconds that the Pressure
reading value must remain above the high limit or below the low limit
NOTE: The value of the Low Pressure Alarm must be less than the
value of the High Pressure Alarm.
NOTE: The value of the High Pressure Alarm must be more than the
value of the Low Pressure Alarm.
Page 37

32
5.3.5 Submenu L1 Totalizer Menu
5.3.5.1 Submenu L2 Totalizer#1 and Totalizer#2
Menus
Vortex flow meter provides the user with two independent Programmable Flow
Totalizers. Each Totalizer can be configured for Volumetric or Mass flow.
The total volume of the flowing fluid is calculated by integrating the actual instantaneous fluid flow rate with respect to time. The Totalizers value are stored in the
Battery Backed RAM and saved every 1 second. In case of power interruption the
last saved Totalizers values will be loaded on the next power on cycle, so Totalizers
reading will not be lost. The LCD/keypad and digital communication interface commands are provided to:
- Enable/Disable totalizing the flow
- configure totalizer to Volumetric or Mass flow process variable
- start the totalizer at a preset flow rate (in current Vol. or Mass flow units)
- assign action at a preset total volume (Event Volume)
- reset the totalizer to ZERO
NOTE: Before enabling the Totalizer, ensure that all totalizer settings are
configured properly. Totalizer Start values have to be entered in
currently active Volumetric or Mass flow engineering unit. The Totalizer
will not totalize until the process flow rate becomes equal to or more
than the Totalizer Start value. Totalizer Event values must be entered in
currently active volume or mass based engineering units. If the
Totalizer Event at preset total volume feature is not required, then set
Totalizer Event value to zero (default settings).
before an alarm condition is indicated. Valid settings are in the range of
0 to 3600 seconds.
e) Pressure Alarm Action Latch Tabular entry
The Pressure Alarm Action Latch settings controls Latch feature when
optically isolated outputs are assigned to Pressure Alarm event. Following
settings are available: Disable or Enabled.
By default, Pressure alarm is non-latching. That means the alarm is
indicated only while the monitored Pressure value exceeds the specified
set conditions. If optically isolated output is assigned to the Pressure
Alarm event, in some cases, the Pressure Alarm Latch feature may be
desirable.
Page 38

33
Figure 5.9 Submenu L1 Totalizer Menu structure.
Numerical
Tabular
Tabular
Numerical
Tabular
Disabled
Volumetric Flow
Totalizer#1 Mode
Tot#1 Flow Cond.
Disabled
Totalizer#2 Mode
Tot#2 Flow Cond.
Setup
Sub Menu
Top Lev el 1
Esc
Enter
Sub menu L1
Totalizer Menu
Up/Dn Up/Dn
Tot#1 Flow Start
Mass Flow
Tot#2 Flow Start
Ent
Totalizer #1
Sub menu L2
0 litr
100. 0 litr/m in
Tot#1 Event Vol.
0.0 gram
2.15 gram/sec
Tot#2 Event Vol.
Ent
Up/Dn
Totalizer #2
Sub menu L2
Up/Dn
Value?
Reset Total #1
Esc
Enabled
Disabled
Value?
Tabular Entry
Volum. Flow
Tabular Entry
Numerical Entry
Numerical Entry
Ent
Ent
Mass. Flow
Dn Up
Dn Up
Reset Total #2
Enter
Pulse Mode:
Ent
Enter
Esc
Up/Dn
Pulse Output
Sub menu L2
Esc
Esc
Enter EscEsc
Up/Dn
Disabled
Pulse Flow Cond.
Enter
Enter
Up/Dn
Up/Dn
Up/Dn
[Unit]/Pulse
Volumetric Flow
Esc
100 mS
60.00 Ltr
Pulse On Time
Esc
Screen
Process
Sub Menu
Top Level 1 Setup
Page 39

The Totalizers reading can be reset by pressing ENTER button. A typical display
with flow meter Totalizer#1 Reset screen is shown below.
The next conformation screen will appear only for 2 seconds.
If during these two seconds user will press ENTER button again, the Totalizer#1
volume will be reset to zero. Following screen will appear for two seconds
5.3.5.2 Submenu L2 Pulse Output Menu
The flow Pulse Output is operating independently from totalizers and based on
configuration settings (see Figure 5.9) can provide pulse frequency proportional
to instantaneous fluid flow rate.
The LCD/keypad and digital communication interface commands are provided to:
- Enable/Disable Pulse Output
- configure Pulse Output for Volumetric or Mass flow process variable
- configure the Unit/Pulse value (in current Vol. or Mass flow units)
- configure Pulse Active On Time (50 - 13000 ms)
34
NOTE: The Pulse Output minimum Active On time is a 50 millisecond
(.05 second). The Optical Pulse Output cannot operate faster than one
pulse every 100 millisecond (.1 second). A good rule to follow is to set
the Unit/Pulse value equal to the maximum flow in the same units per
second. This will limit the pulse rate to no faster than one pulse every
second.
Reset Total #1
Value?
Press Ent key to
reset Totalizer!
Press Ent key to
The Totalizer has been reset!
Page 40

35
For example: Maximum flow rate = 1200 kg/min
(1200 kg/min = 20 kg/sec)
If unit per pulse is set to 1200 kg per pulse, the Optical Pulse
Output will pulse once every minute.
If unit per pulse is set to 20 kg per pulse, the Optical Pulse
Output will pulse once every second.
The Optically isolated Pulse Output incorporate Pulse output queue, which accumulate pulses if the Pulse Output is accumulating process flow faster than the
pulse output hardware can function. The queue will allow the pulses to “catch up”
later if the flow rate decreases. A better practice is to slow down the Pulse Output
by increasing the value in the Unit/Pulse setting in the Pulse Output menu (see
Figure 5.9).
Page 41
36
5.3.6 Submenu L1 Output Menu
Figure 5.10 Submenu L1 Output Menu structure
Disabled
Tabular
Disabled
Mass Flow
Volum. Flow
Tabular
Pressure
Temperature
Volum. Flow
Pressure
Mass Flow
Temperature
T. Range H-L
Diagnostic
Manual On
P. Range H-L
High P. Alarm
Low P. Alarm
Ent
Disabled
Dn Up
Numerical
Volum. Flow
4-20mAOut#1 Mode
Tabular Tabular
Numerical
Mass Flow
4-20mAOut#2 Mode
Ent
Ent
Ent
Setup
Sub Menu
Top Level 1
Numerical
0.0 litr/min
Out#1 4 mA Value
Numerical
0.0 gram/sec
Out#2 4 mA Value
Ent
Ent
Tabular
High T. Alarm
Low T. Alarm
F. Range H-L
High F. Alarm
Low F. Alarm
Total#1 Event
Total#2 Event
2150.0 litr/min
Out#1 20 mA Value
Ent
Tabular
21.56 gram/sec
Out#2 20 mA Value
Enter
Opt #1 Function
Numerical
Hexadecimal
Ent
Tabular
Up/Dn
Low F. Alarm
Opt #2 Function
High F. Alarm
Up/Dn
Entry
Ent
11
Up/Dn
RS-485 Address
Dn Up
Esc
Esc
Process
Screen
Esc
Sub menu L1
Up/Dn Up/Dn
Top Level 1
Enter
Output Menu
Up/Dn
Sub menu L2
4-20mA Output#1
Up/Dn
Sub menu L2
4-20mA Output#2
Up/Dn
Sub menu L2
Optical Outputs
Setup
Sub Menu
Page 42

37
5.3.6.1 Submenu L2 Analog 4-20mA Menus
Vortex Flow Meters are equipped with two channels programmable analog 4-20
mA outputs. Each channel can be individually assigned to one of the following
process variables: Volumetric Flow, Mass Flow, Temperature*, Pressure*. By
default channel #1 is set to Volumetric Flow and channel #2 is set for Mass flow.
For each channel 4 mA and 20 mA points, which define the flow meter output
range, can be preset to maximize resolution of analog output. The meter is most
accurate when operated within the expected flow ranges for your application.
Setting the range to the limits of expected readings will maximize flow meter performance.
When adjusting 4-20mA limits, the value of the limits have to be entered in currently selected (global) for particular process variable engineering units.
5.3.6.2 Submenu L2 Digital Optical Outputs Menus
Two sets of optically isolated digital outputs are provided to actuate user supplied
equipment. These are programmable via digital interface or LCD/Keypad such
that the outputs can be made to switch when a specified event occurs (e.g. when
a low or high flow alarm limit is exceeded or when the totalizer reaches a specified value) or may be directly controlled by user.
The user can configure each optical output action from 14 different options:
- Disabled: No Action (output is not assigned to any events and not energized)
- Low Flow Alarm
- High Flow Alarm
- Range between H&L Flow alarm settings
- Totalizer #1 reading exceed set limit
- Totalizer #2 reading exceed set limit
- Low Temperature alarm (*T/P option only)
- High Temperature alarm (*T/P option only)
- Range between High and Low Temperature alarm (*T/P option only)
- Low Pressure alarm (*T/P option only)
- High Pressure alarm (*T/P option only)
- Range between High and Low Pressure alarm (*T/P option only)
NOTE: Your Vortex Flow Meter was calibrated at the factory for the
specified fluid and full scale flow range: 4mA – 0%F.S. and 20mA –
100%F.S. (see device’s label or calibration data sheet). There is no need
to adjust the Flow Meter 4-20 mA range limits settings, unless
adjustment for specific range is needed.
Page 43

38
- Diagnostic: Output will be energized when any of the Diagnostic or System
events are active
- Manual On Control: Output will be energized until Disabled option will be
selected.
By default both optically isolated outputs are disabled.
5.3.6.3 Submenu L2 RS-485 Address Menus
The standard Vortex flow meter comes with an RS-232 interface. For the optional
RS-485 interface, two hexadecimal characters of the address must be assigned.
By default each flow meter is shipped with RS-485 address 11. When more than
one device is present on RS-485 bus each device should have unique address. The
two characters of address in the hexadecimal representation can be changed from
00 to FF.
RS-485 address setting is not used for Vortex flow meter with RS-232 interface.
5.3.7 Submenu L1 Calibration Menu
The Calibration Menu contains the calibration coefficients for the flow meter, DSP
algorithm settings and Noise Reduction Filters parameters. These values should be
changed only by properly trained personnel. The Pipe ID, Vortex Meter Calibration
Factor, Full Scale Range and Low Flow Cutoff are set at the factory. Consult the factory for help with these settings if the meter is showing erratic flow rate.
NOTE: Address 00 is reserved for global addressing. Do not assign, the
global address for any device. When command with global address is
sent, all devices on the RS-485 bus execute the command but do not
reply with an acknowledge message.
NOTE: Do not assign the RS-485 address for two or more devices on
the same RS-485 bus. If two or more devices with the same address
are connected to the one RS-485 network, a communication collision
will take place on the bus and communication errors will occur.
NOTE: Your Vortex Flow Meter was calibrated configured at the factory
for the specified fluid, flowing conditions, and full scale flow range
(see device’s label or calibration data sheet). There is no need to adjust
the Flow Meter calibration factor, unless adjustment for specific
installation or flowing conditions high or low frequency off is needed.
Any alteration of the flow meter calibration factor will VOID calibration
warranty supplied with instrument.
Page 44

39
5.3.7.1 Submenu L2 PWM DSP Menu
Digital Signal Processing software algorithm can be set to calculate flow rate
based on five different methods:
a) Auto
b) number of pulses over preset measure interval
c) PWM (pulse width measurement)
d) FFT
e) AWD (Analog Watchdog circuitry, for troubleshooting only)
By default Vortex Frequency source is set to Auto. In this mode flow meter automatically switching source to best suited algorithm.
All methods calculates frequency of the pulses from the flow meter sensor. The
number of pulses over preset measure interval method convenient when pulsating
flow or especially noisy signals are encountered. This method allows to get stable
average flow rate if pulse measure interval is set to values equal or more than 2000
ms. This parameters effects the flow update rate. With higher value of the pulse
measure interval, the and stability of the flow measurement improves, but
response time become longer. A suggested pulse measure interval value of 2000
seconds is a good starting point for most applicable process fluids. With lower
settings the response time of the meter will be shorter, but and stability will
degrade. The pulse measure interval settings are only related to the number of
pulses over preset measure interval method. Pulse measure interval can be selected between 500 and 60000 ms.
Page 45

40
Figure 5.11 Submenu L2 PWM DSP Menu structure.
Tabular Entry
Ent
Dn Up
Numerical Entry
Esc
PWM
AUTO
Pulse Counts
FFT
Ent
AWD PWM
Dn Up
Numerical Entry
Ent
Dn Up
Numerical Entry
Ent
Dn Up
Numerical Entry
Ent
Dn Up
Numerical Entry
Ent
Dn Up
Numerical Entry
Ent
Dn Up
Tabular Entry
Ent
Dn Up
Enabled
Esc
Disabled
Enter
Pulse Counts
VorFreq. Source
Esc
Esc
Sub menu L1
CalibrationMenu
Up/Dn Up/Dn
Screen
Process
Enter
Up/Dn
2000 ms
Pulse Meas Int
Esc
Ent
Enter
Sub menu L2
PWM DSPMenu
Esc
Enter
Up/Dn
2 Sec
Flow Damping
Esc
Enter
8
Up/Dn
NRF Sample #
Esc
Up/Dn
Up/Dn
Up/Dn
Enter
4
Up/Dn
NRF Time Limit
Esc
Sub menu L2
FFT DSP Menu
Esc
Enter
2.0 %
NRF Error Limit
Esc
Enter
2
Up/Dn
Flow Window
Esc
Up/Dn
Other Calibration
Enter
Disabled
Up/Dn
Up/Dn
Flow Linearizer
Esc
Parameters
Page 46

41
The Flow Damping value can be selected between 0 and 99 seconds. The value
represents the response time for a 0 - 66 % step flow rate change. When damping value set to 0 it is disabled.
A Noise Reduction Filter algorithm (running average of the individual flow
inputs) is available in the flow meter when pulsating flow or especially noisy signals are encountered.
There are three parameters that make up Signal Processing Control:
- Number of Samples
- Time Limit
- Error Limit
They are described individually below.
Number of Samples [NRF]: The sample number value can be selected between 1
and 32. The number of samples value represents the number of previous individual inputs used to calculate the average value. Eventually the number of samples
in the running average also affects the response time. The more samples is used,
the more inertial flow output reading will be to the actual flow change. A suggested nominal number of 16 samples is a good starting point for most applicable
process fluids.
Time Limit: can be selected between 0 and 99 seconds. The value represents the
response time of the running average flow rate change. The higher the Time Limit
the longer the response time of the filter. If noise reduction filter is not desired it
may be disabled by setting Time Limit parameter to zero. By default unit shipped
from the factory with Time Limit value set to 6.
Error Limit: can be selected between 0.0 and 100.0 % of full scale. The value represents the difference of the signal sample from previous measured value. Error
Limit is configured to reject noise spikes within the flow range while allowing normal frequency variation of the vortex signal. The factory setting 2.0% of full scale
optimizes noise rejection in most applications.
The Turbulence Flow Window parameter is used to define turbulence conditions.
The value represents the difference between two consecutive measurements in %
of full scale. If the difference between two consecutive measurements will be higher than value set for Turbulence Flow Window parameter, the Turbulence Event
will be triggered. Default settings are 30.
NOTE: NRF settings only applicable to PWM algorithm.
Page 47

42
The Flow Linearization algorithm may be used to improve linearity of the flow
measurement. The Flow Linearization table is built during factory calibration procedure and stored in the device EEPROM. The Flow Linearizer can be used with all
flow measurement algorithms. By default unit shipped from the factory with disabled Flow Linearizer.
5.3.7.2 Submenu L2 FFT DSP Menu
FFT Trigger Level is used to define lowest amplitude of the harmonic to be considered as valid vortex signal. When set to zero the FFT Trigger Level will be determine automatically as ¼ of the signal amplitude.
FFT Sample/Second defines the number of samples per second for Analog to
Digital Converter (ADC) taken from a continuous analog signal to make a discreet
signal. This is tabular entry. When set to Automatic mode, the sample rate will be
switched automatically to keep best resolutions (default settings).
NOTE: Do not adjust FFT DSP parameter unless directed to do so by a
AALBORG Technical Support Representative.
Page 48

43
Figure 5.12 Submenu L2 FFT DSP Menu structure.
Esc
Ent
Dn Up
Tabular Entry
FFT Algor. Mode
Esc
Esc
Numerical Entry
Tabular Entry
Ent
Enabled
Disabled
Enter
Up/Dn
Enabled
FFT Trigg. Level
Esc
Up/Dn
Enter
Sub menu L1
CalibrationMenu
Automatic
8000 s/sec
4000 s/sec
2000 s/sec
Dn Up
Enter
Enter
Up/Dn
0 counts
FFT Sampl/Second
Sub menu L2
PWM DSPMenu
1000 s/sec
Num.
500
Up/Dn
FFT Noise Thresh
Esc
Esc
Ent
Up/Dn
Sub menu L2
FFT DSP Menu
500 s/sec
Entry
60 counts
Numerical Entry
Ent
Dn Up
Enter
Up/Dn
Up/Dn
200 counts
AttnTarget Level
Esc
Up/Dn
Tabular Entry
Ent
Up
Enabled
Dn
Enter
Up/Dn
Enabled
Auto Atten. Mode
Esc
Esc
Parameters
Other Calibration
Numerical Entry
Disabled
R1: 185 R2: 171
SA1:125 SA2:120
Enter
Up/Dn
Manual Attn Adj.
SA1:125 SA2:120
Esc
Tabular Entry
Hit Dn when done
Apply 25%FS flow
Up/Dn
Up/Dn
Sens AutoBalance
Esc
Up/Dn
Screen
Process
Esc
Esc
Page 49

44
FFT Noise Threshold is configured to reject noise within the flow range while
allowing normal amplitude variation of the vortex signal. Signals of amplitude
lower than the Trigger Level setting are filtered out. The factory setting optimizes
noise rejection in most applications.
Attenuator Target Level defines the target RMS level for the sensor signals. If
Auto Attenuation is enabled the DSP algorithm will constantly adjust attenuation
to keep sensors RMS output within Attenuator Target Level value. Default factory
setting value (200) works for most applications.
Manual Attenuation Adjustment allows you to manually adjust the sensors RMS
output individually for each sensor. This feature mostly useful only for troubleshooting procedure.
Sensor Auto Balancing procedure designed to automatically balance sensors
RMS output.
5.3.7.3 Submenu Meter Size
The Meter Size or pipe I/D (for insertion type) is preset at the factory and should
not be changed unless meter body or PCB electronics are replaced or meter is
being installed in to the pipe with different internal diameter for insertion flow
meter.
5.3.7.4 Submenu Meter Full Scale Range
The Meter Full Scale Range in Litr/min is preset at the factory and should not be
changed unless meter body or PCB electronics are replaced or meter is reconfigured for different application.
NOTE: Manual Attenuation Adjustment will work properly only when
Auto Attenuation is disabled.
NOTE: Your Vortex Flow Meter sensors were adjusted at the factory for
the best balance. There is no need to perform Auto Balancing
procedure, unless new sensors are installed or PCB electronics is
replaced. Any alteration of the flow meter sensor balancing settings
will VOID calibration warranty supplied with instrument.
Do not adjust FFT DSP parameter unless directed to do so by an
AALBORG Technical Support Representative.
NOTE: Do not adjust Meter Full Scale Range parameter unless directed
to do so by an AALBORG Technical Support Representative.
Page 50

45
5.3.7.5 Submenu Meter Calibration Factor
The Meter Calibration Factor is preset at the factory for the given process conditions (at STD temperature, and pressure), meter body size / pipe ID and requested full scale range. It should only be changed if you replace parts of the flow meter
or your process conditions installation parameters or full scale flow rate are
changed. Contact your Aalborg representative for details.
5.3.7.6 Submenu Meter Low Flow Cut Off
The low flow cut-off can be selected between 0.0 and 10.0 % of the full scale
range. Flows less than the cut-off value are internally driven to zero and not totalized. The analog 4-20mA outputs if assigned to flow rate are set to 4.00 mA. The
switching threshold for the low flow cut-off has 1.0 %F.S. hysteresis.
5.3.7.7 Submenu Meter Low Frequency Cut Off
Low Frequency Cut Off value in Hz is preset at the factory and should not be
changed. Adjustments may be required only if you are experiencing problems.
Contact your Aalborg representative for details.
5.3.7.8 Submenu Meter High Frequency Cut Off
High Frequency Cut Off value in Hz is preset at the factory and should not be
changed. Adjustments may be required only if you are experiencing problems.
Contact your Aalborg representative for details.
5.3.7.9 Submenu Meter Vortex DSP Filter Coefficient
Vortex DSP Filter Coefficient is used for internal DSP algorithm and related to signal strength, density, and velocity for a given application. Adjustments may be
required only if you are experiencing problems. Contact your Aalborg representative for details.
5.3.7.10 Submenu Meter Calibration Pilot Timer
The Pilot Calibration timer accumulates operational hours since last time unit was
calibrated. The value of the timer may be reset by the user by pressing ENTER button. Once ENTER button is pressed the next conformation screen will appear only
for 2 seconds. If during these two seconds user will press ENTER button again,
the Calibration Timer value will be reset to zero.
Page 51

46
5.3.8 Submenu L1 Date/Time Adjust Menu
Use the Time and Date Menu to enter the correct time and date into the flow
meter’s memory. The parameters are used in the PI Mode, Data Log and the alarm
and system Log files. Note: Time is displayed and can be set only in military format. For example, 2:00 PM has to be entered as 14:00:00 in the Set Time menu.
5.3.9 Submenu L1 Fluid Menu
Use the Fluid Menu to configure the flow meter for use with common gases, liquids and steam or change temperature and pressure parameters for Standard,
Normal and Actual units. Your flow meter is pre-programmed at the factory for
your application’s process fluid, and flowing temperature/pressure conditions.
5.3.9.1 Submenu L2 Flowing Fluid Menu
Your flow meter is pre-programmed at the factory for your application’s process
fluid. If different fluid is required it can be set, using Flowing Fluid menu.
NOTE: The Date and Time settings are stored in battery backed SRAM.
If Lithium 3Vdc battery is removed, or CPU board is disconnected from
Terminal board, the Date and Time settings will be reset to zero. For
correct operation of Data Log and System Events Log features the
correct date and time have to be entered.
NOTE: Your Vortex Flow Meter was calibrated at the factory for your
application’s process fluid and flowing conditions (see device’s label or
calibration data sheet). There is no need to adjust the Fluid parameters
unless other fluid type, flowing conditions or temperature and pressure
settings for Standard/Norma units are needed. Any alteration of the
flow meter fluid parameters will VOID calibration warranty supplied with
instrument affect accuracy of the process variable.
Page 52

47
Figure 5.13 Submenu L2 Flowing Fluid Menu structure.
Esc
Current Fluid:
Tabular Entry
Water
Ent
Dn Up
Up/Dn
Fluid Menu
Sub menu L1
Up/Dn
Ent
Up/Dn
Natural Gas
Ent
Gases
Air
CO
CO2
Argon
Steam
Helium
Ammonia
Nitrogen
Methane
Hydrogen
Up/Dn
Oxygen
Other Gas
Hit Ent to Select
Menus
To other Fluid Sub
Oil
Water
Chlorine
Ammonia
Other Liquid
Ent
Up/Dn
Liquids
Dn Up
Tabular Entry
Up/Dn
Hit Ent to Select
Ent
Up/Dn
Flowing Fluid
Sub menu L2
Esc
Up/Dn
Sub menu L2
Goyal-Dorais.
Esc
Screen
Process
Page 53

48
Changing of the flowing fluid settings will affect the way how flow meter calculates
fluid Density and therefore will affect Mass flow rate reading. For 3 liquids: Water,
Ammonia and Chlorine and for 10 real gases: Air, Argon, Ammonia, CO, CO2,
Helium, Hydrogen, Methane, Nitrogen, Oxygen all parameters required for den-
sity calculation are preprogrammed at the factory and stored in flow meter ROM
memory. When listed above fluids are selected, there is no need to enter or change
any additional parameters, meter will calculate Density and Mass flow rate automatically based on actual (temperature and pressure) flowing conditions.
5.3.9.2 Submenu L2 Goyal-Doraiswamy Menu
If “Other Liquid” is selected as flowing fluid the flow meter is using Goyal-
Doraiswamy equation for fluid density calculation. Following parameters related to
flowing liquid have to be entered:
Molecular Weight (Lb/LbMol)
Critical Pressure (PSIA)
Critical Temperature (deg. R)
Critical Compressibility Factor (no units)
See Richard W. Miller,
Flow Measurement Engineering Handbook (Second Edition,
1989),
page 2-67 for definition and use of the Goyal-Doraiswamy equation.
NOTE: For flow meters equipped with optional T/P hardware the
temperature and pressure measurements are taken from temperature
and pressure transducers. If flow meter is not equipped with optional
T/P transducers the actual flowing Temperature and Pressure have to
be entered using Sub Menu L2 “Actual Flowing Conditions”
(see paragraph 5.3.9.6).
NOTE: Before selecting “Other Liquid” menu selection make sure
correct parameters required for fluid density calculation are entered in
Sub Menu L2 Goyal-Doraiswamy (see paragraph 5.3.9.2).
NOTE: Before selecting “Oil” menu selection make sure correct
parameters required for fluid density calculation are entered in Sub
Menu L2 API 2540 (see paragraph 5.3.9.3).
NOTE: If “Natural Gas” or “Other Gas” menu selection has to be made,
make sure correct parameters required for fluid density calculation are
entered in Sub Menu Nat Gas AGA8 or Sub Menu Other Gas
correspondingly (see paragraphs 5.3.9.4 and 5.3.9.5).
Page 54

49
5.3.9.3 Submenu L2 API 2540 Menu
If “Oil” is selected as flowing fluid the flow meter is using API 2540 equation for
fluid density calculation. Following parameters related to flowing Oil have to be
entered:
Oil Density @ 60 °F (kg/m^3)
Constant K0 (no units)
Constant K1 (no units)
See Richard W. Miller,
Flow Measurement Engineering Handbook (Second Edition,
1989),
page 2-76 for definition and use of the API 2540 equation.
NOTE: If “Oil” was not selected at factory as your process flowing fluid
the default settings for API 2540 equation are made for Crude oils and
JP4 as following:
Oil Density @ 60 °F 898.0 kg/m^3
Constant K0 341.0957
Constant K1 0.0
Page 55

50
5.3.9.4 Submenu Nat Gas AGA8 Menu
If “Natural Gas” is selected as flowing fluid the following parameters related to
flowing Natural Gas have to be entered:
AGA Density Mode density calculation algorithm can use different input
data based on available by user parameters. User can
make one of the following selections (tabular entry):
- use density of Natural Gas @ reference Temperature
and Pressure (Lb/Ft^3) provided by gas supplier
- use relative density “Gr” of Natural Gas @ reference
Temperature and Pressure (real specific gravity)
Manufacture Density density of Natural Gas @ reference Temperature and
Pressure (Lb/Ft^3) provided by gas supplier
Relative Density relative density “Gr” of Natural Gas @ reference
Temperature and Pressure (real specific gravity)
Molecular Fracture of N
2 (no units)
Molecular Fracture of CO2 (no units)
Reference Temperature reference Temperature for manufacture or relative
density (deg. F)
Reference Pressure reference Pressure for manufacture or relative
density (PSIA)
5.3.9.5 Submenu Other Gases Menu
If “Other Gas” is selected as flowing fluid the following parameters related to
flowing Gas have to be entered:
Specific Gravity Mode density calculation algorithm can use different
specific gravity data based on available by user
parameters. User can make one of the following
selections (tabular entry):
- use specific gravity as ratio of molecular weight
“G” [(g/mol)/(g/mol)] and compressibility factor
Z @ actual flowing temperature and pressure
- use real specific gravity as ratio of densities @ actual
flowing temperature and pressure Gr = @ (Gas)/@ (Air)
Page 56

51
Mol Weight Ratio Specific Gravity as ratio of molecular weight G =
Mw(gas)/Mw(air)[(g/mol)/(g/mol)] (numerical entry)
Density Ratio Real specific Gravity as density ratio of @ actual
flowing temperature and pressure (numerical entry)
Compress. Z @ TP Compressibility factor Z @ actual flowing
temperature and pressure (numerical entry)
Other Mol Weight Molecular Weight of Gas Mw (Lb/Lb mol)
(numerical entry)
Critical Temp (F) Critical Temperature of the Gas (deg. F)
(numerical entry)
Crit. Press PSIA Critical Pressure of the Gas (PSI) (numerical entry)
5.3.9.6 Submenu Cust Flow. Cond Menu
Actual customer Flowing Conditions Menu includes following parameters:
Cust STD Density Density of the flowing fluid at standard temperature
(for factory settings only) and pressure (g/cm^3). This static parameter is used
only for internal volumetric and mass flow units
conversion and is not related to dynamic Density
calculated by Vortex flow meter.
Cust. Temp (F) customer application actual flowing temperature
(deg. F)
Cust. Press (PSIA) customer application actual flowing pressure (PSIA)
NOTE: Your flow meter is pre-programmed at the factory for your
application’s process flowing temperature and pressure (see device’s
label or calibration data sheet). There is no need to adjust Customer
Flowing Conditions settings, unless application’s flowing temperature
or pressure are changed.
NOTE: Changing Cust STD Density parameter will affect settings for
Flow Alarm settings, Totalizer start flow and 4-20mA output limits
(if mass flow is selected as process variable).
Page 57

52
5.3.9.7 Submenu STD Temp. (F)
Defines Standard Flow Units Temperature in deg. F. By default Standard Flow
Units temperature is set to 70 °F.
5.3.9.8 Submenu STD Pres. (PSIA)
Defines Standard Flow Units Pressure in PSIA. By default Standard Flow Units
pressure is set to 14.7 PSIA.
5.3.9.9 Submenu NORM Temp. (C)
Defines Normal Flow Units Temperature in deg. C. By default Normal Flow Units
temperature is set to 0 °C.
5.3.9.10 Submenu NORM Pres. (KPA)
Defines Normal Flow Units Pressure in KPa. By default Normal Flow Units pressure is set to 101.3 KPa.
5.3.10 Submenu L1 Diagnostic Menu
Diagnostics Menu can be used for troubleshooting purposes and provides information about the meter internal variables. These items (except System Events
Reg. and SysEvent LogFile submenus) are informational only and may not be
changed (read only).
NOTE: The Vortex Calibration Factor is calculated and entered for
Standard conditions (70 °F and 14.7 PSIA). Consult the factory or your
local representative for new Vortex Calibration Factor if standard
temperature or pressure conditions flow range has to be changed.
NOTE: The Vortex Flow meter allows you to measure Standard, Normal
or Actual Flow Units. Actual Temperature and Pressure Flowing
Conditions equal to the Actual Flow Units Temperature and Pressure
parameters.
NOTE: For flow meters equipped with optional T/P hardware the
temperature and pressure measurements are taken from temperature
and pressure transducers. If flow meter is not equipped with optional
T/P transducers the actual flowing Temperature and Pressure have to be
entered in the “Cust. Temp (F)” and “Cust. Temp (F) Pressure (PSI)”
menus.
Page 58
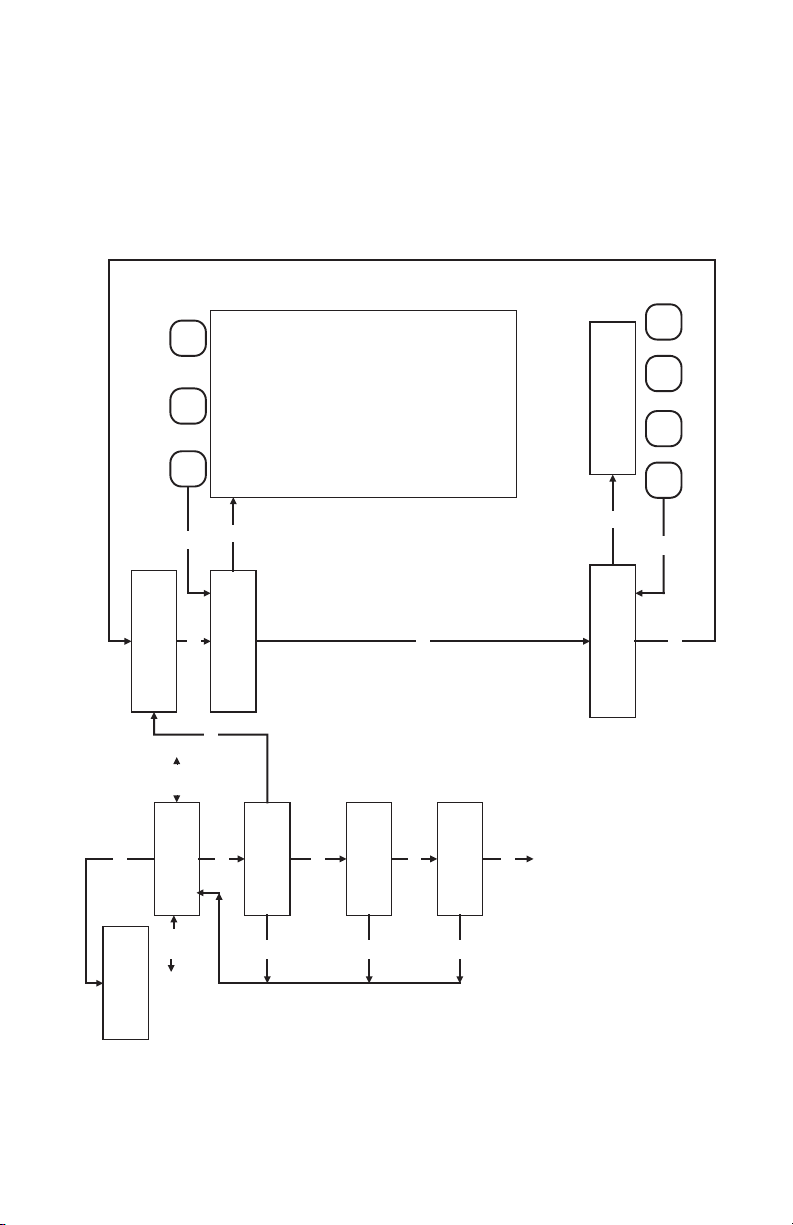
53
5.3.10.1 Submenu L2 System Events Reg. Menu
Figure 5.14 Submenu L2 System Events Register Menu structure.
Dn Up
9-Tot#2 > Limit
A-OptPulse Queue
B-Flow Turbulen.
C-Flow < Cut Off
D-Event Log Over
Tabular Entry
Esc
1-Freq > HiLimit
2-High Flow Alm
0-CPU Temp. High
Esc
Ent
4-High Temp Alm.
3-Low Flow Alarm
5-Low Temp Alm.
6-High Pres Alm.
8-Tot#1 > Limit
7-Low Press Alm.
E-Data Log Over.
F-System L Event
Event Reg Mask
0*23456789ABCDEF
Ent
Esc
Ent
Dn Up
Esc
Cursor
Up/Dn
Up/Dn
Up/Dn
Events List
Diagnostic Menu
Sub Menu
Press Enter Key
Ent
Up/Dn
Sub menu L2
Sys. Events Reg
Esc
Up/Dn
Sub menu L2
Events Log File
Esc
Up/Dn
Up/Dn
560 T:2000 ms
Raw Pulses Cnt
Esc
Event Reg Status
. . 23 . . . . . . . . . . . .
Up/Dn
Esc
Sub menu L1
Up/Dn
Screen
Process
Setup
Top Level 1
Event Reg Mask
0*23456789ABCDEF
Sub Menus items
To other Diagnostic
Page 59

54
Vortex Flow Meters are equipped with a self-diagnostic alarm Event Register
which is available via digital interface and on screen LCD indication.
The following diagnostic events are supported: Table 5.1
Event
Number
Diagnostic Alarm Event Description
LCD bit
Code
1 CPU Temperature too High 0
2 Vortex Frequency above High Frequency Cut Off 1
3 High Flow Alarm 2
4 Low Flow Alarm 3
5 High Fluid Temperature Alarm* 4
6 Low Fluid Temperature Alarm* 5
7 High Fluid Pressure Alarm* 6
8 Low Fluid Pressure Alarm* 7
9 Totalizer#1 exceed set event volume limit 8
10 Totalizer#2 exceed set event volume limit 9
11 Optical Pulse Output Queue overflow A
12 Flow Turbulence B
13 Flow rate below Low Flow Cut Off setting C
14 Event Log File overflow D
15 Data Log overflow E
16 One or more of the 8 System Log Events was registered F
NOTE: Any Alarm events that may have occurred (Event 0 to Event F)
are stored in the internal register. All detected events remain stored
until the register is manually reset (by pressing ENTER key or by
means of the digital communication interface). The Alarm Event
Register is mapped to the SRAM (volatile memory). In case of power
interruption the Event Register will be automatically reset.
a) Event Register Status
Each alarm event has fixed designated position on the LCD screen. Most significant event code (F) is set on the right side of the LCD and least significant event
code (0) is set on the left side of the LCD. If event is not present (not active) it is
represented on the LCD as dot (.) character. If event is present (or was detected
in the past) it is represented on the LCD with corresponding character. A typical
display with Alarm Events Register Status without any detected events is shown
below.
Page 60

55
NOTE: Each Alarm Event can be individually masked (disabled) using
Event Reg Mask menu selection (see Figure 5.14). If alarm event is
masked (disabled) it will not be registered in the Event Register Status
even actual event has occurred.
In the example shown below, event 1 with LCD bit code 2 (High Flow Alarm) and
event 10 with LCD bit code A (Totalizer#2 exceed set event volume limit) have
occurred since the last reset.
In order to reset (clear) Event Register press Ent button. Following screen will
appear just for two seconds.
If ENTER is pressed again, the description for each error is displayed:
If during these two seconds user will press Ent button again, the Alarm Event
Register will be cleared.
b) Alarm Events List
This menu selection provides list of the descriptions and corresponding LCD bit
code for all supported events.
Event Reg Status
. . . . . . . . . . . . . . . .
Event Reg Status
. . 2 . . . . . . . A . . . . .
Press Ent key to
Clear events Reg
Events List
Press Enter Key
Page 61

56
Events List
0-CPU Temp. High
Events List
0-CPU Temp. High
The shown above Event List selections can be scrolled with the Up and Dn buttons. By pressing ENT or Esc buttons user may exit from scrolling mode.
c) Alarm Events Register Mask
With this menu selection user may individually mask (disable) any Alarm Event.
A typical display with Alarm Events Register Mask selection is shown below.
In the example shown above, event 2 with LCD bit code 1 (Vortex Frequency
above High Frequency Cut Off) is masked with asterisk. In order to change event
mask settings user should press Ent button. The flashing cursor will appear on the
left of the LCD screen (on the 0 event position). Use Dn [Cursor] button to move
to desired event code. Use Up button to change mask status (asterisk represent
masked event). Use Ent button to accept and save new mask settings in flow
meter’s non volatile memory.
Page 62

57
5.3.10.2 Submenu L2 System Events Log Menu
Figure 5.15 Submenu L2 System Events Log Menu structure.
only for 2 seconds
07/15/2010 15:36
POWER ON EVENT
Ent
Low Flow Alarm
07/18/2010 05:17
Momentarily displayed
Momentarily displayed
Ent
only for 2 seconds
Tot#2 > Limit
only for 2 seconds
07/18/2010 22:03
Momentarily displayed
Ent
Tabular Entry
Event Log
only for 2 seconds
Has been Cleared
Momentarily displayed
Ent
Dn
Dn
Ent
Event Log Mask
Event Log Mask
******6**9***D*F
Ent
******6**9***D*F
Esc
Dn Up
Esc
Up/Dn
Cursor
Press Dn key to
Clear Event Log
only for 2 seconds
Momentarily displayed
Ent
Up/Dn
Clear Event Log
Press Enter Key
Up/Dn
Event: 22 0F: 0
07/15/2010 15:36
Ent
Event Log Status
177 Events OF: 0
Up/Dn
Esc
Sub menu L1
Diagnostic Menu
Up/Dn
07/18/2010 05:17
Up/Dn
Event: 03 0F: 0
Ent
Sub menu L2
Up/Dn
Sys. Events Reg
Esc
07/18/2010 22:03
Up/Dn
Up/Dn
Event: 09 0F: 0
Sub menu L2
Up/Dn
Esc
Events Log File
Other events
Up/Dn
Up/Dn
Last events
Raw Pulses Cnt
560 T:2000 ms
Esc
Up
Loop On
Loop Off
Dn
Ent
Up/Dn
Loop Off
Event Log Config
Up/Dn
Sub Menus items
To other Diagnostic
Screen
Process
Setup
Sub Menu
Top Level 1
Page 63

58
Vortex Flow Meters are equipped with programmable Event Log File feature which
is available via digital interface and LCD/KeyPad. The Event Log File menu allows
user assign any of 24 different System and Alarm Events to be recorded with
Date/Time stamp in to flow meter non volatile memory.
System Event List (unmaskable) Table 5.2
Event Log file can store total up to 511 records. Each record includes date/time
stamp and event code (see Tables 5.1 and 5.2). If event is not masked in the Event
Mask Register, when actual Event occurred, the record will be made in the Log file
and corresponding bit in the internal flag register will be updated (set). The second record of the same Event code may occur only if corresponding Event bit was
reset in the flag register (for example if Low Flow Alarm conditions was activated
and flow rate increased above Low Flow Alarm threshold settings).
a) Event Log Status
With this menu selection user may check how many total events are recorded in
the Event Log file. The Overflow counter (OF) indicates how many times Event Log
index was wrapped around back to zero. Pressing Enter key from Event Log Status
screen will allow customer to list and review all recorded events. The Event record
will display Date and Time on the first line of the LCD and Event code on the second. Pressing Enter key one more time will momentarily (for 2 seconds) replace
Event code with detailed description of the corresponding event. Pressing UP or
DN button will allow to list all other Events in the Event Log file.
NOTE: Each Alarm Event can be individually masked (disabled) using
Event Log Mask menu selection (see Figure 5.15). If alarm event is
masked (disabled) it will not be recorded in to the Event Log File, even
actual event has occurred. System Events (see table 5.x) can not be
masked therefore will be always recorded in to the Event Log File.
Event Number System Event Description
16
PEZO SENS. FAULT
17
TEMP SENS. FAULT*
18
PRES SENS. FAULT*
19
SERIAL COMM. ERROR
20
EEPROM ACCESS ERROR
21
BATTERY FAILURE
22
POWER ON EVENT
23
PASSWORD EVENT
24
FATAL ERROR
Page 64

59
When the last Log file item is reached, the following prompt “#241 has no Data”
will be displayed on the second line of the LCD (#241 is for example only, actual
number may be different).
b) Event Log Configuration
If Event Log configured to “Loop Off” mode, the Event Log file will be locked
(disabled) when last event with index 511 is recorder. If Event Log configured to
“Loop On” mode, when last index (511) is reached, the firmware “wraps around”
Event Log index back to 0 and new records will overwrite old Events records.
c) Event Log Mask
With this menu selection user may individually mask (disable) any Alarm Log
Event. A typical display with Alarm Events Log Mask selection is shown below.
In the example shown above, all alarm events except #7 with LCD bit code 6, #10
with LCD bit code 9, #13 with LCD bit code D, #15 with LCD bit code F are masked
with asterisk. In order to change Log event mask settings user should press Enter
button. The flashing cursor will appear on the left of the LCD screen (on the 0
event position). Use Dn [Cursor] button to move to desired event code. Use Up
button to change mask status (asterisk represent masked event). Use Enter button to accept and save new Event Log mask settings in flow meter’s non volatile
memory.
d) Clear Event Log
In order to reset (clear) Event Log File press Ent button. Following screen will
appear just for two seconds.
NOTE: System Events (see table 5.2) can not be masked therefore will
be always recorded in to the Event Log File.
Event Log Mask
******6**9***D*F
Press Ent key to
Clear events Log
Page 65

60
If during these two seconds user will press Dn button again, the Event Log file
will be cleared (all records will be deleted).
5.3.10.3 Submenu Raw Pulse Counts
This menu selection provides number of pulses from the flow sensors within
specific measurement interval (read only).
5.3.10.4 Submenu Pulse Frequency
This menu selection provides raw and averaged values of the frequency from the
flow sensors (read only).
5.3.10.5 Submenu PWM Frequency
This menu selection provides raw and averaged values of the frequency from
DSP PWM algorithm (read only).
5.3.10.6 Submenu AWD Frequency
This menu selection provides raw and averaged values of the frequency from
DSP AWD algorithm (read only).
5.3.10.7 Submenu DSP FFT Output
This menu selection provides vortex frequency and amplitude from DSP FFT
algorithm (read only).
5.3.10.8 Submenu DSP FFT Output
This menu selection provides instantaneous vortex frequency and amplitude
from DSP FFT algorithm (read only).
5.3.10.9 Submenu DSP FFT Average
This menu selection provides averaged vortex frequency and DC amplitude from
DSP FFT algorithm (read only).
5.3.10.10 Submenu Piezo Sensors RMS
This menu selection provides averaged signal RMS value for both piezo sensors
(read only).
Page 66

61
5.3.10.11 Submenu Sensor Attenuation
This menu selection provides attenuation level for both piezo sensor amplifiers
(read only).
5.3.10.12 Submenu T/P ADC Output
This menu selection provides raw value of the ADC counts for RTD and pressure
sensor circuitry (read only). The reading only applicable for meters with optional
T/P sensors.
5.3.10.13 Submenu DAC Outputs Value
This menu selection provides current value of the DAC registers for each analog
4-20 mA output circuitry (read only).
5.3.10.14 Submenu CPU Temperature
This menu selection provides current value of the PCB and CPU temperature in
°C (read only).
5.3.11 Submenu L1 Display Menu
Use the Display Menu to set the cycle time for automatic screen sequencing used
in the PI mode, change the PI screen between static and dynamic modes, enable
or disable particular screen displayed in the PI mode.
5.3.11.1 Submenu Display Mode
Process Information screens can be configured to be static (manual control) or
dynamic (automatic sequencing). In the static mode pressing Up button, pages
through the PI screens in the forward direction, pressing Dn button, pages
through the PI screens in the reverse direction. When the last PI screen is reached,
the firmware “wraps around” and scrolls to the initial PI screen once again.
In the dynamic mode firmware initiates automatic screen sequencing with user
adjustable screen Cycle Time (see Paragraph 5.311.2 “Display Menu”). When the
last PI screen is reached, the firmware “wraps around” and scrolls to the initial PI
screen once again.
NOTE: PI screens which are masked in the Display Mask register
(see. Paragraph 5.3.11.3) will be skipped.
Page 67

62
5.3.11.2 Submenu Screen Cycle Time
This menu selection defines time interval in seconds for each PI screen to be
displayed in the dynamic mode (automatic sequencing). Screen Cycle Time can
be set to any value in the range between 1 to 300 seconds (numerical entry).
5.3.11.3 Submenu Screen Mask
Using Screen Mask settings user can enable (unmask) or disable (mask) up to
13 [0-C] different process variable combinations (see Figure 5.4). By default unit
is shipped from factory with all PI screens enabled. A typical display with Screen
Mask selection is shown below.
In the example shown above, all PI screens are enabled. Each PI screen assigned
to corresponding bit in the PI Screen Register. In order to change PI Screen mask
settings user should press Enter button. The flashing cursor will appear on the left
of the LCD screen (on the 0 screen position). Use Dn [Cursor] button to move to
desired PI screen code. Use Up button to change mask status (asterisk represent
masked event). Use Enter button to accept and save new PI Screen mask settings
in flow meter’s non volatile memory.
5.3.12 Submenu L1 Data Log Menu
Vortex Flow Meters are equipped with programmable Data Log feature which is
available via digital interface and LCD/KeyPad. The Data Log menu allows user to
assign one of the four process variables (Vol. Flow, Mass Flow, Temperature, and
Pressure) to be recorded with selected interval time based on configurable conditions. Data Log can store total up to 15,871 records. Each record includes
date/time stamp and process variable value in currently active engineering units.
5.3.12.1 Submenu Data Logger Mode
Using Data Logger Mode settings user can enable or disable data log functionality (tabular entry). By default unit shipped from the factory with Data Logger Mode
set to disable.
Screen Mask
0123456789ABC***
Page 68

63
5.3.12.2 Submenu Data Log Configuration
Using Data Logger Mode settings user can set data log to one of the following
configuration: Loop On (default settings),
Loop Off,
Number of Samples
If Data Log configured to “Loop Off” mode, the Data Log will be locked (disabled)
when last record with index 15,871 is recorder. If Data Log configured to “Loop
On” mode, when last index (15,871) is reached, the firmware “wraps around” Data
Log index back to 0 and new records will overwrite old data records. If Data Log
configured to Number of Samples the Data Log will be locked (disabled) when
record index will be equal to value set in the Submenu Log # of Samples (see next
paragraph).
5.3.12.3 Submenu Log # of Samples
This menu entry allows user set exact number of samples to be taken (recorded)
when data log configured in to the “Number of Samples” mode (numerical entry).
By default “Number of Samples” parameter is set to maximum allowable value:
15,871.
5.3.12.4 Submenu Process Variable
This menu entry allows user to assign one of the four process variables (Vol. Flow,
Mass Flow, Temperature, and Pressure) to be recorded in to the data log (tabular
entry). By default the “Process Variable” parameter is set to Volumetric Flow.
5.3.12.5 Submenu Samples Interval
This menu entry allows user to select desired data log sample rate. Samples
Interval can be set to any value in the range between 1 to 3600 seconds (numerical entry). The Samples Interval value directly affects how long flow meter can collect the PI data. For example: if “Samples Interval” value set to 1 second, the user
can collect data as long as 4 hours and 24 minutes; if “Samples Interval” value
set to 180 second (3 minutes), the user can collect data as long as 33 days 1 hour
and 36 minutes.
5.3.12.6 Submenu DL Start Condition
This menu entry allows user to select when Data Logger will start recording PI data
(tabular entry). Following settings are available:
Unconditional (default settings)
High PV Alarm
Low PV Alarm
Page 69

64
When set to “Unconditional”, the flow meter will start collect selected Process
Variable data as soon as user enables data log. When set to “High PV Alarm”, the
flow meter will start collect selected Process Variable data only if Data Log is
enabled and High Alarm Condition for corresponding PV is detected. When set to
“Low PV Alarm”, the flow meter will start collect selected Process Variable data
only if Data Log is enabled and Low Alarm Condition for corresponding PV is
detected.
5.3.12.7 Submenu DL Stop Condition
This menu entry allows user to select when Data Logger will stop recording PI data
(tabular entry). Following settings are available:
Unconditional (default settings)
High PV Alarm
Low PV Alarm
When set to “Unconditional”, the flow meter will stop collect selected Process
Variable data only if Log # of Samples limit is reached (when log is configured to
“Number of Samples” mode) or last index (15,871) is reached (when log is configured to Loop Off mode). When set to “High PV Alarm”, the flow meter will stop
collect selected Process Variable data only if Data Log is enabled and High Alarm
Condition for corresponding PV is detected. When set to “Low PV Alarm”, the flow
meter will stop collect selected Process Variable data only if Data Log is enabled
and Low Alarm Condition for corresponding PV is detected.
5.3.12.8 Submenu Data Log Status
This menu selection provides current Data Log index and overflow counter values
(read only). A typical display with Data Log Status is shown below.
In order to reset (clear) Data Log press Enter button. Following screen will appear
just for two seconds.
Data Log Status
Ind: 60 OF: 0
Press Ent key to
clear Data Log
Page 70

65
If during these two seconds user will press Enter button again, the Data Log index
and overflow counter will be reset to zero.
6. ANALOG CIRCUITRY CALIBRATION
6.1 Analog 4-20 mA output Circuitry calibration
The Vortex 4-20 mA analog output calibration involves calculation and storing of
the offset and span variables in the EEPROM for both output channels. The following is a list of the EEPROM variables used for analog outputs computation:
Analog Output#1 variables:
Index Name Description
32 Out1_Scale_mA - Analog 4-20 mA Output #1 Scale
33 Out1_Offset_mA - Analog 4-20 mA Output #1 Offset
Analog Output#2 variables:
Index Name Description
34 Out2_Scale_mA - Analog 4-20 mA Output #2 Scale
35 Out2_Offset_mA - Analog 4-20 mA Output #2 Offset
NOTE: The PV data recorded in to the Data Log are only accessible
via digital communication interface. Use ASCII Interface Command Set
(see APPENDIX B) or Aalborg supplied Communication Utility to
retrieve (read) PV data from the meter.
NOTE: The 4-20 mA analog outputs available on the Vortex Flow Meter
were calibrated at the factory. There is no need to perform analog out
put calibration unless the CPU or TERM PCB was replaced. Any
alteration of the analog output scaling variables in the EEPROM table
will VOID calibration warranty supplied with instrument.
NOTE: It is recommended to use the Aalborg
®
supplied calibration and
maintenance software for analog output calibration. This software
includes an automated calibration procedure which may radically
simplify calculation of the offsets and spans variables and, the reading
and writing for the EEPROM table.
Page 71

66
6.1.1 Initial setup
Power up the Vortex Flow Meter for at least 15 minutes prior to commencing the
calibration procedure. Make sure absolutely no flow takes place through the meter.
Establish digital RS-485/RS-232 communication between PC (communication terminal) and Vortex flow meter. The commands provided below assume that calibration will be performed manually (w/o Aalborg
®
supplied calibration and mainte-
nance software) and the device has RS-485 address 11. If Aalborg
®
supplied calibration and maintenance software is used, skip the next section and follow the
software prompts.
Enter Backdoor mode by typing: !11,MW,1000,1[CR]
Unit will respond with: !11,BackDoorEnabled: Y
Disable DAC update by typing: !11,WRITE,4,Y[CR]
Unit will respond with: !11,DisableUpdate: Y
where: [CR] Carriage return character
(equals pressing Enter key on the PC key board).
6.1.2 Analog 4-20 mA channel#1 output calibration
1. Connect a certified high sensitivity multi meter set for the current
measurement to pins 1 (+) and 2 (-) of the TB3 terminal connector.
2. Write 4000 counts to the DAC1 channel: !11,WRITE,0,4000[CR]
3. Read current with the meter and designate it to Reading_4000_mA variable.
4. Write 400 counts to the DAC1 channel: !11,WRITE,0,400CR]
5. Read current with the meter and designate it to Reading_400_mA variable.
6. Calculate Out1_Scale_mA value:
Out1_Scale_mA = 3600 / (Reading_4000_mA - Reading_400_mA)
7. Calculate Out1_Offset_mA value:
Out1_Offset_mA = - (Reading_4000_mA/10 - Reading_400_mA) X Out1_Scale_mA
8. Save Out1_Scale_mA in to the EEPROM: !11,MW,32,Y[CR]
Save Out1_Offset_mA in to the EEPROM: !11,MW,33,Z[CR]
Where: Y – the calculated Out1_Scale_mA value.
Z – the calculated Out1_Offset_mA value.
Page 72

67
6.1.3 Analog 4-20 mA channel#2 output calibration
1. Connect a certified high sensitivity multi meter set for the current
measurement to pins 3 (+) and 4 (-) of the TB3 terminal connector.
2. Write 4000 counts to the DAC2 channel: !11,WRITE,1,4000[CR]
3. Read current with the meter and designate it to Reading_4000_mA variable.
4. Write 400 counts to the DAC1 channel: !11,WRITE,1,400CR]
5. Read current with the meter and designate it to Reading_400_mA variable.
6. Calculate Out2_Scale_mA value:
Out2_Scale_mA = 3600 / (Reading_4000_mA - Reading_400_mA)
7. Calculate Out2_Offset_mA value:
Out2_Offset_mA = - (Reading_4000_mA/10 - Reading_400_mA) X Out2_Scale_mA
8. Save Out2_Scale_mA in to the EEPROM: !11,MW,34,Y[CR]
Save Out2_Offset_mA in to the EEPROM: !11,MW,35,Z[CR]
Where: Y – the calculated Out2_Scale_mA value.
Z – the calculated Out2_Offset_mA value.
Page 73

68
6.2 Temperature and Pressure Sensors Calibration*
7. START UP
7.1 Cautions Prior to Start Up
In general, it is good practice to purge the line slowly to prevent unnecessary
damage to the meter.
Once the pipeline is pressurized, check the flow meter and flanges for leaks.
The temperature and pressure transducers should also be checked for leaks.
The meter may give erratic outputs during purging the line if the power has been
turned on before purging the line.
The Vortex flow meter does not have the capability of measuring two phase flow.
In liquid applications, the line should be totally purged of air before powering the
flow meter.
During start up, remember that the meter will not read accurately until the flow
rate meets or exceeds the minimum flow rates stated on the I.D. sheet. The
maximum and minimum flow rates for a specific flow meter can be found on the
meter I.D. sheet.
NOTE: If recalibration of the Temperature or Pressure sensors is
required, it is recommended to use the Aalborg
®
supplied calibration
and maintenance software for analog output calibration. This software
includes an automated calibration procedure which may radically
simplify calculation of the offsets and spans variables and, the reading
and writing for the EEPROM table.
NOTE: If your flow meter is equipped with optional Temperature and
Pressure sensors, then they were calibrated at the factory. There is no
need to perform Temperature and Pressure sensors calibration unless
the CPU / TERM PCB or actual Temperature or Pressure sensor was
replaced. Any alteration of the temperature or pressure input scaling
variables in the EEPROM table will VOID calibration warranty supplied
with instrument.
Page 74

69
8. TROUBLESHOOTING
8.1 Common Conditions
Your Vortex Flow Meter was thoroughly checked at numerous quality control
points during and after manufacturing and assembly operations. It was calibrated
according to your desired flow and pressure conditions for a given fluid. It was
carefully packed to prevent damage during shipment. Should you feel that the
instrument is not functioning properly, please check for the following common
conditions first:
Are all cables connected correctly?
Are there any leaks in the installation?
Is the power supply correctly selected according to requirements?
When several meters are used a power supply with appropriate current rating
should be selected. Were the connector pinouts matched properly?
When interchanging with other manufacturers' equipment, cables and connectors must be carefully wired for correct pin configuration.
Page 75

70
8.2 Troubleshooting Guide
NO. INDICATION LIKELY REASON SOLUTION
1 LCD Display
remains blank
when unit is
powered up. No
response when
flow is introduced
from analog 4-20
mA.
Power supply is bad
or polarity is
reversed.
Measure voltage on pins 1 and 2 of the TB1 screw
terminal connector. If voltage is out of specified
range, then replace power supply with a new one.
If polarity is reversed (reading is negative) make
correct connection.
PC board is
defective.
Return flow meter to factory for repair.
2 LCD Displays flow
reading, but 4-20
mA output signal
does not change
(always the same
or reading around
4.0 mA).
Volumetric or Mass
Flow PV is no
assigned to
corresponding
4-20mA output
Using Key Pad, navigate to Submenu L1 “Output
Menu” and select one of the Submenu L2 options:
“4-20mA Output1” or “4-20mA Output2”
(see paragraph 5.3.6.1). Make sure that parameter
“4-20mA Output1 Mode” or “4-20mA Output2
Mode” is set to Volumetric or Mass Flow.
External loop is open
or load resistance
more than 600 Ohm
Check external connections to pins 1 and 2
(for channel #1), 3 and 4 (for channel #2) of the
TB3 screw terminal connector. Make sure the loop
resistance is less than 600 Ohm.
Flow output 4-20 mA
schematic is burned
out or damaged.
Using Key Pad, navigate to Submenu L1 “Diagnostic
Menu” and select “Submenu DAC Outputs”. Record
the #1 and #2 counts values and consult the factory
with findings.
3 Fluid flows
through the Vortex
flow meter, but
LCD Display
reading and the
corresponding
4-20 mA flow
output signal do
not respond to
flow.
The fluid flow rate is
below set Low flow
cut-off value.
Sensors or PC board
is defective.
Check settings for Low flow cut-off value and make
required adjustment (see paragraph 5.3.7.6
“Submenu Meter Low Flow Cut Off”).
Using ESD precautions and hazardous area
precautions, remove the electronics enclosure
window cover. Remove electronics assembly unit.
Disconnect the vortex sensor connector from the
CPU board (the CPU board is the board with LCD
display) via cut out in the terminal board. Measure
the resistance from each outside pin to the center
pin (meter ground) – each should be open. Measure
the resistance from the center pin to the meter
ground (metal enclosure or pipe) – this should be
grounded to the meter. With the sensor connector
still disconnected from PCB, using Key Pad,
navigate to Submenu L1 “Diagnostic Menu” and
select “Pulse Frequency” or “PWM Frequency”
screen. Hold a finger on the metal part of the small
screwdriver and touch exposed outside pins of the
sensor connector on the CPU board. The meter
should read electrical noise, 60 or 50 Hz for
example. If it is true, re-install vortex sensor
connector back and check flow meter with flow
conditions. If necessary contact factory for
additional help.
Page 76

71
NO. INDICATION LIKELY REASON SOLUTION
4 There is no actual
fluid flow through
the Vortex meter
(no flow
conditions), but
LCD Display
reading some flow
rate.
Sensors wires are
disconnected from
CPU board.
Using ESD precautions and hazardous area
precautions, remove the electronics enclosure
window cover. Remove electronics assembly unit.
Disconnect the vortex sensor connector from the
CPU board (the CPU board is the board with LCD
display) via cut out in the terminal board.
Make sure two wires from the sensor are firmly
attached to outside pins of the connector and wire
from the center of the connector is attached to the
grounding terminal screw inside of the electronics
assembly enclosure.
Vortex flow meter
not properly
grounded.
Make sure flow meter enclosure case (external
Grounding terminal) is directly connected to earth
ground with minimal impedance (see pages 105-107).
Flow Meter is too
sensitive to the
external noise or
vibration.
Using Key Pad, navigate to Submenu L1 “Diagnostic
Menu” and record following parameters: “FFT
Output”, “FFT Average”, “Sensors RMS” and consult
the factory with findings.
5 Erratic Flow rate
Reading
The flow rate may be
too low, just at the
cutoff of the meter
range, and the flow
cycles above and
below the cutoff
making an erratic
output.
The meter range is provided with product label
attached to the meter body (based on customer’s
application flowing conditions when the meter was
ordered). Consult the factory if necessary to
confirm the meter range based on current operating
conditions. It may be possible to lower the low flow
cutoff to increase the meter range.
Mechanical
installation may be
wrong.
Verify the straight run is adequate as described in
Paragraph 3.3 “PIPING GUIDELINES”. For in-line
meters, make sure the meter is not installed
backwards and there are no gaskets protruding into
the flow stream. For insertion meters, verify the
insertion depth and flow direction.
The meter may be
reacting to actual
changes in the flow
stream.
The displayed flow rate values can be smoothed
using the Flow damping and NRF time constant
parameters in the PWM DSP Menu (see paragraph
5.3.7.1).
Page 77

72
NO. INDICATION LIKELY REASON SOLUTION
6 The Temperature*
reading on the
LCD is not correct
(out of the device
measurement
range: -20 to
260C)
* - for devices
with T/P option.
RTD connector got
loose and is not
connected to the
PCB board.
Check RTD connector on the terminal PCB, make
sure it is firmly attached to the header J3.
RTD sensor is
defective
With power applied to the flow meter, navigate to
Submenu L1 “Diagnostic Menu” and select “T/P
ADC Out” menu option. The T value should be
around 840 counts at room temperature
(20 - 25 °C). Using ESD precautions and hazardous
area precautions, remove the electronics enclosure
window cover. Remove electronics assembly unit.
Disconnect the RTD temperature sensor connector
from the header J3 on the terminal board. Measure
the resistance across the outside pins of the
temperature sensor connector. It should read
approximately 109 ohms at room temperature
(higher resistance at higher temperatures). Contact
factory with finding.
7 The Pressure*
reading on the
LCD is not correct
(out of the device
measurement
range or does not
react on pressure
change in the
process line)
* - for devices
with T/P option.
Pressure sensor
connector got loose
and is not connected
to the PCB board.
Check pressure connector on the terminal PCB,
make sure it is firmly attached to the header J2.
Pressure sensor is
defective
With power applied to the flow meter, navigate to
Submenu L1 “Diagnostic Menu” and select “T/P
ADC Out” menu option. The P value should be
around 900* counts at ambient pressure (14.7
PSIA) * this value only applicable for pressure
sensor with full scale range 100 PSIA. Consult
factory if your flow meter has different pressure
range.
8 The Flow Meter
Diagnostic Alarm
Event with code 0
– “CPU Temp.
High” is active.
MCU temperature is
too high (overload).
Disconnect power from the Vortex flow meter. Make
sure the ambient temperature is within specified
range (below 65 °C). Let the device cool down for at
least 15 minutes. Apply power to the flow meter and
check Diagnostic Alarm Event. If overload condition
will be indicated again the unit has to be returned to
the factory for repair.
9 The Flow Meter
System Event with
code 24 - “Fatal
Error” is active.
Fatal Error (EEPROM
or SRAM corrupted)
Cycle the power on the Vortex flow meter. If System
Event with code 24 indicating again the unit has to
be returned to the factory for repair.
Page 78

73
APPENDIX A
AALBORG7 VORTEX METER EEPROM Variables Rev.P002 [07/08/2010]
Note: indexes 0-19 are write protected (manufacture and calibration specific data)
INDEX NAME
DATA
TYPE
NOTES
0
BlankEEPROM[10] char[10] Do not modify. Table Revision [PROTECTED]
1
SerialNumber[20] char[20] Serial Number [PROTECTED]
2
ModelNumber[20] char[20] Model Number [PROTECTED]
3
SoftwareVer[10] char[10] Firmware Version [PROTECTED]
4
ManufReservedF1 float Manufacture Specific float data [PROTECTED]
5
ManufReservedF2 float Manufacture Specific float data [PROTECTED]
6
MeterCalFactorM float
Original Manuf. Assigned Meter Cal Factor
[PROTECTED]
7
MeterSize float
Original Manuf. assigned size of the meter [inch]
[PROTECTED]
8
ReservedText[12] char[12]
Reserved for Manufacture Specific Text Info
[PROTECTED]
9
ManufReservedF3 float Manufacture Specific float data [PROTECTED]
10
ManufReservedF4 float Manufacture Specific float data [PROTECTED]
11
ManufReservedF5 float Manufacture Specific float data [PROTECTED]
12
ManufReservedF6 float Manufacture Specific float data [PROTECTED]
13
ManufReservedUI1 uint Manufacture Specific uint data [PROTECTED]
14
ManufReservedUI2 uint Manufacture Specific uint data [PROTECTED]
15
ManufReservedUI3 uint Manufacture Specific uint data [PROTECTED]
16
ManufReservedUI4 uint Manufacture Specific uint data [PROTECTED]
17
ManufReservedSI1 int Manufacture Specific int data [PROTECTED]
18
ManufReservedSI2 int Manufacture Specific int data [PROTECTED]
19
ManufReservedSI3 int Manufacture Specific int data [PROTECTED]
20
TimeSinceCalHr float Time elapsed since last calibration in hours
21
ProtectionCode uint Program Parameters Protection Code [0-255]
22
DPTreshLevel uint Auto DP attenuator threshold level (+/- counts from target)
23
BackLightMode uint Reserved for future implementation**
24
LCD_Diagnostic uint LCD Diagnostic Mode: [0, 1]
25
Address485 char[4] Two hexadecimal characters address for RS485 only [01-FF]
26
LCD_Mode uint Main Process screen mode: 0-Static,1-Dynamic
27
LCD_Static_Mode uint Type of the static LCD screen: 0-12
28
LCD_AUTO_Mode_Mask uint Mask of the AUTO LCD screen: hex 0x01 - 0xFF
29
LCD_Cycle_Tim uint Time in seconds for each var. to be displayed in AUTO mode
30
Out4_20mA_Mode1 uint Process Variable assignment to 4-20mA output channel #1: [0-5]
31
Out4_20mA_Mode2 uint Process Variable assignment to 4-20mA output channel #2: [0-5]
Page 79

74
INDEX NAME
DATA
TYPE
NOTES
32
Out1_Scale_mA float Analog 4-20 mA Out #1 Scale
33
Out1_Offset_mA float Analog 4-20 mA Out #1 Offset
34
Out2_Scale_mA float Analog 4-20 mA Out #2 Scale
35
Out2_Offset_mA float Analog 4-20 mA Out #2 Offset
36
F_AlarmMode uint Flow Alarm Mode (0=Disabled, 1=Enabled)
37
F_LowAlarmPFS float Low Flow Alarm in PFS [0-1.00]
38
F_HiAlarmPFS float High Flow Alarm in PFS [0-1.00]
39
F_AlmDelay uint Delay in seconds 0-3600 for Flow Alarm action
40
F_AlarmLatch uint Flow Alarm Latch
41
F_AlarmCond uint Flow Alarm Conditions ( 0 = Volumetric, 1 = Mass)
42
T_AlarmMode uint Temp Alarm Mode (0=Disabled, 1=Enabled)**
43
T_LowAlarm_C float Low Temp Alarm in deg C**
44
T_HiAlarm_C float High Temp Alarm in deg C**
45
T_AlmDelay uint Delay in seconds 0-3600 for Temp Alarm action **
46
T_AlarmLatch uint Temp Alarm Latch**
47
Total1_Cond uint Totalizer #1 Flow Conditions: 0 – Volumetric, 1 - Mass
48
P_AlarmMode uint Pressure Alarm Mode (0=Disabled, 1=Enabled)**
49
P_LowAlarm_Pa float Low Pressure Alarm in PSIA**
50
P_HiAlarm_Pa float High Pressure Alarm in PSIA**
51
P_AlmDelay uint Delay in seconds 0-3600 for Pressure Alarm action
52
P_AlarmLatch uint Pressure Alarm Latch**
53
Total2_Cond uint Totalizer #2 Flow Conditions: 0 – Volumetric, 1 - Mass
54
FlowUnits_Vol uint Current Volumetric Flow Units of Measure [0-29]
55
FlowUnits_Mass uint Current Mass Flow Units of Measure [0-24]
56
TempUnits uint Current Temperature Units of Measure [0-3]
57
PressureUnits uint Current Pressure Units of Measure [0-10]
58
DensityUnits uint Current Density Units of Measure [0-6]
59
FFTtoPC_RMS uint Sensor RMS value switch threshold [0-4095]
60
Vol_Flow_Cond uint Actual, Std or Normal Volumetric Flow Units of Measure [0-2]
61
UDUnitKfactor float User defined Vol Unit K-Factor to L/min
62
UDUnitTimeBase int User defined Vol Unit Time base 1, 60, 3600, 86400 (sec.)
63
Out4_20mAHold uint 4-20mA Output Assignment Hold (first 16 bit only)
64
UDMassUnitTimeBase uint User defined Mass Unit Time base 1, 60, 3600, 86400 (sec.)
65
UDMassUnitKfactor float User defined Mass Unit K-Factor to gramm/min
66
OptOut1_Config uint Optical Output #1 Configuration (function) [0-13]
67
OptOut2_Config uint Optical Output #2 Configuration (function) [0-13]
Page 80

75
INDEX NAME
DATA
TYPE
NOTES
68
Total1_Mode uint Totalizer#1 mode (0-Disabled, 1-Enabledd)
69
Total1_FlowStart float Start totalizer at flow [0-1.0 notation %F.S.]
70 Total1_VolStop float Totalizer Event volume in %*s, 0 = disable
71 Out1_4mA_Value float 4-20mA Output#1 4 mA Value (in EEPROM stored units)
72 Out1_20mA_Value float 4-20mA Output#1 20 mA Value (in EEPROM stored units)
73 Total1_ConfLock uint Totalizer#1 reading lock (0-can be reset, 1-can not be reset)
74 Total1_Volume_BkUp float
Totalizer#1 backup volume in %s
(saved from BB SRAM every 6 min.)
75 Total2_Mode uint Totalizer#2 mode (mode (0-Disabled, 1-Enabledd)
76 Total2_FlowStart float Start totalizer#2 at flow [0-1.0 notation %F.S.]
77 Total2_VolStop float Totalizer#2 Event volume in %*s, 0 = disable
78 Out2_4mA_Value float 4-20mA Output#2 4 mA Value (in EEPROM stored units)
79 Out2_20mA_Value uint 4-20mA Output#2 20 mA Value (in EEPROM stored units)
80 Total2_ConfLock uint Totalizer#2 reading lock (0-can be reset, 1-can not be reset)
81 Total2_Volume_BkUp float
Totalizer#2 backup volume in %s
(saved from BB SRAM every 6 min.)
82 Flow_Pulse_Mode uint Flow Pulse Output Mode (0=Dis'd, 1=En'd)
83 Pulse_Units_Cond uint EU type (0 -volumetric based, 1 - mass based)
84 FFT_Damping uint FFT Damping (1-99 seconds)
85 Units_Per_Pulse float Pulse output scaling (units per pulse)
86 Active_Low_Time float Number of ms output will be active when pulse is developed
87 FlowLinearizer uint Flow Linearizer mode (1-En’d, 0 – Dis’d)
88 FlowTbl[0].FlowPFS float Flow Linearizer Index 0 PFS (must be 0.0)
89 FlowTbl[0].LinCounts uint Flow Linearizer Index 0 Counts (must be 0)
90 FlowTbl[1].FlowPFS float Flow Linearizer Index 1 PFS [0.0 – 1.0]
91 FlowTbl[1].LinCounts uint Flow Linearizer Index 1 Counts
92 FlowTbl[2].FlowPFS float Flow Linearizer Index 2 PFS [0.0 – 1.0]
93 FlowTbl[2].LinCounts uint Flow Linearizer Index 2 Counts
94 FlowTbl[3].FlowPFS float Flow Linearizer Index 3 PFS [0.0 – 1.0]
95 FlowTbl[3].LinCounts uint Flow Linearizer Index 3 Counts
96 FlowTbl[4].FlowPFS float Flow Linearizer Index 4 PFS [0.0 – 1.0]
97 FlowTbl[4].LinCounts uint Flow Linearizer Index 4 Counts
98 FlowTbl[5].FlowPFS float Flow Linearizer Index 5 PFS [0.0 – 1.0]
99 FlowTbl[5].LinCounts uint Flow Linearizer Index 5 Counts
100 FlowTbl[6].FlowPFS float Flow Linearizer Index 6 PFS [0.0 – 1.0]
101 FlowTbl[6].LinCounts uint Flow Linearizer Index 6 Counts
102 FlowTbl[7].FlowPFS float Flow Linearizer Index 7 PFS [0.0 – 1.0]
103 FlowTbl[7].LinCounts uint Flow Linearizer Index 7 Counts
Page 81

76
INDEX NAME
DATA
TYPE
NOTES
104 FlowTbl[8].FlowPFS float Flow Linearizer Index 8 PFS [0.0 – 1.0]
105 FlowTbl[8].LinCounts uint Flow Linearizer Index 8 Counts
106 FlowTbl[9].FlowPFS float Flow Linearizer Index 9 PFS [0.0 – 1.0]
107 FlowTbl[9].LinCounts uint Flow Linearizer Index 9 Counts
108 FlowTbl[10].FlowPFS float Flow Linearizer Index 10 PFS [0.0 – 1.0]
109 FlowTbl[10].LinCounts uint Flow Linearizer Index 10 Counts
110 PulseMeasInt uint Flow Pulse Measure Interval in mS [500-60000]
111 FlowMeasureMode uint Flow measure mode [0-4]
112 Flow_NRF_NSample uint Flow NRF Number of Samples [1-32] for PWM
113 Flow_NRF_ErrLimit float Flow NRF Error Value [0.05 10.0]%F.S. for PWM
114 Flow_NRF_TimeLimit uint Flow NRF Time Interval for PWM [0-199], 0-dis'd
115 Flow_Damping uint Reading Damping 1-99 (sec.) for PC mode
116 Flow_Window uint Flow running average window for PC mode [0-100], 0-dis'd
117 FlowAWD_NRF_NSample uint Flow NRF Number of Samples [1-32] for AWD
118 FlowAWD_NRF_ErrLimit float Flow NRF Error Value [0.05 10.0]%F.S. for AWD
119 FlowAWD_NRF_TimeLimit uint Flow NRF Time Interval for AWD [0-199], 0-dis'd
120 Min_Freq_PWM uint Minimum measure Frequency for PWM model
121 Max_Freq_PWM uint Maximum measure Frequency for PWM model
122 Min_Freq_AWD uint Minimum measure Frequency for AWD model
123 Max_Freq_AWD uint Maximum measure Frequency for AWD mode
124 AWD_DC_Offset uint AWD DC offset for AWD mode (def. 2225 counts)
125 AWD_Tresh_PFS uint AWD threshold in % of Average DC offset for AWD mode (1 - 80)
126 FFT_DSP_Enable uint FFT algorithm Enable/Disable
127 FFT_Sample_Rate uint
FFT Sample Frequency: 0-Auto,1 - 8000, 2 - 4000, 3 - 2000,
4 - 1000, 5 - 500Hz
128 FFT_Triger_Level uint FFT Trigger level counts (0-4095)
129 FFT_NoiseTreshold float FFT Noise threshold counts (0-4000)
130 DP_Channel_1 uint Sensor#1 DP master attenuator setting (original)
131 DP_Channel_2 uint Sensor#2 DP master attenuator setting (original)
132 Auto_Att_Mode uint Signal Auto Attenuation Mode: 0-Dis'd, 1-Enb'd
133 Auto_Att_Target_Level float Signal Auto Attenuation Target level (RMS counts)
134 Meter_Pipe_ID float Meter or Pipe Internal Diameter (inch)
135 Meter_FS_Range float Meter Full Scale range in L/min
136 MeterCalFactor float Calibration Factor:[Hz/l/min] (for STD conditions)
137 Vortex_Coeff_Ck float Manuf. Specific settings (do not change)
138 LowFlowCutOff float Meter low flow cut off [0 - 25.0 %F.S.]
139 Low_Freq_CutOff float Meter Low Frequency cut off (Hz)
140 High_Freq_CutOff float Meter High Frequency cut off (Hz)
Page 82

77
INDEX NAME
DATA
TYPE
NOTES
141 FluidName[20] char[20] Other Fluid Name
142 CalibratedBy[20] char[20] Calibration technician name
143 CalibratedAt[20] char[20] Calibration Location
144 DateCalibrated[12] char[12] Calibration date
145 DateCalibrationDue[12] char[12] Date calibration due
146 UserTagName[20] char[20] User Defined Device Tag Name or Number
147 DiagEventMask uint Mask for Diagnostic Events Register
148 DiagEventLogMask uint Mask for Diagnostic Events Log
149 DiagEventLogMode uint Diagnostic Events Mode: 0 - stop when full, 1-loop over
150 DE_LoopOverCnt uint Diagnostic Events Log Loop Over Counter
151 RMS_25PFS_MinCounts uint Minimum allowed counts for sensor's RMS reading on 25%FS
152 FlowingFluidType uint Type of the flowing Fluid: Liquid-0, Gas-1
153 Mole_Weight float Goyal-Dorais Molecular Weight, lbm/(lbm•mol)
154 Goyal_Crit_P float Goyal-Dorais critical pressure (PSIA)
155 Goyal_Crit_T float Goyal-Dorais critical temperature (deg. F)
156 Goyal_Zc float Goyal-Dorais critical compressibility
157 AGA8_Density_Mode uint Density mode: 0- Manuf. Density, 1- Relative Density @ TP
158 AGA8_ManufDensity float Nat Gas Density @ TP specified by gas manufacture (Lb/Ft^3)
159 API2540_Density_60 float API2540 Oil Density at 60F (Kg/m^3)
160 API2540_K0 float API2540 related coefficient (no units)
161 API2540_K1 float API2540 related coefficient (no units)
162 Other_Rel_Dens float Other Gas Relative Density Gr (Real Specific Gravity at TP)
163 Other_RefTemp_F float Other Gas Reference temperature for Gr
164 AGA8_Rel_Density float AGA8 Natural gas Relative Density at ref. TP
165 AGA8_MoleFract_N2 float AGA8 Natural gas molecular fracture for N2
166 AGA8_MoleFract_CO2 float AGA8 Natural gas molecular fracture for CO2
167 AGA8_RefTemp_F float AGA8 Natural gas reference temperature (deg. F)
168 AGA8_RefPres_PSIA float AGA8 Natural gas reference pressure (PSIA)
169 FlowingGasIndex uint Type of the flowing Gas [0-12]
170 Other_Spec_Gravity float Ratio of Molec. Weight Mgas/Mair g/mol)/(g/mol)
171 Other_Compress_Z float Other gas Compressibility factor Z @ TP
172 Other_SG_Mode uint
Other gas specific gravity mode :0-Ratio of molecular
weight, 1- Relative Density Gr @ ref. TP
173 STD_Temp_F float STD Temperature (deg. F)
174 STD_Press_PSIA float STD Pressure (PSIA)
175 NORM_Temp_C float NORMAL Temperature (deg. C)
176 NORM_Press_KPA float NORMAL Pressure (KPA)
177 Fluid_Density float Fluid Density @ STD g/cm^3
Page 83

78
INDEX NAME
DATA
TYPE
NOTES
178 Flowing_Temp_F float
Customer's flowing Temperature (deg. F) for meters with no TP
hardware option
179 Flowing_Pres_PSIA float
Customer's flowing Pressure (PSIA) for meters with no TP hardware option
180 FlowingLiquidIndex uint Type of the flowing Liquid [0-4]
181 Other_RefPres_PSIA float Other Gas Reference pressure for Gr (PSIA)
182 Other_MolWeight float Other Gas Molecular Weight (Lb/LbMol)
183 Fluid_Reserved4; float Reserved parameters for future extention
184 Fluid_Reserved5; float Reserved parameters for future extention
185 RTD_InScale float Temperature RTD sensor input Scale**
186 RTD_InOffset float Temperature RTD sensor input Offset**
187 RTD_LinearMode uint RTD Linearizer: 0 – Disabled, 1 - Enabled**
188 RTD_NRF_NSample uint RTD NRF Number of Samples [1-32] **
189 RTD_NRF_ErrLimit float RTD NRF Error Value [0.05 10.0]%F.S. **
190 RTD_NRF_TimeLimit uint RTD NRF Time Interval [0-199], 0-dis'd**
191 PS_InScale float Pressure sensor input Scale**
192 PS_InOffset float Pressure sensor input Offset**
193 PS_FS_Range float Pressure sensor full scale range in Pa**
194 PS_LinearMode uint RTD Linearizer: 0 – Disabled, 1 - Enabled**
195 PS_NRF_NSample uint Pressure sensor NRF Number of Samples [1-32] **
196 PS_NRF_ErrLimit float Press. sensor NRF Error Value [0.05 10.0]%F.S. **
197 PS_NRF_TimeLimit uint Pressure sensor RTD NRF Time Interval [0-199], 0-dis'dv
198 PS_Tbl [0].PFS_Pressure float Pressure rate in PFS [0.0-1.0] **
199 PS_Tbl [0].Temperature float Ambient Temperature [0 - 100C] **
200 PS_Tbl [1].PFS_Pressure float Pressure rate in PFS [0.0-1.0] **
201 PS_Tbl [1].Temperature float Ambient Temperature [0 - 100C] **
202 PS_Tbl [2].PFS_Pressure float Pressure rate in PFS [0.0-1.0] **
203 PS_Tbl [2].Temperature float Ambient Temperature [0 - 100C] **
204 PS_Tbl [3].PFS_Pressure float Pressure rate in PFS [0.0-1.0] **
205 PS_Tbl [3].Temperature float Ambient Temperature [0 - 100C]**
206 PS_Tbl [4].PFS_Pressure float Pressure rate in PFS [0.0-1.0] **
207 PS_Tbl [4].Temperature float Ambient Temperature [0 - 100C] **
208 PS_Tbl [5].PFS_Pressure float Pressure rate in PFS [0.0-1.0] **
209 PS_Tbl [5].Temperature float Ambient Temperature [0 - 100C] **
210 DL_Mode uint Data Logger mode: 0 - Off, 1- On
211 DL_Config uint
Data Logger configuration: 0 - Loop, 1 - No Overwrite,
2-Number of Samples
212 DL_NumSampl uint Data Log Number of samples to collect for (conf 2)
Page 84

79
INDEX NAME
DATA
TYPE
NOTES
213 DL_ProcVar uint Data Log Current Process Variable selector [0-3]
214 DL_Interval uint Data Log Sample Interval Time in seconds
215 DL_LoopOverCn uint Data Log Loop Over Counter
216 DL_StartCond uint
Data Log Start Conditions: 0 - Unconditional,
1-High Flow Alarm, 2 – Low Flow Alarm
217 DL_StopCond uint
Data Log Stop Conditions: 0 - Unconditional,
1-High Flow Alarm, 2 – Low Flow Alarm
218 EEMagicNumber uint Number used to verify EEPROM integrity
** Not supported in some hardware configurations
Page 85

80
VORTEX METER ASCII COMMANDS SET Rev. 07/29/2010
RS232/RS485 The standard VORTEX METER comes with an RS232 interface. The protocol described below allows communication with the unit using
either a custom software program or a “dumb” terminal. All values are sent as printable ASCII characters. For RS-232 interface, the start character and
two characters of address have to be omitted. For the RS485 interface the start character is always ‘!’ and two characters of address are follow. The com-
mand string is terminated with a carriage return (line feeds are automatically stripped out by the VORTEX METER:
RS-485: !<Addr>,<Cmd>,Arg1,Arg2,Arg3,Arg4<CR> Example: !12,VF<CR>
RS-232: <Cmd>,Arg1,Arg2,Arg3,Arg4<CR> Example: VF<CR>
Where: ! Start character **
Addr RS485 device address in the ASCII representation of hexadecimal (00 through FF are valid).**
Cmd The one or two character command from the table below.
Arg1 to Arg4 The command arguments from the table below. Multiple arguments are comma delimited.
CR Carriage return character.
** Default address for all units is set to 11 hex. Do not submit start character and device address for RS-232 option.
Several examples of commands follow. All assume that the VORTEX METER has been configured for address 18 (12 hex) on the RS485 bus:
1. To get a volumetric flow reading: !12,VF<CR>
The device will reply: !12,50.0<CR> (Assuming the flow is at 50.0% FS)
2. To get current Flow Alarm status: !12,FA,S<CR>
The device will reply: !12,FAS:N<CR> > (Assuming no alarm conditions)
3. To get Totalizer#1 reading: !12,T,1,R<CR>
The device will reply: !12,T1R:93.5<CR> (Assuming the Totalizer#1 reading is 93.5)
4. Set the volumetric flow high and low alarm limit to 90% and 10% of full scale flow rate: !12,FA,C,V,90.0,10.0<CR>
The device will reply: !12, FAC:V,90.0,10.0<CR>
APPENDIX B
Page 86

81
AALBORG VORTEX METER ASCII SOFTWARE INTERFACE COMMANDS
NOTE: AN “*” INDICATES POWER UP DEFAULT SETTINGS. AN “**” INDICATES OPTIONAL FEATURE NOT AVAILABLE ON ALL MODELS.
COMMAND
NAME
DESCRIPTION
NO.
COMMAND SYNTAX
COMMAND ARGUMENT 1 ARGUMENT 2 ARGUMENT 3 ARGUMENT 4 RESPONSE
Volumetric
Flow
Requests the current volumet-
ric flow reading in current EU
1
VF
<Value> (Actual volumetric
flow in current engineering
units)
Mass Flow
Requests the current mass
flow reading in current EU
2 MF <Value> (Actual mass flow in
current engineering units)
Density
Requests the current Density
reading in current EU
3
D
<Value> (Actual density in cur-
rent EU)
Temperature
/Pressure**
Requests the current
temperature and pressure
reading in current EU
4 TP <T_Value>, <P_Value>
Example: 22.5,14.7
<T_Value>, <P_Value>
Example: 22.5,14.7
Diagnostic
Events
Register
Read/Reset current status of
Diagnostic Events Register
See list of the Diagnostic
Events below.
5 DE
NO ARGUMENT
(read status)
DE:0x10
0x10 – diagnostic word
(16 bits wide)
R (reset Event Log
register to 0x0000)
DE:0x0
Diagnostic
Mask
Display/Set Diagnostic Events
Mask register
See list of the Diagnostic
Events below.
6
DM NO ARGUMENT
(read current Diagnostic
Events Mask register)
DM:0x9FFF
0x9FFF – diagnostic mask (16
bits wide).
Set bit - Enable
Clear bit - Disable
<Value>0x0000 - 0xFFFF
NOTE: all 6 characters
are required
DM:0x9FFF
Page 87

82
COMMAND
NAME
DESCRIPTION
NO.
COMMAND SYNTAX
COMMAND ARGUMENT 1 ARGUMENT 2
ARGUMENT 3
ARGUMENT 4 RESPONSE
Meter
Info
Requests meter
configuration info:
- full scale range
(L/min)
- Meter size (inches)
- T/P option support
(Y,N)
- 4-20 mA Output #1
configuration
- 4-20 mA Output #2
configuration
7 MI MI: 1000.0,0.75,Y,V,M
1000.0 – full scale L/min
0.75 – meter size [inch]
Y – T/P supported
N – T/P not supported
V – volumetric flow
M – mass flow
T – Temperature
P – Pressure
D – Density
O – Off (Disabled)
Flow
Alarms
Sets / reads the status
of the flow alarms.
Note: High and Low limits
for Volumetric flow
configuration have to be
entered in fraction %FS
notation (0.0 – 1.0). High
and Low limits for Mass
flow configuration have to
be entered in the currently
active mass flow units.
High alarm value has to
be more than Low alarm
value.
Alarm conditions:
Flow > High Limit = H
Flow < Low Limit = L
Low < Flow < High = N
8 FA C (flow configuration) V-volum. flow
M-mass flow
<Value>
(high limit)
<Value>
(low limit)
FAC:V,0.9,0.1
A (action delay in sec) <Value> [0-3600] FAA:<Value (sec)>
E (enable alarm) FA:E
D (disable alarm)* FA:D
R (read current
status)
FAR:N (no alarm)
FAR:H (high alarm)
FAR:L (low alarm)
S (Read current
settings)
FAS:M,C,H,L,D,B
where: M – mode (E/D)
C– Configuration (V/M)
H – High settings value
L – Low settings value
D – Action Delay (sec)
B – Latch mode (0-1)
L (Latch mode) <Value> (0-disabled*)
(1-enabl’d)
FAL:<Value> where:
Value = 0 – 1
Page 88

83
COMMAND
NAME
DESCRIPTION
NO.
COMMAND SYNTAX
COMMAND
ARGUMENT 1
ARGUMENT 2
ARGUMENT 3 ARGUMENT 4 RESPONSE
Temperature
Alarms**
Sets / reads the status of the
temperature alarms.
Note: High and Low limits have
to be entered in the °C. High
alarm value has to be more
than Low alarm value.
Alarm conditions:
Temp. > High Limit = H
Temp. < Low Limit = L
Low < Temp. < High = N
9 TA H
(high temp. limit)
<Value>
(-20.1-260 °C)
TAH:<Value [°C]>
L
(low temp. limit)
<Value>
(-20.1-260 °C)
TAL:<Value [°C]>
A
(action delay in
seconds)
<Value> (0-3600
sec.)
TAA:<Value [Sec]>
E
(enable alarm)
TA:E
D
(disable alarm)*
TA:D
R (read current
status)
TAR:N (no alarm)
TAR:H (high alarm)
TAR: L (low alarm)
S (Read current
settings)
TAS:M,L,H,D,B where:
M – mode (E/D)
L – Low settings (°C)
H – High settings (°C)
D – Action Delay (sec)
B – Latch mode (0-1)
B Block (Latch)
mode
<Value>
(0-disabled*)
(1-enabl’d )
TAB:<Value> where:
Value = 0 – 1
Page 89

84
COMMAND
NAME
DESCRIPTION
NO.
COMMAND SYNTAX
COMMAND
ARGUMENT 1
ARGUMENT 2 ARGUMENT 3 ARGUMENT 4 RESPONSE
Pressure
Alarms**
Sets / reads the status of the
pressure alarms.
Note: High and Low limits have
to be entered in the Pa units.
High alarm value has to be
more than Low alarm value.
Alarm conditions:
Pressure > High Limit = H
Pressure. < Low Limit = L
Low < Press. < High = N
10 PA H
(high press. limit)
<Value>
(0–Max.Press.)
PAH:<Value [PA]>
L
(low press. limit)
<Value>
(0-Max.Press.)
PAL:<Value [Pa]>
A
(action delay in
seconds)
<Value> (0-3600
sec.)
PAA:<Value [sec]>
E
(enable alarm)
PA:E
D
(disable alarm)*
PA:D
R (read
current status)
PAR:N (no alarm)
PAR:H (high alarm)
PAR: L (low alarm)
S (Read
current settings)
PAS:M,L,H,D,B where:
M – mode (E/D)
L – Low settings (Pa)
H – High settings (Pa)
D – Action Delay (sec)
B – Latch mode (0-1)
B Block (Latch)
mode
<Value>
(0-disabled*)
(1-enabl’d )
PAB:<Value> where:
Value = 0 – 1
Page 90

85
COMMAND
NAME
DESCRIPTION
NO.
COMMAND SYNTAX
COMMAND
ARGUMENT 1
ARGUMENT 2
ARGUMENT 3
ARGUMENT 4 RESPONSE
Optical
Outputs
Assigns action of the two
optical outputs. The optical
output becomes active when
the condition specified by an
Argument 2 becomes true.
Argument 2:
D - no action (disabled*)
FL - low flow alarm
FH - high flow alarm
FR - Range between High &
Low alarms
T1 - Tot#1 reading > limit
T2 - Tot#2 reading > limit
TL - low temp. alarm
TH - high temp. alarm
TR - Range between High &
Low temp. alarms
PL - low press. alarm
PH - high press. alarm
PR - Range between High &
Low press. alarms
DE - Diagnostic Events
M - Manual On (enabled)
11 O 1 (output #1)
2 (output #2)
D *
O1:D or O2:D
FL O1:FL or O2:FL
FH O1:FH or O2:FH
FR
O1:FR or O2:FR
T1 O1:MT or O2:MT
T2
O1:PT or O2:PT
TL O1:TL or O2:TL
TH
O1:TH or O2:TH
TR
O1:TR or O2:TR
PL
O1:PL or O2:PL
PH
O1:PH or O2:PH
PR O1:PR or O2:PR
DE
O1:DE or O2:DE
M
O1:M or O2:M
S (read current
settings)
O1:D or O2:D
Page 91

86
COMMAND
NAME
DESCRIPTION
NO.
COMMAND SYNTAX
COMMAND
ARGUMENT 1
ARGUMENT 2 ARGUMENT 3 ARGUMENT 4 RESPONSE
Totalizers
Sets and controls action of the
flow Totalizers.
NOTE:
Start totalizer at Flow value has
to be entered for Volumetric
and Mass flow conditions in
fraction %FS notation
(0.0 – 1.0)
Limit volume has to be
entered:
-for Volumetric flow conditions
in currently selected volume
EU
-for Mass flow conditions in
currently selected mass EU
If Totalizer hit limit event is not
required, set “Limit Volume”
value (argument 4) to zero.
Totalizers reading is stored in
EEPROM (non volatile)
memory. Power cycle will not
affect Totalizers reading.
12
T
1 (Totalizer #1)
2 (Totalizer #2)
Z
(Reset to zero)
T1Z or T2Z
V – Volumetric.
Flow Condition
<value>
(start totalizer at
flow)
Fraction %FS not.
(0.0 – 1.0)
<value>
(Limit volume
in current
Volumetric E.U.)
T1V:0.1, 0.0orT2V:0.1, 0.0
M – Mass.
Flow Condition
<value> (start
totalizer at flow)
Fraction %FS not.
(0.0 – 1.0)
<value>
(Limit volume
in current Mass
based E.U.)
T1M:0.1, 0.0
or
T2M:0.1, 0.0
D
(disable
totalizer)*
T1:D or T2:D
E
(enable totalizer)
T1:E or T2:E
R (read current
totalizer volume)
T1R:<value>
or
T2R:<value>
(in current EU)
S (setting status) T1S:Mode,Condition,StartFl
ow,LimitVolumeorT2S:Mode,Condition,StartFl
ow,LimitVolume
Page 92

87
COMMAND
NAME
DESCRIPTION
NO.
COMMAND SYNTAX
COMMAND
ARGUMENT 1
ARGUMENT 2
ARGUMENT 3 ARGUMENT 4 RESPONSE
Pulse
Output
Sets and controls action of the
programmable Pulse Output
circuitry. NOTE: Unit/Pulse
value has to be entered:-for
Volumetric flow conditions
in currently selected volume EU
-for Mass flow conditions
in currently selected mass EU
EU has to be not time based.
It is recommended to set the
unit/pulse value equal to the
maximum flow in the same
units per second. This will limit
the pulse to no faster than one
pulse every second.
Example: Maximum flow rate:
1200 liter/min (1200 liter/min =
20 liters per second)
If Unit/Pulse is set to 20 liters
per pulse, the output will pulse
once every second.
13 P
C (flow
configuration)
V-volum. flow
M-mass flow
<Value>
(Unit/Pulse)
Volumetric flow -
current
Volumetric E.U.
Mass flow - cur-
rent mass EU
(example:
10 litr/pulse)
PCV:<value>,<value>
Example:
PCV:V,10
Or
PCM:<value>,<value>
Example:
PCM:M,2.5
T (Pulse active
Time in ms)
<value>
[10 -13000 ms]
PT:<value>
Example: PT:1000
D (disable pulse
output)*
P:D
E (enable pulse
output)
P:E
Q (read current
pulse output
Queue value)
PQ:<value>
(number of pulses)
S (setting status) PS:Mode,FlowConditions,
Unit/Pulse,PulseTimeInterval
Fluid
Density for
standard
conditions
Read and set Fluid Density for
standard conditions in g/cm3
NOTE: it is not measured
density.
14 FD
(New Density
Value)
0.0001 @ Density
@ 10.0 g/cm3
FD:<value>
Example:
FD:1.293
No Argument
(Returns Current
Density in g/cm3)
FD:<value>
Example:
FD:1.293
Page 93

88
COMMAND
NAME
DESCRIPTION
NO.
COMMAND SYNTAX
COMMAND
ARGUMENT 1
ARGUMENT 2 ARGUMENT 3
ARGUMENT 4
RESPONSE
Units of
measure
Set units of measure for flow
rate, temperature, pressure,
density, and totalizer reading.
Note: The units of the totalizer
output are not per unit time.
For Volumetric user defined
units:
k-Factor value represents
conversion value from L/min.
For Mass user defined units:
k-Factor value represents con-
version value from g/min.
Time base argument:
S - seconds
M – minutes
H – hours
D- days
Density argument:
Y - use density
N – do not use density
Temperature, Pressure and
Density EU only supported if
T/P hardware is installed.
Igal - Imperial Gal
MilL – million liters
Bbl - Barrels
15
U
V
% (% F.S.)*
UV:%
litr/sec UV: litr/sec
litr/min UV: litr/min
litr/hr UV: litr/hr
litr/day
UV: litr/day
m^3/sec
UV: m^3/sec
m^3/min UV: m^3/min
m^3/hr UV: m^3/hr
m^3/day UV: m^3/day
f^3/sec UV:f^3/sec
f^3/min UV:f^3/min
f^3/hr UV:f^3/hr
f^3/day UV:f^3/day
gal/sec
UV:gal/sec
gal/min
UV:gal/min
gal/hr
UV:gal/hr
gal/day
UV:gal/day
Igal/sec
UV:Igal/sec
Igal/min UV:Igal/min
Igal/hr UV:Igal/hr
Igal/day UV:Igal/day
MilL/sec
UV:MilL/sec
MilL/min
UV:MilL/min
MilL/hr
UV:MilL/hr
MilL/day
UV:MilL/day
bbl/sec
UV:bbl/sec
bbl/min UV:bbl/min
bbl/hr
UV:bbl/hr
bbl/day UV:bbl/day
VOLUSER (user defined)
<k-Factor value> <Time Base>
UV:VOLUSER,<F>,<T>
No Argument (status)
UV:<EU name>
Page 94

89
COMMAND
NAME
DESCRIPTION
NO.
COMMAND SYNTAX
COMMAND ARGUMENT 1 ARGUMENT 2 ARGUMENT 3
ARGUMENT 4
RESPONSE
Mton – Ton (metric)
Ston - Short Ton
Lton - Long Ton
M
gram/sec UM:gram/sec
gram/min UM:gram/min
gram/hr
UM:gram/hr
gram/day
UM:gram/day
kg/sec
UM:kg/sec
kg/min
UM:kg/min
kg/hr UM:kg/hr
kg/day
UM:kg/day
lb/sec UM:lb/sec
lb/min UM:lb/min
lb/hr UM:lb/hr
lb/day UM:lb/day
Mton/sec UM:Mton/sec
Mton/min UM:Mton/min
Mton/hr
UM:Mton/hr
Mton/day
UM:Mton/day
Ston/sec UM:Ston/sec
Ston/min
UM:Ston/min
Ston/hr
UM:Ston/hr
Ston/day UM:Ston/day
Lton/sec UM:Lton/sec
Lton/min UM:Lton/min
Lton/hr
UM:Lton/hr
Lton/day UM:Lton/day
MASSUSER (user defined) <k-factor value> <Time Base>
UM:MASSUSER,<F>,<T>
No Argument (status)
UM:<EU name>
T**
F
UT:F
C UT:C
K UT:K
R
UT:R
No Argument (status)
UT:<EU name>
Page 95
90
COMMAND
NAME
DESCRIPTION
NO
.
COMMAND SYNTAX
COMMAND ARGUMENT 1
ARGUMENT 2 ARGUMENT 3
ARGUMENT 4 RESPONSE
P** psi
UP:psi
bar UP:bar
mbar UP:mbar
inHg UP:inHg
mmHg
UP:mmHg
kPa UP:kPa
MPa
UP:MPa
atm
UP:atm
gcm2
UP:gcm2
kgc2
UP:kgc2
torr
UP:torr
No Argument
(status)
UP:<EU name>
D**
g/cm^3
UD:g/cm^3
kg/m^3
UD:kg/m^3
g/litr
UD:g/litr
kg/litr
UD:kg/litr
lb/ft^3 UD:lb/ft^3
lb/gal UD:lb/gal
lb/in^3
UD:lb/in^3
No Argument
(status)
UD:<EU name>
Page 96

91
COMMAND
NAME
DESCRIPTION
NO.
COMMAND SYNTAX
COMMAND
ARGUMENT 1
ARGUMENT 2 ARGUMENT 3
ARGUMENT 4
RESPONSE
Real Time
Calendar
Read and set date/time
for battery backed
calendar.
16 C R
(read calendar) Returns
current date and time.
CR:MM/DD/YYYY,HH:MM:SS
Example:
CR:07/28/2010,12:11:52
D
(set date)
<Date string>
mm/dd/yyyy
CD:mm/dd/yyyy
Example: CD:07/28/2010
T
(set time)
<Time string>
hh:mm:ss
CT: hh:mm:ss
Example: CT:17:30:55
System
Events
Log
Read System Event
Log records from
EEPROM and sets
Events Log parameters
See list of the Diagnostic
Events below.
NOTE: Events higher
than 0xFFFF can not
be masked.
Read Log Index
command returns:
Date - MM/DD/YYYY
Time - HH:MM:SS
Event Code – [0-24]
17
SL
L
Loop (when max. index
exceeded rollover to
index 0)
(New Value) [E or D] SLL:<value> Example: SLL:D
No Argument
(Return current settings)
SLL:<value>
Example: SLL:D
S
Log Status: Current Index
[0-511] Rollover counter
SLS:<Index>,<Counter>
Example: SLS:97,0
M
System Event Log Mask
NOTE: Events higher than
0xFFFF can not be
masked.
<Value> 0x0000 To
0xFFFF (all 6 characters
are required)
SLM:<value>
Example: SLM:0x0013
No Argument
(Return current settings)
SLM:<value>
Example: SLM:0x0013
R
Read Log Index
<Value>
Index: [0-511]
SLR:Date,Time,Event
SLR:07/28/2010,12:11:52,22
C
Clear SysEvents Log
SLC
Flow Units
Selections
(defined in
#29)
Display/Change Meter
Flow Units: S - Standard
A - Actual
N - Normal
18
FC (New Value) [S,A,N]
FC: <Value> Example: FC:S
No Argument
(Returns current flow
units cond. settings)
FC: <Value>
Example:
FC:S
Page 97

92
COMMAND
NAME
DESCRIPTION
NO.
COMMAND SYNTAX
COMMAND
ARGUMENT 1
ARGUMENT 2
ARGUMENT 3
ARGUMENT 4 RESPONSE
Calibration
Settings
Sets/Reads
Calibration
related variables.
Argument 1 = T
Hours since last
time unit was
calibrated.
NOTE: has to be
reset to zero after
calibration.
19 CS S
Meter Size/Pipe ID
[inches]
<Value>
[inches]
CSS:<value>
Example: CSS:0.75
No Argument (Returns
Current Meter Size settings)
CSS:<value>
Example: CSS:0.75
F
Meter Full Scale
Range in liter/min
<Value>
[liter/min]
CSF:<value>
Example CSF:1000.0
No Argument (Returns
Current Meter FS Range)
CSF:<value>
Example: CSF:1000.0
C
Meter Calibration
Factor Hz/liter/min]
(for STD condi-
tions)
<Value>
[Hz/l/min]
CSC:<value>
Example CSC:1.0
No Argument
(Returns Current Meter
Calibration Factor)
CSC:<value>
Example CSC:1.0
O
Meter Low and
High Frequency Cut
Off [Hz]
<Low Cut off Value> (Hz)
<High Cut off
Value>(Hz)
CSO:<Low CutOff Value>,
:<High CutOff Value>
No Argument
(Returns Current Cut off
Values settings)
CSO:<Low CutOff Value>,
:<High CutOff Value>
L
Meter Low Flow
Cut Off in % of full
scale
<Value>
(%FS)
CSL:<value>
Example: CSL:5.0
No Argument
(Returns Current value)
CSL:<value>
Example: CSL:5.0
T
Calibration/Mainten
ance Timer
No Argument
(read timer)
CST:<value>
Example: CST:1024.2
Z
Set Cal. Timer to Zero
CST:Z
Page 98

93
COMMAND
NAME
DESCRIPTION
NO.
COMMAND SYNTAX
COMMAND ARGUMENT 1
ARGUMENT 2
ARGUMENT 3
ARGUMENT 4
RESPONSE
PWM
DSP
Settings
Sets/Reads PWM
DSP related variables.
Argument1 = V:
Display/Change Meter
Vortex Frequency
Source Following
Vortex Frequency
sources are supported:
0 - Automatic
1 - Pulse Counts
2 - PWM
3 – FFT
4 - AWD PWM
Argument1 = I:
Display/Change Meter
Pulse Measure Interval
settings.
Note: Pulse Measure
Interval has to be in
the range: 500mS @
MI @ 60000 mS.
Argument1 = F:
Display/Change NR
Filter Parameters: NRF
Sample Number
[1-32] NRF Time Limit
[0-32] NRF Error Limit
[0.0-100.0%]
20
PW V
Read/Change Meter
Vortex Frequency Source
0 - Automatic
1 - Pulse Counts
2 - PWM
3 – FFT
4 - AWD PWM
<New Source>
0-4
PWV:<value>
Example: PWV:0
No Argument
(Returns Current Vortex
Frequency source settings)
PWV:<value>
Example: PWV:0
I
Pulse Measure Interval
<new value> in mS [500-60000] PWI:<value> Example: PWI:2000
No Argument (Returns Current set.)
PWI:<value> Example: PWI:2000
D
Flow NRF Damping
[0-99 sec.]
<new value>
in sec. [0-99]
PWD:<value>
Example: PWD:1
No Argument (Returns Current set.) PWD:<value> Example: PWD:1
F
NRFilter Parameters:
NRF Sample Numb.
NRF Time Limit
NRF Error Limit
<new value>
[1-32]
<new val.>
[0-32]
<new val.>
[0.0-100%]
Example:
PWF:4,8,0.0
No Argument
(Returns Current set.)
Example:
PWF:4,8,0.0
W
Turbulence Flow
Window
0 - Disabled
<new value> [0-99]
PWW:<value>
Example: PWW:0
No Argument
(Ret. Current settings)
PWW:<value>
Example: PWW:0
L
Flow Meter Linearizer
E - Enable
D - Disable
<New Value>
E or D
PWL:<value>
Example: PWL:E
No Argument
(Ret. Current settings)
PWL:<value>
Example: PWL:E
Page 99

94
COMMAND
NAME
DESCRIPTION
NO.
COMMAND SYNTAX
COMMAND ARGUMENT 1
ARGUMENT 2
ARGUMENT 3
ARGUMENT 4 RESPONSE
FFT DSP
Settings
Sets/Reads FFT DSP
related variables.
FFT Sample/Second:
0 – Automatic
1 – 8000 samples/sec
2 – 4000 samples/sec
3 – 2000 samples/sec
4 – 1000 samples/sec
5 – 500 samples/sec
21
FT
M
FFT Algorithm Mode:
E- Enable
D- Disable
<New Value>
E or D
FTM:<value>
Example: FTM:E
No Argument
(Ret. Current settings)
FTM:<value>
Example: FTM:E
T
FFT Trigger Level:
0 – Auto
[1-4095] - Manual
<new value>
[0-4095]
FTT:<value>
Example: FTT:60
No Argument
(Ret. Current settings)
FTT:<value>
Example: FTT:60
S
FFT Sample/Second
(manufacture only, do
not change*)
<new value>
[0-5]
FTS:<value>
Example: FTS:1
No Argument
(Ret. Current settings)
FTS:<value>,<SF>
Example: FTS:1,1000
D
FFT Damping
(manufacture only, do
not change*)
<New Value>
E or D
FTD:<value>
Example: FTF:D
No Argument
(Ret. Current settings)
FTD:<value>
Example: FTF:D
N
FFT Minimum Noise
Threshold for Auto
(manufacture only, do
not change*)
<new value>
[0-5000]
FTN:<value>
Example: FTN:500
No Argument
(Ret. Current settings)
FTN:<value>
Example: FTN:500
A
Attenuation Mode and
Target Level
<value>
A or M
<value>
[0-4095]
FTA:<value>,<value>
Example: FTA:M,1000
No Argument
(Ret. Current settings)
FTA:<value>,<value>
Example: FTA:M,1000
Page 100

95
COMMAND
NAME
DESCRIPTION
NO.
COMMAND SYNTAX
COMMAND
ARGUMENT 1 ARGUMENT 2
ARGUMENT 3 ARGUMENT 4 RESPONSE
4-20mA
Analog
Output
Settings
Sets/Reads Analog Outputs assignment,
4mA and 20mA Values. NOTE: 4mA and
20mA values have to be entered in
corresponding to Argument 2 type EU
(for Volum. in %FS). 0 - Disabled.
1-Volum. Flow: Current active
volumetric flow EU. 2-Mass Flow:
Current active volumetric flow EU.
3-Temperature: deg. C 4-Pressure: Pa.
22 AO <Value>
Channel: 1 or
2
<Value> Mode: [0-4]
0 - Disabled
1-Vol. Flow
2-Mass Flow
3-Temp.**
4-Pressure**
<Value>
4mA value
(in EU related
to Mode
value)
<Value>
20mA value
(in EU related
to Mode
value)
Ch1
AO1:0,0,100
Ch2
AO2:2,0.0,26.0
No Argument (Ret.
Current settings. For
Volum. Flow in %FS)
Ch1. AO1:1,0.0,1000.0
Ch2. AO2:2,0.0,26.0
Data Log Reads Data Log entries, Sets
Mode and Configuration of
the data logger. Argument 1 = C
DL Configuration (Argument2):
0 – Loop Enabled
1 – Loop Disabled
2 – Loop Disabled,
number of samples to record DL
Configuration (Argument3): Number of
samples: [1-15871] (has to be
submitted for all options, but only
applicable for Argument 2 value 2).
Argument 1 = V. Process Variable:
0-Volumetric Flow 1-Mass Flow
2-Temperature**. 3-Pressure**
Argument 1 = T
0 – Unconditional
1 – PV Alarm High Event
2 – PV Alarm Low Event
23 DL M
Mode:
E – DL Enable
D – DL Disable
<Value>
E or D
DLM:<value>
Example: DLM:E
No Argument (Ret.
Current settings)
DLM:<value>
Example: DLM:E
C
Configuration
<Value> [0-2]
<Value>
: [1-15871]
DLC:<value>,<value>
Example: DLC:0,1024
No Argument (Ret.
Current settings)
DLC:<value>,<value>
Example: DLC:0,1024
V
Process
Variable
<Value> [0-3]
DLV:<value> Example: DLV:0
No Argument (Ret.
Current settings)
DLV:<value>
Example: DLV:0
I
Sample
Interval in sec.
<Value> [1-3600]
DLI:<value> Example: DLI:1
(Ret. Current
settings)
DLI:<value> Example: DLI:1
T
DL Start/Stop
conditions
Thresholds
<Value>
Start Cond[0-2]
<Value>
Stop: [0-2]
DLT:<value>,<value>
Example: DLT:0,0
(Ret. Current
settings)
DLT:<value>,<value>
Example: DLT:0,0
 Loading...