

Page 1
OPERATING MANUAL
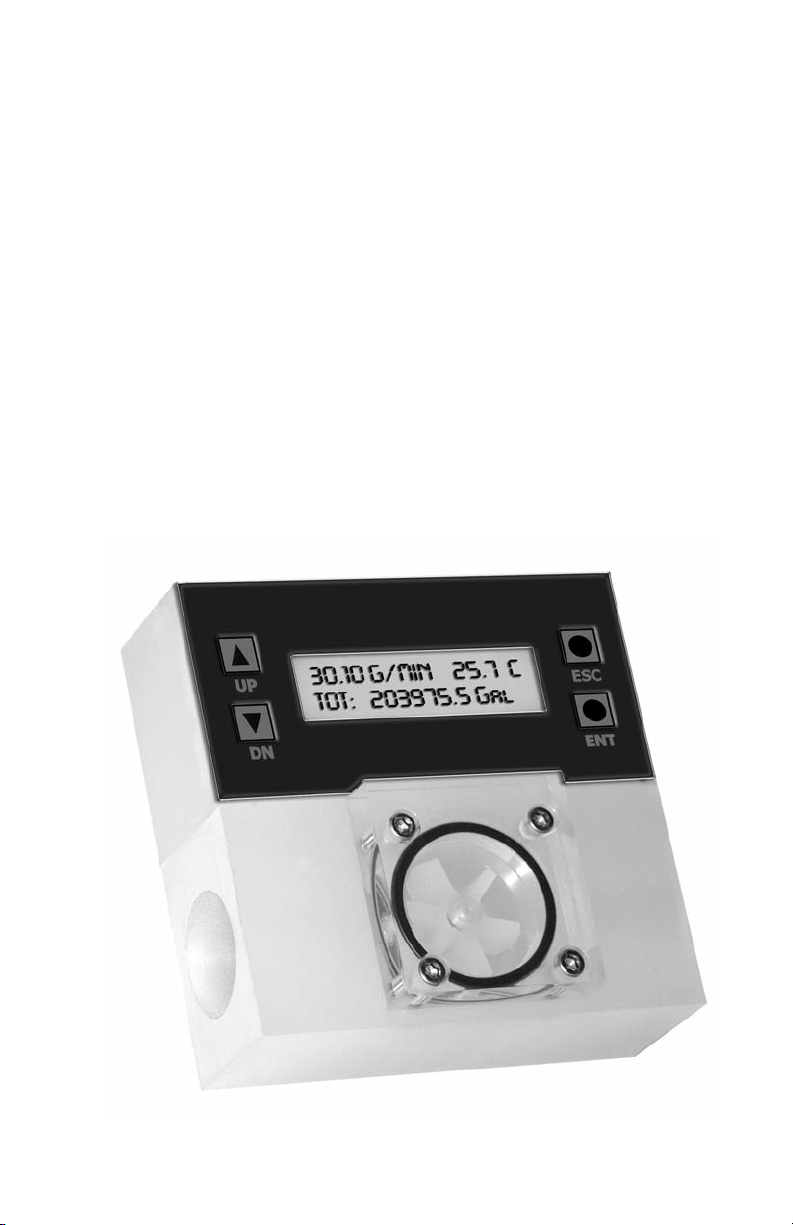
PWE
Digital Paddle Wheel
Flow Meter
Technical Data Sheet No.: TD-10-09-118M
Date of Issue: October 2009
Page 2

Aalborg7is a registered trademark of Aalborg Instruments & Controls.
NOTE: Aalborg reserves the right to change designs and dimensions at its sole
discretion at any time without notice. For certified dimensions please contact Aalborg7.
Page 3

TABLE OF CONTENTS
1. UNPACKING THE PWE FLOW METER..........................................
1.1 Inspect Package for External Damage........................................................
1.2 Unpack the PWE meter..............................................................................
1.3 Returning Merchandise for Repair..............................................................
2. PWE FLOW METERS TECHNICAL DATA..........................................
2.1 Principles of Operation...............................................................................
2.2 Electrical Connections................................................................................
2.2.1 Power Supply Connections........................................................................
2.2.2 Analog Output Signals Connections.............................................................
2.2.3 Flow Sensor Pulse Output Signals Connections........................................
2.2.4 Programmable optically isolated Output Signals Connections....................
2.2.5 Communication Parameters and Connections.............................................
2.3 PWE Flow Meter Specification....................................................................
2.4 PWE Maintenance.........................................................................................
2.4.1 Sensors.......................................................................................................
2.4.2 PWE Paddle Wheel Disassembly................................................................
3. LCD KEYPAD OPERATION: DATA ENTRY AND CONFIGURATION...........
3.1 Display Indications (applicable for LCD options only)................................
3.1.1 PWE with RTD option Process Information Screens..................................
3.1.2 PWE without RTD option Process Information Screens.............................
3.2 Menu Sequence............................................................................................
3.3 Parameter Summary and Data Entry.............................................................
4. PARAMETER ENTRY...............................................................
4.1 Submenu Program protection...................................................................
4.2 Submenu Flow Meter Info...........................................................................
4.2.1 Full Scale Flow..............................................................................................
4.2.2 Communication Interface............................................................................
4.2.3 RTD hardware option..................................................................................
4.2.4 Analog Flow Output settings.......................................................................
4.2.5 Analog Temperature Output settings...........................................................
4.2.6 Flow Meter EEPROM data base version.....................................................
4.2.7 Flow Meter Firmware version.......................................................................
4.2.8 Flow Meter Serial number.............................................................................
4.2.9 Flow Meter Model number..........................................................................
4.2.10 Fluid Name.................................................................................................
4.2.11 Flow Meter Calibration Date........................................................................
4.2.12 Flow Meter Calibration Date Due..................................................................
4.2.13 Flow Meter User Tag Name.........................................................................
1
1
1
1
1
1
2
3
3
4
5
6
7
9
9
9
11
11
12
14
15
17
25
25
26
26
26
27
27
27
28
28
28
28
29
29
29
29
Page 4

4.3 Submenu Measuring Units........................................................................
4.3.1 User Defined Measuring Unit......................................................................
4.3.1.a User Defined Unit Factor Numeric entry......................................................
4.3.1.b User Defined Unit Time Base Tabular entry................................................
4.3.1.c User Defined Unit Density support Tabular entry.....................................
4.4 Submenu Flow Alarm.................................................................................
4.4.1 Flow Alarm Mode Tabular entry................................................................
4.4.2 Low Flow Alarm Numerical entry..............................................................
4.4.3 High Flow Alarm Numerical entry..............................................................
4.4.4 Flow Alarm Action Delay Numerical entry...................................................
4.4.5 Flow Alarm Action Latch Tabular entry.....................................................
4.5 Submenu Temperature Alarm (*optional)...................................................
4.5.1 Temperature Alarm Mode Tabular entry...................................................
4.5.2 Low Temperature Alarm Numerical entry...................................................
4.5.3 High Temperature Alarm Numerical entry...................................................
4.5.4 Temperature Alarm Action Delay Numerical entry.....................................
4.5.5 Temperature Alarm Action Latch Tabular entry.........................................
4.6 Submenu Main Totalizer..............................................................................
4.6.1 Main Totalizer Mode Tabular entry............................................................
4.6.2 Main Totalizer Flow Start Numerical entry................................................
4.6.3 Main Totalizer Event Volume Numerical entry..........................................
4.6.4 Main Totalizer Reset Tabular entry............................................................
4.7 Submenu Pilot Totalizer............................................................................
4.7.1 Pilot Totalizer Mode Tabular entry..............................................................
4.7.2 Pilot Totalizer Flow Start Numerical entry..................................................
4.7.3 Pilot Totalizer Event Volume Numerical entry.............................................
4.7.4 Pilot Totalizer Reset Tabular entry.............................................................
4.8 Submenu Optical Outputs Numerical entry..................................................
4.9 Submenu Flow Meter Configuration.........................................................
4.9.1 Submenu Flow Meter Low Flow Cut–off Numerical entry........................
4.9.2 Submenu Pulse Number Measure Interval Numerical entry........................
4.9.3 Submenu Flow Meter Calibration Factor Numerical entry........................
4.9.4 Submenu Flow Meter Measure Mode Tabular entry.................................
4.9.5 Submenu Noise Reduction Filter Damping Time Numerical entry............
4.9.6 Submenu Noise Reduction Filter Sample Number Numerical entry............
4.9.7 Submenu Flow Linearizer Tabular entry....................................................
4.9.8 Submenu Fluid Density Numerical entry...................................................
4.9.9 Submenu Pilot Calibration timer Tabular entry...........................................
4.10 Submenu LCD Back Light Numerical Entry...............................................
4.11 Submenu Alarm Events Log....................................................................
4.11.1 Submenu Alarm Events Log Status...........................................................
4.11.2 Submenu Alarm Events List......................................................................
4.11.3 Submenu Alarm Events Log Mask...........................................................
4.12 Submenu Diagnostic...................................................................................
30
32
32
32
33
33
33
34
34
35
35
36
36
36
37
38
38
39
39
40
40
40
41
41
42
42
42
43
44
44
44
45
45
46
46
47
47
47
48
48
50
51
51
51
Page 5

4.12.1 Submenu Raw Pulses Count.....................................................................
4.12.2 Submenu Pulse Frequency.........................................................................
4.12.3 Submenu Raw RTD reading (RTD option only)........................................
4.12.4 Submenu DAC_A Flow Output..................................................................
4.12.5 Submenu DAC_B Temperature Output....................................................
4.12.6 Submenu CPU Temperature........................................................................
4.12.7 Submenu Raw VCC Reading....................................................................
5. ANALOG OUTPUT SIGNALS.....................................................
5.1 Analog Output Signals configuration........................................................
5.2 Analog Output Signals calibration............................................................
5.2.1 Initial Setup...............................................................................................
5.2.2 Flow 0-5 Vdc analog output calibration....................................................
5.2.3 Flow 4-20 mA analog output calibration....................................................
5.2.4 Temperature 0-5 Vdc analog output calibration*......................................
5.2.5 Temperature 4-20 mA analog output calibration*....................................
6. PWE FLOW CALIBRATION PROCEDURES.....................................
6.1 Connections and Initial Warm Up.............................................................
6.2 Flow Meter Span Calibration....................................................................
6.3 Flow Meter Linearization Table Calibration..................................................
7. RS-485/RS-232 SOFTWARE INTERFACE COMMANDS.....................
7.1 General.......................................................................................................
7.2 Commands Structure................................................................................
7.3 ASCII Commands Set..............................................................................
8. TROUBLESHOOTING...............................................................
8.1 Common Conditions.................................................................................
APPENDIX I
PWE EEPROM Variables.................................................
APPENDIX II Component Diagram Top Side......................................
Component Diagram Bottom Side..................................
APPENDIX III Dimensional Drawing................................................
APPENDIX IV Warranty................................................................
52
52
52
52
53
53
53
53
53
54
55
56
56
57
57
58
58
59
59
61
61
61
63
71
71
73
76
76
77
78
Page 6

1. UNPACKING THE PWE
1.1 Inspect Package for External Damage
Your PWE Paddle Wheel Meter was carefully packed in a sturdy cardboard carton,
with antistatic cushioning materials to withstand shipping shock. Upon receipt,
inspect the package for possible external damage. In case of external damage to
the package contact the shipping company immediately.
1.2 Unpack the PWE meter
Open the carton carefully from the top and inspect for any sign of concealed shipping damage. In addition to contacting the shipping carrier please forward a copy
of any damage report to your distributor or Aalborg
®
directly. When unpacking the
instrument please make sure that you have all the items indicated on the Packing
List. Please report any shortages promptly.
1.3 Returning Merchandise for Repair
Please contact the customer service representative of your distributor or Aalborg
®
if you purchased your PWE Meter directly, and request a Return Authorization
Number (RAN). Equipment returned without an RAN will not be accepted.
Aalborg
®
reserves the right to charge a fee to the customer for equipment returned
under warranty claims if the instruments are tested to be free from warranted
defects. Shipping charges are borne by the customer. Items returned "collect" will
not be accepted! It is mandatory that any equipment returned for servicing be
purged and neutralized of any dangerous contents including but not limited to
toxic, bacterially infectious, corrosive or radioactive substances. No work shall be
performed on a returned product unless the customer submits a fully executed,
signed SAFETY CERTIFICATE. Please request form from the Service Manager.
2. PWE FLOW METERS TECHNICAL DATA
2.1 Principles of Operation
PWE liquid flow meters consist of a meter body that is installed in-line in a conduit system. Inside, between the inlet and the outlet connections is a rotary wheel
with permanent magnets embedded at 180 degrees in paddles.
Fluid flowing through the meter causes the paddle to spin. A magnetic sensor
picks up the frequency of pulses, and the readings are proportional to the liquid
flow taking place. The number of pulses per unit time interval and a K-factor (pulses/unit of flow) facilitate determining the volumetric rate of flow through the
meter.
1
Page 7
Additionally, the PWE Flow Meter incorporates a Microcontroller driven circuitry
and non-volatile memory that stores all hardware specific variables. The flow rate
can be displayed in 29 different volumetric or mass flow engineering units. Flow
meter parameters and functions can be programmed remotely via the RS-232/RS485 interface or locally via optional LCD/KeyPad. PWE flow meters support various functions including: two programmable flow totalizers, low, high or range flow
and temperature* alarms, 2 programmable optically isolated outputs, 0-5 Vdc / 420 mA analog outputs (jumper selectable) for each process (flow and temperature*) variable, self diagnostic alarm. Optional local 2x16 LCD* readout with
adjustable back light provides flow rate, temperature*, total volume reading in currently selected engineering units, diagnostic events indication and feature a password protected access to the process parameters to ensure against tampering or
resetting.
2.2 Electrical Connections
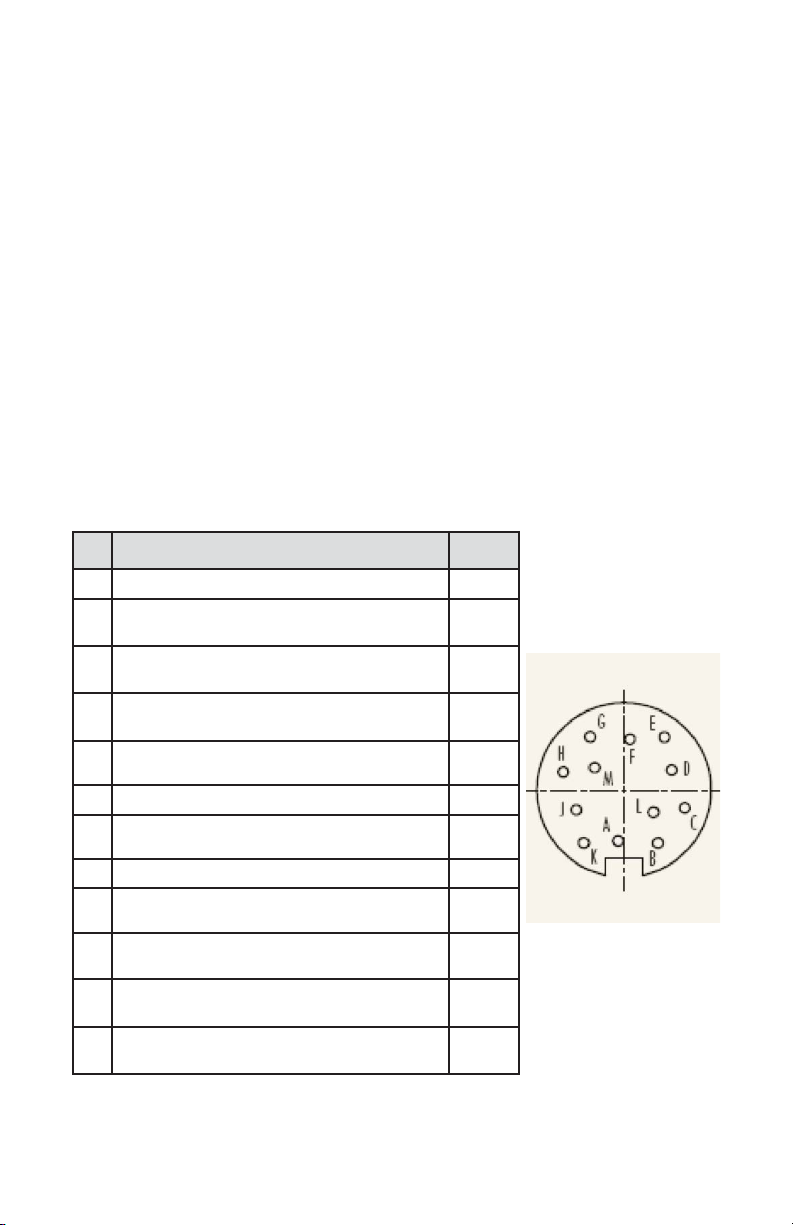
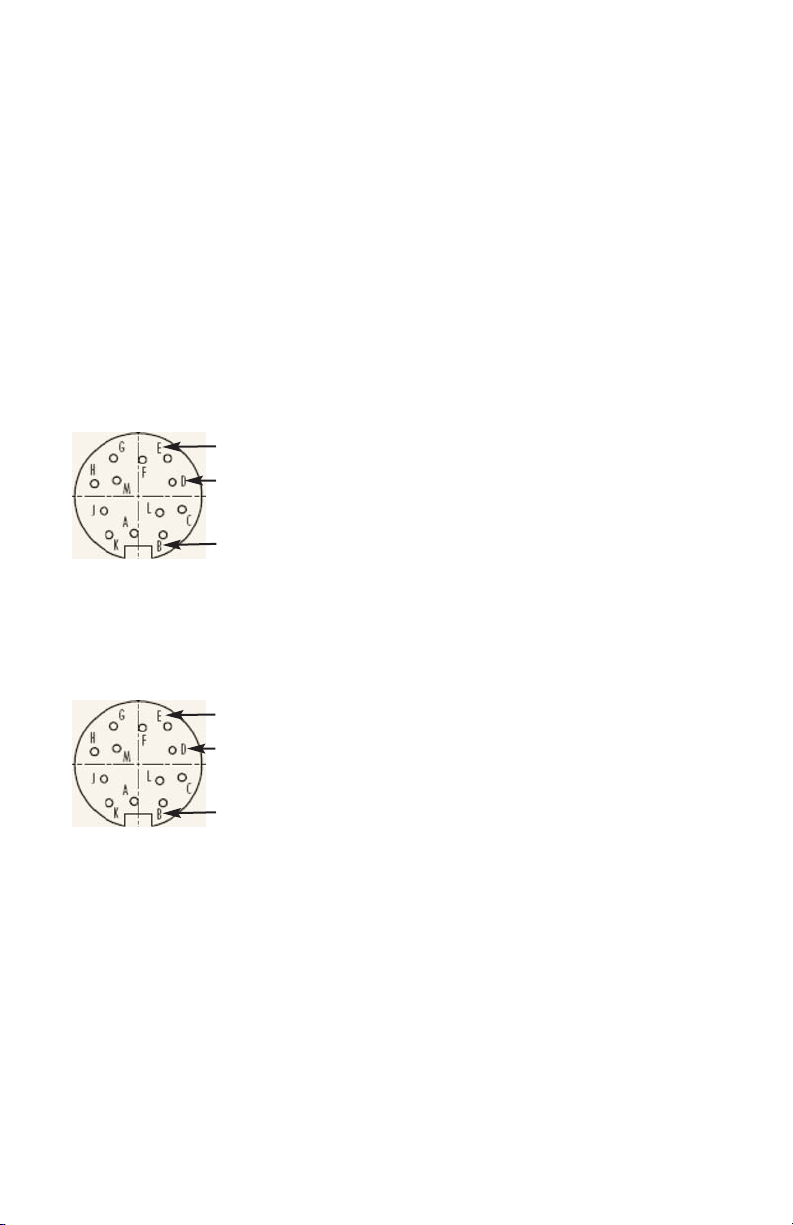
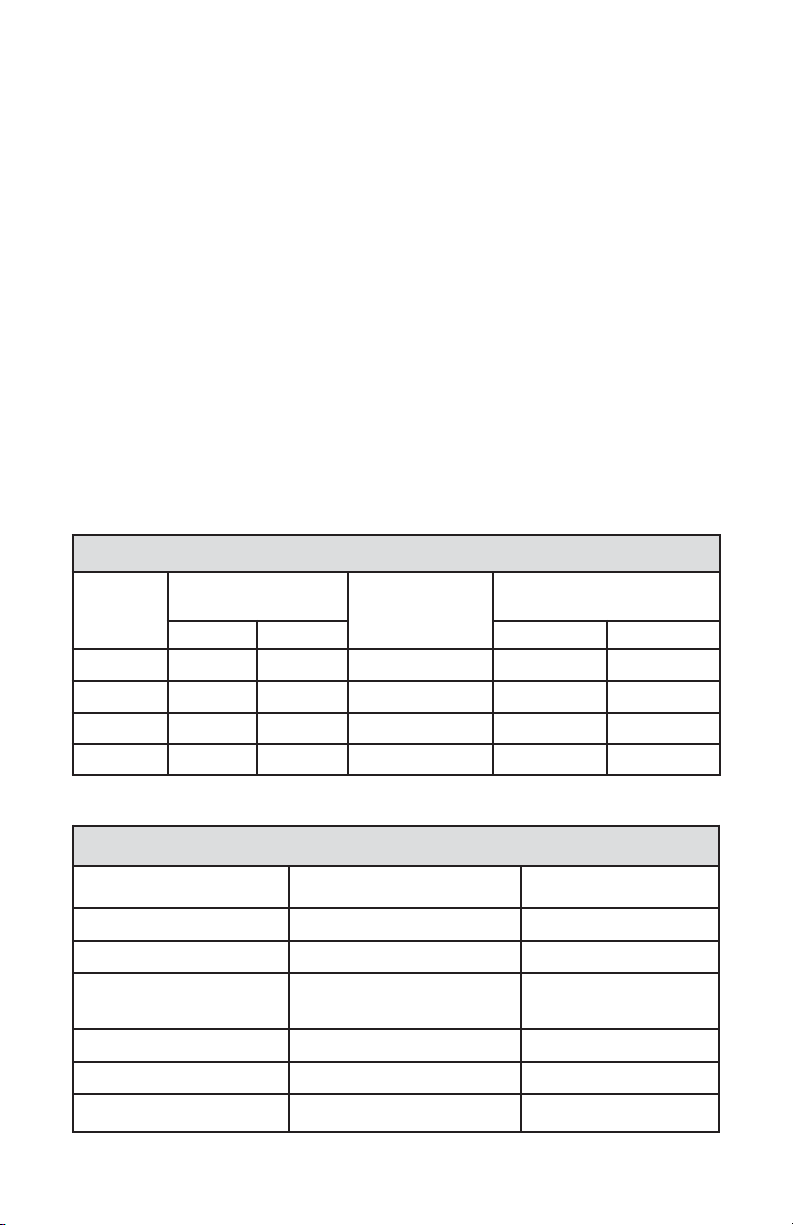
PWE flow meter is supplied with “M16” cylindrical 12 pin connector. Pin diagram
is presented in figure b-1.
Figure b-1, PWE 12 Pin "M16" Connector Configuration
PIN PWE FUNCTION TYPE
A Plus Power Supply (+ DC power 11 to 26 Vdc) +Power
B
Common Power Supply, (DC power 11 to 26 Vdc),
Digital Common
-Power,
Common
C
Flow Sensor Pulse Output (active), 3.3Vdc 3K min.
load impedance
Output
Only
D
Digital Communication interface, RS485 (-)
(Optional RS232 TX)
Input
/Output
E
Digital Communication interface, RS485 (+)
(Optional RS232 RX)
Input
/Output
F Optical Output No.1 Plus (+) (passive) Input
G
Optical Output No.1 Minus (-) (passive)
Return
for Pin F
H Optical Output No.2 Plus (+) (passive) Input
J Optical Output No.2 Minus (-) (passive)
Return
for Pin H
K
Common, Analog Signal Ground For Pins L & M,
(4-20 mA return)
Signal
Common
L
Temp. Analog Output Plus (+) 0-5 Vdc or 4-20 mA,
jmp. selectable
Output
Only
M
Flow Analog Output Plus (+), 0-5 Vdc or 4-20 mA,
jmp. selectable
Output
Only
2
Page 8

2.2.1 Power Supply Connections
The power supply requirements for PWE flow meter are: 11 to 26 Vdc 100 mV
maximum peak to peak output noise, (unipolar power supply).
Pin A ------------- DC Power (+)
Pin B ------------- DC Power (-)
The (+) and (-) power inputs are each protected by a 300mA M (medium time-lag)
resettable fuse. If a shorting condition or polarity reversal occurs, the fuse will cut
power to the flow transducer circuit. Disconnect the power to the unit, remove
the faulty condition, and reconnect the power. The fuse will reset once the faulty
condition has been removed.
Use of the PWE flow meter in a manner other than that specified in this manual or
in writing from Aalborg
®
, may impair the protection provided by the equipment.
2.2.2 Analog Output Signals Connections
PWE series Flow Meters are equipped with either calibrated 0-5 or calibrated 4-20
mA output signals (jumper selectable). This linear output signal represents
0-100% of the flow meter’s full scale range.
CAUTION: Do not apply power voltage above 26Vdc.
Doing so will cause PWE damage or faulty operation.
3
Make sure power is OFF when connecting or disconnecting any cables
in the system.
CAUTION: When connecting the load to the output terminals, do not
exceed the rated values shown in the specifications. Failure to do so
might cause damage to this device. Be sure to check if the wiring and
the polarity of the power supply is correct before turning the power
ON. Wiring error may cause damage or faulty operation.
WARNING: The 4-20 mA current loop output is self-powered (sourcing
type, non-isolated). Do NOT connect an external voltage source to the
output signals.
Page 9
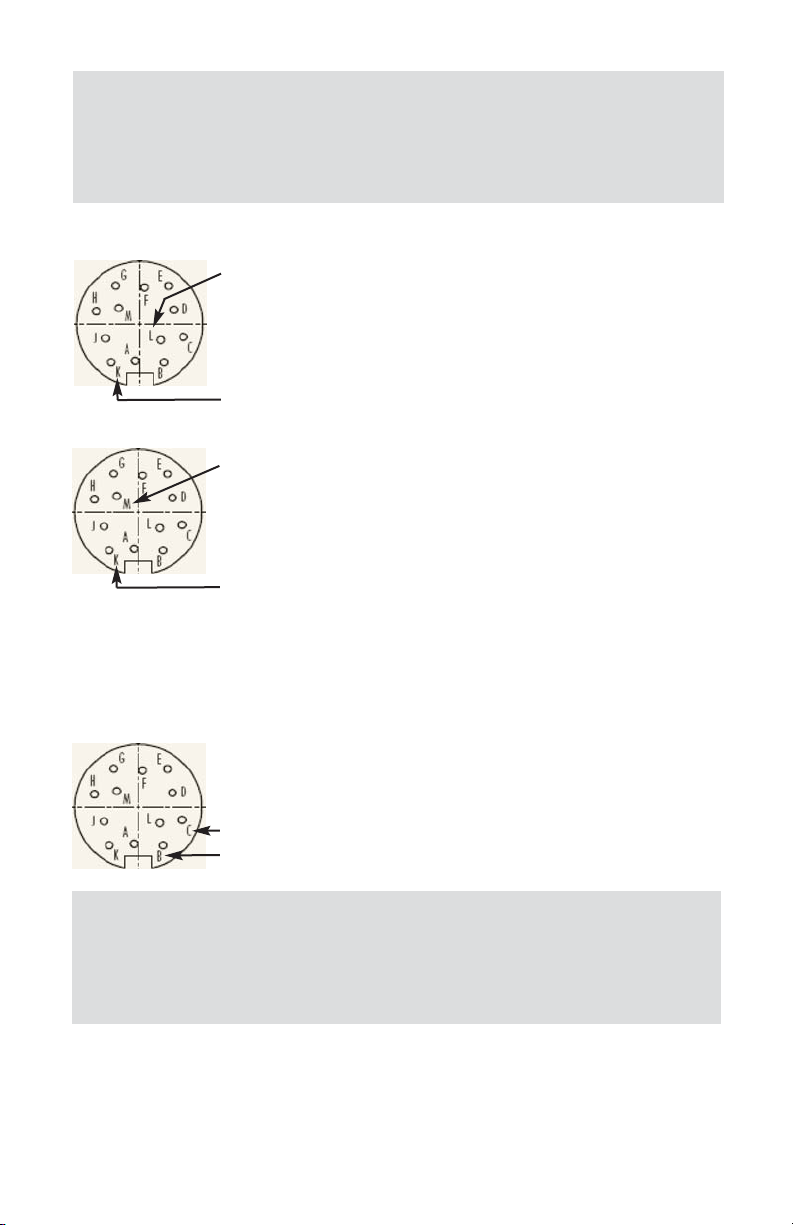
Flow 0-5 VDC or 4-20 mA output signal connection:
Pin M ------------ (+) Plus Flow Analog Output
Pin K ------------ (-) Minus Flow Analog Output
Temperature 0-5 VDC or 4-20 mA output signal connection (optional):
Pin L ------------ (+) Plus Temperature Analog Output
Pin K ------------ (-) Minus Temperature Analog Output
To eliminate the possibility of noise interference, use a separate cable entry for
the DC power and analog signal lines (pins L, M, K on “M16” connector).
2.2.3 Flow Sensor Pulse Output Signals
Connections
Pin C ------------ (+) Flow Sensor Pulse Output (active), 3.3Vdc
Pin B ------------ DC Power (-), Digital Common
4
WARNING: Observe jumper configuration before connecting 4-20 mA
current loop load. Failure to make proper jumper configuration (see
Figure 5-1) may cause damage for output circuitry.
Do NOT connect an external voltage source to the output signals.
WARNING: The flow sensor pulse output is self-powered (open drain,
pulled up with 10K resistor to internal 3.3Vdc rail).
Do NOT connect an external voltage source to the pulse output signals.
Use load with input impedance more than 30K is recommended.
Page 10
5
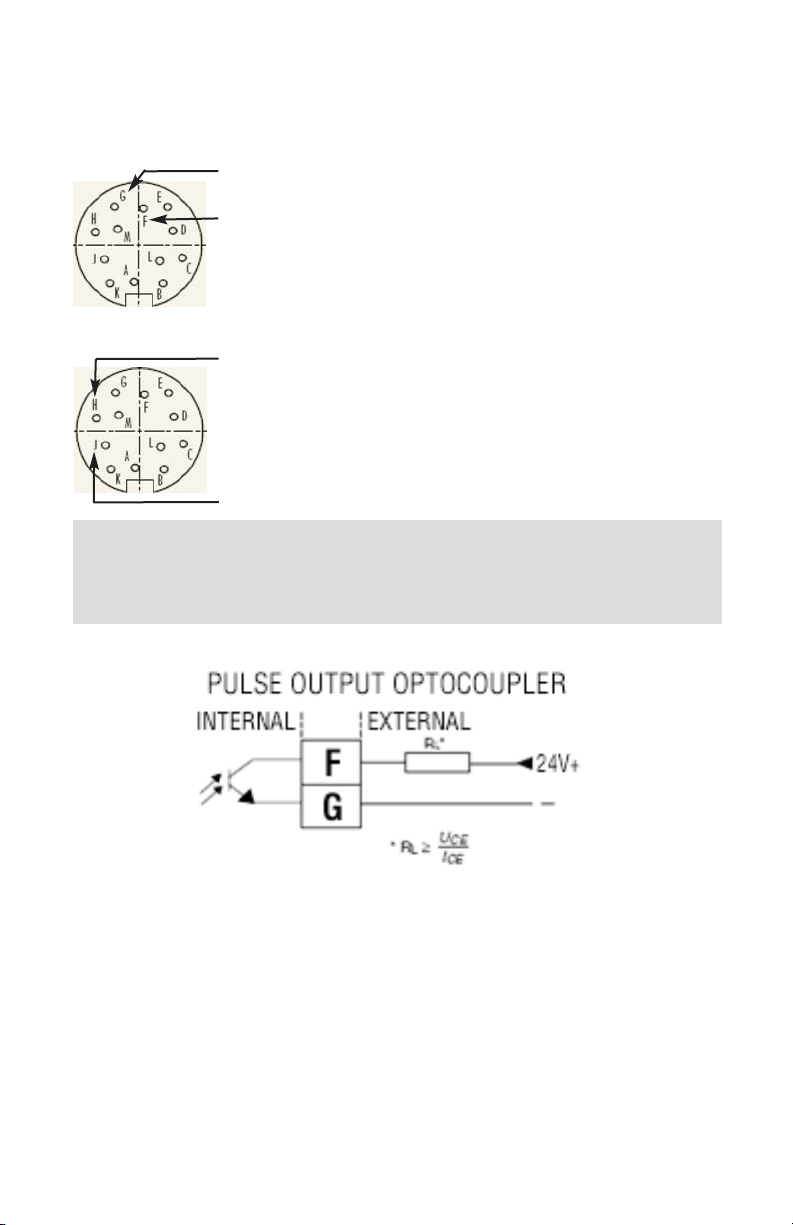
2.2.4 Programmable optically isolated Output
Signals Connections
Optocoupler #1 (pins F and G):
Pin F ------------ Plus (+) (passive)
Pin G ------------ Plus (-) (passive)
Optocoupler #2 (pins H and J):
Pin H ------------ Plus (+) (passive)
Pin J ------------ Plus (-) (passive)
2.2.5 Communication Parameters and Connections
The digital interface operates via RS485 (optional RS-232) and provides access to
applicable internal data including: flow, temperature, totalizers and alarm settings,
flow linearizer table, fluid density and engineering units selection.
WARNING: Optically isolated outputs require application of DC voltage
across terminals. Do not exceed maximum allowed limits for voltage
and current provided below:
Page 11
6
Communication Settings for RS-485/RS-232 communication interface:
Baud rate: ------------ 9600 baud
Stop bit: ------------ 1
Data bits: ------------ 8
Parity: ------------ None
Flow Control: ------------ None
RS-485 communication interface connection:
The RS485 converter/adapter must be configured for: multidrop, 2 wire, half duplex
mode. The transmitter circuit must be enabled by TD or RTS (depending on which
is available on the converter/adapter). Settings for the receiver circuit should follow
the selection made for the transmitter circuit in order to eliminate echo.
Pin D ------------ RS-485 T(-) or R(-)
Pin E ------------ RS-485 T(+) or R(+)
Pin B ------------ RS-485 GND (if available)
RS-232 communication interface connection:
Crossover connection has to be established:
Pin D ------------ RS-232 RX (pin 2 on the DB9 connector)
Pin E ------------ RS-232 TX (pin 3 on the DB9 connector)
Pin B ------------ RS-232 SIGNAL GND
(pin 5 on the DB9 connector)
Page 12

7
2.3 PWE Flow Meter Specification
FLOW MEDIUM: Please note that PWE Flow Meters are designed to work only
with liquids. Never try to measure flow rates of dry gas.
CALIBRATIONS: Performed at standard conditions [14.7 psia (101.4 kPa) and
70 °F (21.1 °C)] unless otherwise requested or stated.
VISCOSITY: Calibrated to 1 cPoise (water). Meters can be used for fluids up to
50 cPoise with field calibration (maximum flow range may be affected).
ENVIRONMENTAL (PER IEC 664): Installation Level II; Pollution Degree II.
FLOW ACCURACY (INCLUDING LINEARITY): ±1% of FS.
REPEATABILITY: ±0.25% of full scale.
TEMPERATURE ACCURACY (INCLUDING LINEARITY)*: ±0.5 °C.
FLOW RESPONSE TIME: Approximately 1 seconds (above 10% of full scale
flow), approximately 2 seconds (below 10% of full scale flow).
MAXIMUM PRESSURE: 10 bar (150 psi).
MAXIMUM PRESSURE DROP: See Table 2.3.1 for pressure drops associated
with various models and flow rates.
FLUID AND AMBIENT TEMPERATURE: 14 °F to 140 °F (-10 °C to 60 °C).
OUTPUT SIGNALS: Linear 0-5 Vdc (3000 ohms min load impedance);
Linear 4-20 mA (500 ohms maximum loop resistance).
Maximum noise 20mV peak to peak (for 0-5 Vdc output).
Flow Pulse Output: 3.3 Vdc amplitude (3000 ohms min load impedance).
OPTICALLY ISOLATED OUTPUTS: UCE 40Vdc, ICE 150 mA.
FLOW METER INPUT POWER: 11 to 26 Vdc, 100 mV maximum peak to peak
output noise. Power consumption: +12Vdc (150 mA maximum);
+24Vdc (100 mA maximum); Circuit board have built-in polarity reversal
protection, 300mA resettable fuse provide power input protection.
Page 13
COMMUNICATIONS PARAMETERS (RS-232/RS-485):
Baud rate: ...................... 9600 baud
Stop bit: ...................... 1
Data bits: ...................... 8
Parity: ...................... None
Flow Control: ...................... None
DISPLAY*: Optional local 2x16 characters LCD with adjustable backlight (2 lines of text).
KEY PAD*: Optional 4 push button key pad.
CE COMPLIANCE: EMC Compliance with 89/336/EEC as amended.
Emission Standard: EN 55011:1991, Group 1, Class A
Immunity Standard: EN 55082-1:1992
(* - optional feature)
Table 2.3.1 PWE Flow Meter Flow Ranges and Pressure Drop
Table 2.3.2 PWE Flow Meter wetted materials
8
FLOW RATE FOR PWE
METER
SIZES
FLOW RATE H20
INLET/OUTLET
PORTS FEMALE
NPT
MAXIMUM PRESSURE DROP
[L/min] Gal/min Bar PSI
PWE4 0.15-18.9 0.04-5 3/8" 1 15
PWE6 0.3-37.6 0.08-10 1/2" 1.4 20
PWE8 0.6-64.4 0.15-17 3/4" 1.4 20
PWE10 1.3-132.5 0.35-35 1" 1.4 20
WETTED MATERIALS
POLYPROPYLENE MODELS PVDF MODELS
BODY Polypropylene PVDF
LID Acrylic PVDF
PADDLE WHEEL
PVDF
Nickel Tungsten Carbide
PVDF
Zirconia Ceramic
BEARINGS Sapphire Jewels Sapphire Jewels
O-RINGS EPDM PTFE
PLATINUM RTD 316 stainless steel casing 316 stainless steel casing
Page 14

9
2.4 PWE MAINTENANCE
CAUTION: Some of the IC devices used in the flow meter signal
conditioning circuitry are static sensitive and may be damaged by
improper handling. When adjusting or servicing the signal converter,
use of a grounded wrist strap is recommended to prevent inadvertent
damage to the integral solid state circuitry. The flow meter signal
conditioning circuitry uses complex electronic circuit components.
Generally, due to the complexity of troubleshooting integrated circuit
devices, maintenance beyond the PCB assembly level is not
recommended. Also, caution must be used when connecting test
probes, as even a momentary accidental short circuit may damage or
destroy an integrated circuit device.
CAUTION: Never use compressed air or gases to test the meter,
as this would damage the Bearings.
2.4.1 Sensors
In rare instances, due to electrical damage, the pulse sensor or RTD need to be
replaced by disconnecting the signal cable connector from the PCB and unscrewing it and installing a replacement. This procedure can be done only by factory
authorized personel.
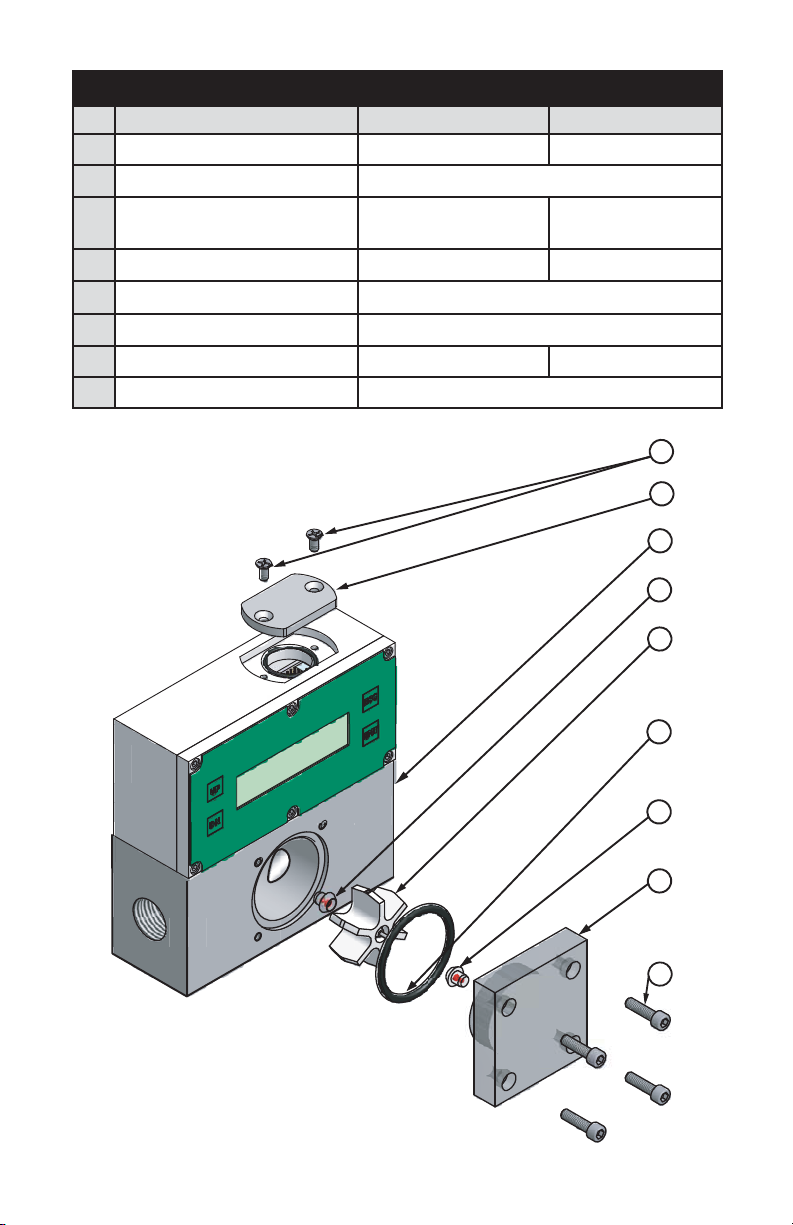
2.4.2 PWE Paddle Wheel and Bearings Replacement
To replace the paddle wheel, disconnect the meter from electrical and liquid lines.
Unscrew 4 screws that hold the lid in place. Remove the lid by lifting it up and
move the wheel out. The Wheel’s embedded shaft is supported at each end by sapphire bearings to minimize friction and facilitate very low flow rate measurements
(see Figure 2-1). Reassembly is made ensuring that the shaft end is inserted gently into the bottom bearing. Check to see if the wheel is free to spin before the lid
is installed. Gently put the lid over the opening and gently spin it by hand until the
upper bearing, installed in the lid, drops into the place. Hold the lid down and
check for free spinning by lightly blowing into the port; or lightly shake and listen
if both shaft ends got into the bearings. Make sure the O-ring is in its seat, insert
four cap screws and gradually tighten them. Bearings are made of sapphire, which
rarely needs replacement, unless they were physically shattered. Bearings highly
susceptible to careless disassembly and reassembly practices. While the unit is
disassembled for paddle wheel replacement, bearing could be replaced with bearing removal tool.
Page 15
10
1
4
2
3
2
7
6
5
8
NOTE: Platinum RTD is not shown.
PARTS LIST
PARTS PWEP MATERIALS PWET MATERIALS
1 LOWER BLOCK POLYPROPYLENE PVDF
2 JEWEL BEARING (2 required) PVDF SAPPHIRE
3 PADDLE WHEEL
PVDF & NICKEL
TUNGSTEN CARBIDE
PVDF &
ZIRCONIA CERAMIC
4 LID ACRYLIC PVDF
5 JUMPER COMPARTMENT PLUG POLYPROPYLENE
6 SCREW 8-32 (4 required) STAINLESS STEEL
7 O-RING EPDM PTFE
8 SCREW 6-32 STAINLESS STEEL
Figure 2-1 PWE assembly presentation drawing
Page 16

11
3. LCD KEYPAD OPERATION: DATA ENTRY AND
CONFIGURATION
(applicable for LCD options only)
3.1 Display Indications
Initially, after the power is first turned on, the flow meter model number is shown
in the first line of the display and the revisions for EPROM table and firmware in
the second line. Subsequently the actual process information is displayed. The
instantaneous flow rate is displayed on the first line in percent or in direct
reading units with flow alarm status indication. For flow meters without RTD
option, the main totalizer value, up to 9 digits (including decimal), is displayed in
the second line with its corresponding units.
For flow meters with RTD option, the temperature reading value in deg C, is displayed in the second line with temperature alarm status indication. This display is
designated as process information (PI) screen throughout the remainder of this
manual.
The temperature value (applicable for RTD option only) in deg F can be displayed
in the PI screen by pressing the ENT pushbutton. The temperature indication can
be switched from deg C to deg F and back by pressing ENT pushbutton.
Figure 3.1: PWE first Banner Screen
Figure 3.2: PWE with RTD option initial Process Information Screen
AALBORG PW METER
Fw: A001 Tbl: A001
5.001 Gl/min AD
20.1 C TA: D
Note: Actual content of the LCD screen may vary depending on the
model and device configuration.
,
Page 17

12
Figure 3.3: PWE without RTD option initial Process Information Screen
Based on flow meter configuration (with or without RTD option), different parameters may be displayed in the PI screen by pressing the UP or DN pushbuttons.
3.1.1 PWE with RTD option Process Information
Screens
Pressing UP and DN buttons from initial PI screen will switch display as following:
[Initial PI screen]
Action: Keypad UP
i
Figure 3.4: PWE with RTD option Process Information Screen with Main Totalizer
Action: Keypad UP
i
Figure 3.5: PWE with RTD option Process Information Screen with Pilot Totalizer
5.001 Gl/min AD
MT: 60639.38 Gal
5.001 Gl/min AD
MT: 60639.38 Gal
5.001 Gl/min AD
PT: 65.81 Gal
Page 18

13
Action: Keypad UP
i
Figure 3.6: PWE with RTD option PI Screen with flow range, temperature and
Main Totalizer
Action: Keypad UP
i
Action: Keypad UP
i
Figure 3.7: PWE with RTD option PI Screen with Main Totalizer, temperature and
Pilot Totalizer
Action: Keypad UP
i
Figure 3.8: PWE with RTD option PI Screen with Main and Pilot Totalizers
5.001 Gl/min AD
20.1 C *******Gal
MT: 60639.38 Gal
20.1 C 65.81 Gal
MT: 60639.38 Gal
PT: 65.81 Gal
Page 19

14
Action: Keypad UP
i
Figure 3.9: PWE with RTD option initial Process Information Screen
Pressing UP button, pages through the PI screens in the forward direction.
Pressing DN button, pages through the PI screens in the reverse direction. When
the last PI screen is reached, the firmware "wraps around" and scrolls to the initial
PI screen once again.
3.1.2 PWE without RTD option Process
Information Screens
Pressing UP and DN buttons from initial PI screen will switch display as following:
[Initial PI screen]
Action: Keypad UP
i
Figure 3.10: PWE without RTD option PI Screen with Main and Pilot Totalizer
Action: Keypad UP
i
Figure 3.11: PWE without RTD option initial PI Screen with Main and Pilot
Totalizer
MT: 60639.38 Gal
PT: 65.81 Gal
5.001 Gl/min AD
20.1 C TA: D
5.001 Gl/min AD
PT: 65.81 Gal
Page 20

15
Action: Keypad UP
i
Figure 3.12: PWE without RTD option initial PI Screen with Flow rate and Main
Totalizer
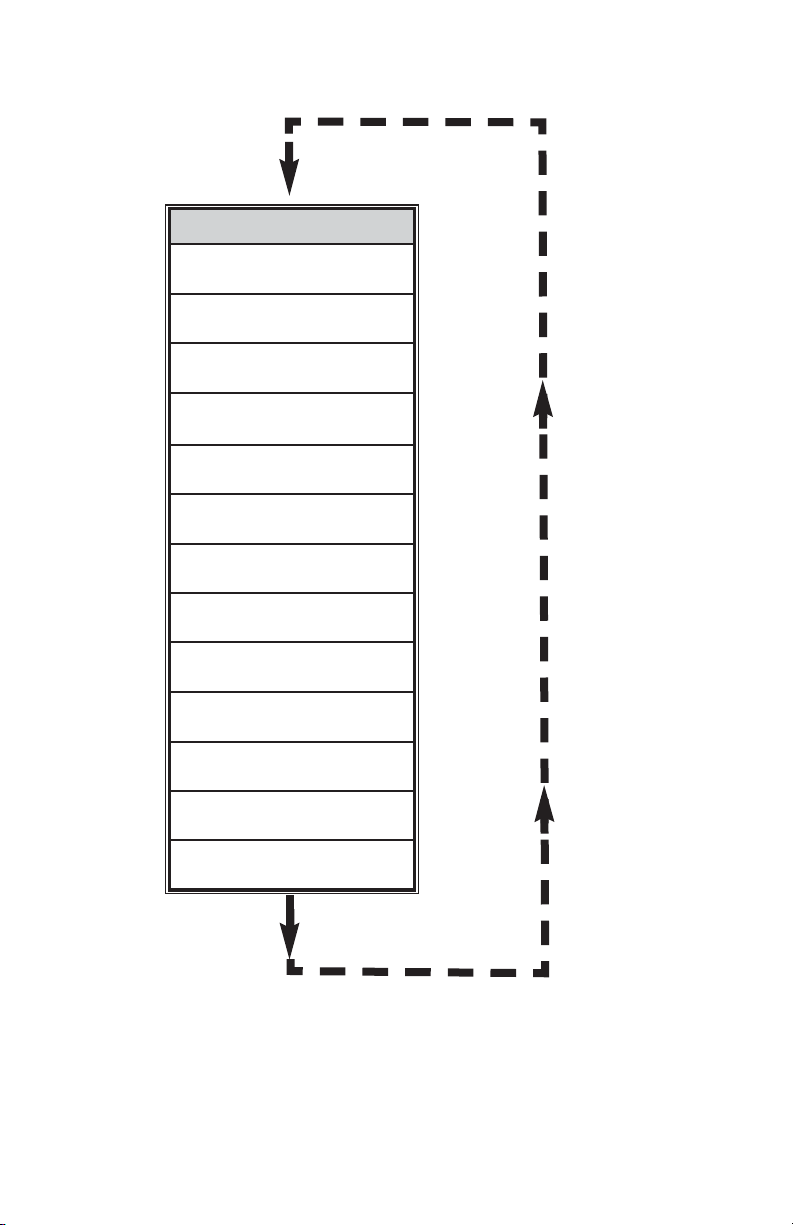
3.2 Menu Sequence
The listing below gives a general overview of the standard top-level display menu
sequence when running firmware version A002. The ESC pushbutton is used to
toggle between the process mode (PI screens) and the menu.
The listing in Section 3.2 shows the standard display menu sequence and submenus using the UP button to move through the menu items. The first message
displayed the first time the ESC button is pressed after the converter is powered
up is "Prog. Protection ON". Thereafter, pressing the ESC button while the
flow meter is in monitoring mode (PI screens) will display the parameter that was
last exited.
Program Protection may be turned "off" by pressing the ENT button when the Prog.
Protection menu is displayed. The firmware will prompt with "Change Prog Prot”.
Pressing UP or DN button will toggle current protection status. If password is set
to any value more than zero, the firmware will prompt with "Enter Prot Code". User
has to enter up to 3 digits program protection code, in order to be able to access
password protected menus. Once correct password is entered, program protection id turned off until unit is powered up again.
When the last menu item is reached, the firmware "wraps around" and scrolls to
the first item on the menu once again (see Figure 3.12). The menu items in the first
column are upper-level configuration mode functions. Submenu selections
(shown indented in the second column) only appear if the associated upper level
is selected by pressing the ENT push button. The allowable selections of submenu items which are selected by tabular means are shown in detail in Section 3.3
5.001 Gl/min AD
MT: 60639.38 Gal
Page 21
16
Figure 3.12 Upper level menu structure.
CONFIGURATION DATA
Prog. Protection
on/off
Prog. Prot. Code
old/new
Submenu
Flow Meter Info
Submenu
Measuring Units
Submenu
Flow Alarm
Submenu
Temp. Alarm
Submenu
Main Totalizer
Submenu
Pilot Totalizer
Submenu
Optical Outputs
Submenu
FlowMeter Config
LCD Back Light
50 %F.S.
Submenu
Alarm Events Log
Submenu
Diagnostic
Page 22
17
3.3 Parameter Summary and Data Entry
Page 23
18192021222324
Page 24
Page 25
Page 26

Page 27

Page 28

Page 29

Page 30

4. PARAMETER ENTRY
There are two methods of data entry: • Direct numerical number entry
• Tabular Input from a table menu.
If menu with direct numerical entry is selected use Up button to increment digit
value from 0-9. Use Dn button to move cursor to another digit position. When
desired value is entered use ENT button to accept (save in the EEPROM) new
value.
If menu with tabular entry is selected, the available menu options can be set
with the Up and Dn buttons and are accepted by pressing ENT button.
Note: During data entry the input values are checked for acceptability.
If data is not acceptable, it is rejected and a message is generated
indicating that the new data has not been accepted.
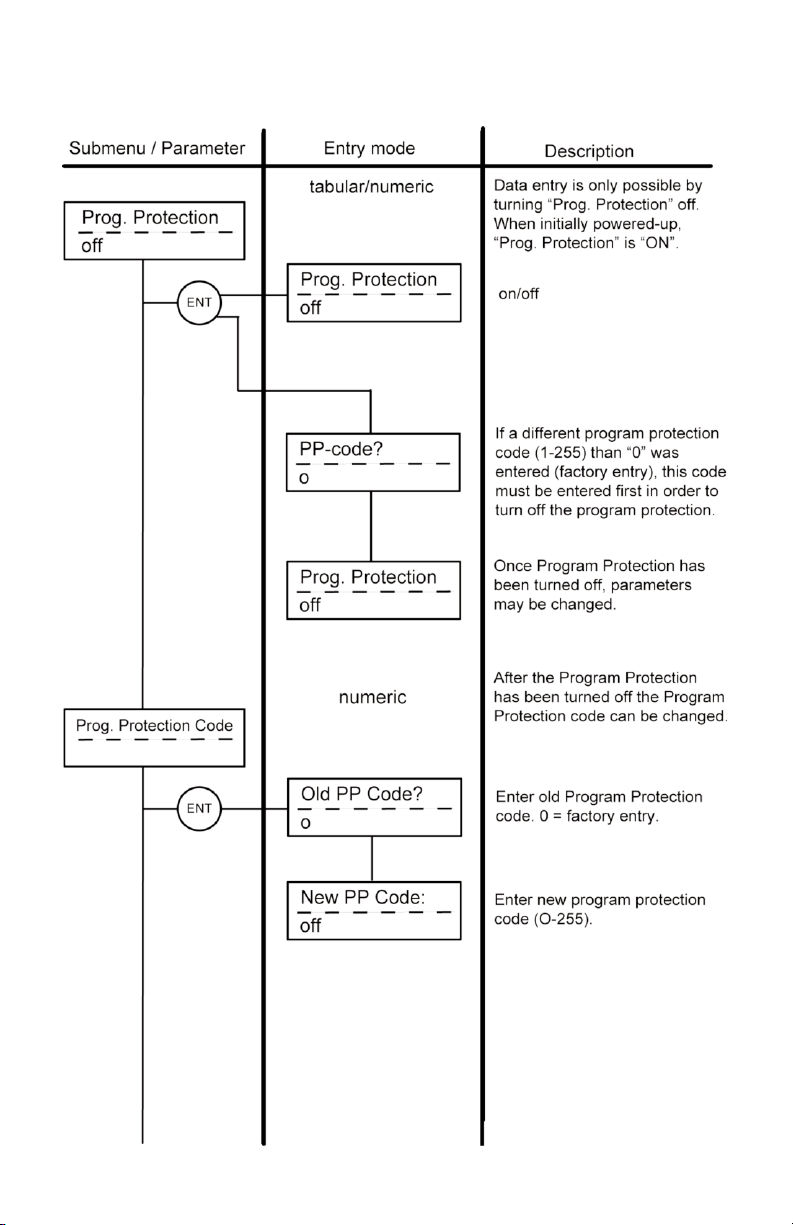
4.1 Submenu Program protection
After power has been turned on, programming parameters may only be changed
by turning program protection "OFF". There are two ways to turn off the
program protection:
1. If program protection code (PP-code) is on "0" (factory default), the
program protection is turned off by pressing ENTER key.
2. If a PP-code (1 to 255) other than "0" has been entered, this code must be
entered in order to turn the program protection "OFF".
The PP-code can be changed after the program protection has been turned off.
In order to protect device configuration parameters when changing the PP-code
the old PP-code must be entered after ENTER has been pressed.
Press ENTER key after entry of old PP-code.
25
,
Prog. Protection code
-----------------------------
Old PP-code?
----------------------------0
Page 31

26
Now enter the new PP-code (0-255) and press ENTER key. The new PP-code is
now valid to turn off the program protection. If the PP-code is forgotten, it can
be restored only via digital communication interface.
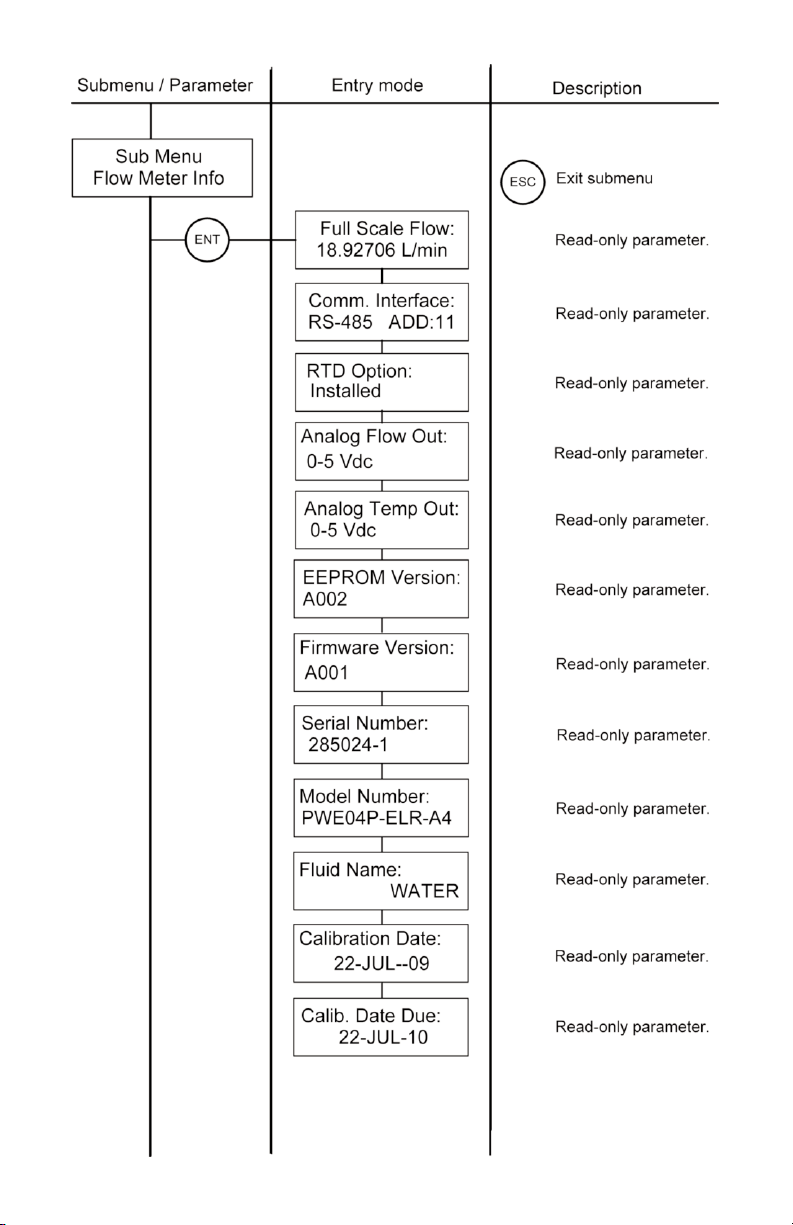
4.2 Submenu Flow Meter Info
This submenu contains information about the meter main configuration parameters. These items are informational only and may not be changed (read only).
4.2.1 Full Scale Flow
This display indicates the full scale range of the meter in L/min. The full scale
range of the flow meter is related to the lower block inside diameter. It is set on
the factory during calibration procedure. The full scale range of the meter is not
user changeable. A typical display is shown below.
4.2.2 Communication Interface
This display indicates type of the digital communication interface (RS-232 or
RS-485) and device address (two hexadecimal characters of the address will be
displayed only for RS-485 interface option). All flow meters are shipped from the
factory with default address 11. A typical display for device with RS-485 option
is shown below.
New PP-code
----------------------------0
Full Scale Flow:
18.92706 L/min
Comm. Interface:
RS-485 ADD: 11
Page 32

27
4.2.3 RTD hardware option
This display indicates presence of the RTD hardware. If second line of the screen
indicates “Installed”, then flow meter is equipped with RTD with signal processing circuitry and ready for temperature measurement. A typical display for device
with RTD option is shown below.
4.2.4 Analog Flow Output settings
This display indicates which type of the jumper selectable Flow analog output is
currently active. The device can be set for 0-5 Vdc or 4-20 mA output. A typical
display for device with jumper configuration for 0-5 Vdc Flow output is shown
below.
4.2.5 Analog Temperature Output settings
This display indicates which type of the jumper selectable Temperature analog output is currently active. The device can be set for 0-5 Vdc or 4-20 mA output. A typical display for device with jumper configuration for 0-5 Vdc Temperature output
is shown below.
Note: Analog Temperature Output settings screen will be available
on the devices which are not equipped with RTD option as well. In
this case user should not be under impression that unit supports
temperature measurement.
RTD Option:
Installed
Analog Flow Out:
0-5 Vdc
Analog Temp Out:
0-5 Vdc
,
Page 33

28
4.2.6 Flow Meter EEPROM data base version
This display indicates current version of the EEPROM data base. The EEPROM
stores all flow meter configuration parameters. The Flow Meter EEPROM data base
version is not user changeable. A typical display with EEPROM version is shown
below.
4.2.7 Flow Meter Firmware version
This display indicates current version of the flow meter firmware. The Flow Meter
Firmware version is not user changeable. A typical display with firmware version
is shown below.
4.2.8 Flow Meter Serial number
This display indicates the serial number of the flow meter. This number is generated by the factory and is unique to the instrument. The flow meter serial number
is not user-changeable. A typical display with flow meter serial number is shown
below.
4.2.9 Flow Meter Model number
This display indicates the model number of the flow meter. The flow meter model
number is not user-changeable. A typical display with flow meter model number
is shown below.
EEPROM Version:
A001
Firmware Version
A002
Serial Number:
245893-1
Model Number:
PWE04P-ELN-A2
Page 34

29
4.2.10 Fluid Name
This display indicates the name of the fluid the flow meter was calibrated for. The
fluid name may be changed by user via digital communication interface. A typical
display with fluid name is shown below.
4.2.11 Flow Meter Calibration Date
This display indicates the date when most recent calibration of the flow meter was
performed. The calibration date may be changed by user via digital communication interface. A typical display with flow meter calibration date is shown below.
4.2.12 Flow Meter Calibration Date Due
This display indicates the date when next calibration of the flow meter has to be
performed. The calibration date due may be changed by user via digital communication interface. A typical display with flow meter calibration date due is shown
below.
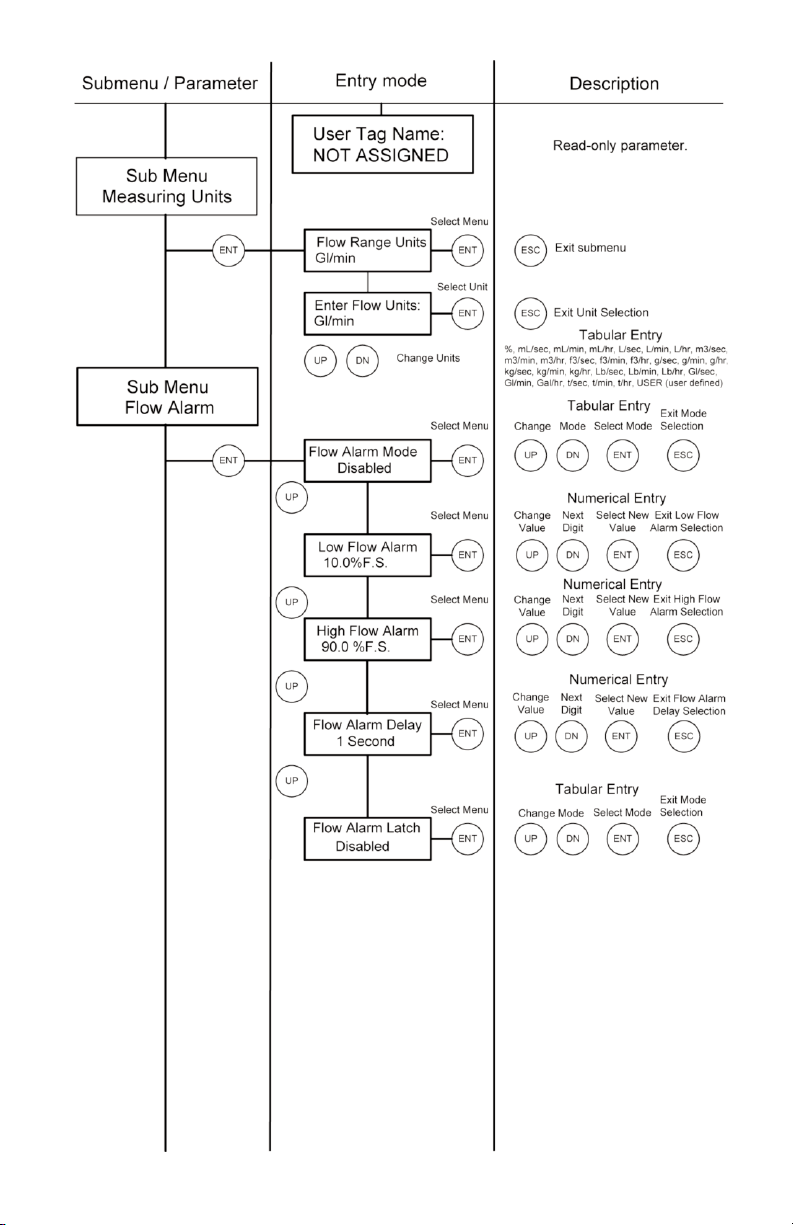
4.2.13 Flow Meter User Tag Name
Flow meter Tag is the quickest and shortest way of identifying and distinguishing
between multiple flow meters. Flow meters can be tagged according to the
requirements of your application. The tag may be up to 16 characters long and is
user-defined. A typical display with flow meter Tag Name is shown below.
Fluid Name:
WATER
Calibration Date:
08/01/2009
Calib. Date Due:
08/01/2010
Page 35

4.3 Submenu Measuring Units
This submenu allows selection of units for flow rate and Totalizer reading. Units
should be selected to meet your particular metering needs.
30
User Tag Name:
NOT ASSIGNED
Note: Once Flow Unit of Measure is changed the Totalizer’s Volume
based Unit of Measure will be changed automatically.
,
Page 36

31
UNITS OF MEASURE
NUMBER INDEX
FLOW RATE
ENGINEERING
UNITS
TOTALIZER
ENGINEERING
UNITS
DESCRIPTION
1 0 % %s Percent of full scale
2 1 mL/sec mL Milliliter per second
3 2 mL/min mL Milliliter per minute
4 3 mL/hr mL Milliliter per hour
5 4 L/sec Ltr Liter per second
6 5 L/ min Ltr Liter per minute
7 6 L/hr Ltr Liter per hour
87
m
3
/sec m
3
Cubic meter per second
98
m
3
/ min m
3
Cubic meter per minute
10 9
m
3
/hr m
3
Cubic meter per hour
11 10
ft
3
/sec ft
3
Cubic feet per second
12 11
ft
3
/min ft
3
Cubic feet per minute
13 12
ft
3
/hr ft
3
Cubic feet per hour
14 13 Gl/sec Gal Gal per sec
15 14 Gl/min Gal Gal per minute
16 15 Gal/hr Gal Gal per hour
17 16 g/sec g Grams per second
18 17 g/min g Grams per minute
19 18 g/hr g Grams per hour
20 19 kg/sec kg Kilograms per second
21 20 kg/min kg Kilograms per minute
22 21 kg/hr kg Kilograms per hour
23 22 Lb/sec Lb Pounds per second
24 23 Lb/min Lb Pounds per minute
25 24 Lb/hr Lb Pounds per hour
26 25 t/sec Ton Ton (metric) per sec
27 26 t/min Ton Ton (metric) per minute
28 27 t/hr Ton Ton (metric) per hour
29 28 User UD User defined
Page 37

32
The listed units in the table above can be set with the Up and Dn buttons and are
accepted by pressing ENT button.
4.3.1 User Defined Measuring Unit
This function enables user defined configuration of any engineering unit in the
converter. The following three parameters are available for this function:
a) Unit volume factor (defined in Liters)
b) Unit time base (defined in Seconds)
c) Unit with or without density support.
4.3.1.a User Defined Unit Factor Numeric entry
This parameter indicates the factor of the new unit with respect to one liter. The
default entry is 1.00 Liter.
4.3.1.b User Defined Unit Time Base Tabular entry
This parameter indicates the time base for User Defined Unit. The following selections are available: 1 second, 60 seconds (1 minute), 3600 seconds (1 Hour). The
default entry is 60 seconds.
The listed time based selections above can be set with the Up and Dn buttons and
are accepted by pressing ENT button.
Note: The entry of the listed parameters a), b) and c) is only
necessary in case the required engineering unit is not available in the
table above, (see Section 4.3).
,
UD Unit Factor
1.00 Liter
UDU Time Base
60 Seconds
Page 38

33
4.3.1.c User Defined Unit Density support
Tabular entry
This function determines whether the newly entered user defined engineering unit
is a mass unit (with density) or a volumetric unit (without density). The following
selections are available: Enabled or Disabled. The default entry is Disabled.
The listed above density support selections can be set with the Up and Dn buttons
and are accepted by pressing ENT button. If density was selected, also refer to
section 4.9.8.
4.4 Submenu Flow Alarm
PWE provides the user with a flexible alarm/warning system that monitors the
Fluid Flow for conditions that fall outside configurable limits as well as visual feedback for the user via the LCD (only for devices with LCD option) or via an optically isolated outputs.
The flow alarm has several attributes which may be configured by the user via
optional LCD/Keypad or digital communication interface. These attributes control
the conditions which cause the alarm to occur and to specify actions to be taken
when the flow rate is outside the specified conditions.
Flow Alarm conditions become true when the current flow reading is equal or
higher/lower than corresponding values of high and low flow alarm levels. Alarm
action can be assigned with preset delay interval (0-3600seconds) to activate the
optically isolated output (separate for High and Low alarm). Latch Mode control
feature allows each optical output to be latched on or follow the corresponding
alarm status.
4.4.1 Flow Alarm Mode Tabular entry
This function determines whether Flow Alarm is Enabled or Disabled. The following selections are available: Enabled or Disabled. The default entry is Disabled.
UDU Use Density
Disabled
Flow Alarm Mode
Disabled
Page 39

34
The listed above Alarm Mode selections can be set with the Up and Dn buttons
and are accepted by pressing ENT button.
4.4.2 Low Flow Alarm Numerical entry
The limit of required Low Flow Alarm value can be entered in increments of
0.1% from 0 - 100%F.S.
A typical display with flow meter Low Flow Alarm is shown below.
If a Low Alarm occurs, and one of the two optical outputs is assigned to the Low
Alarm Event (see Section 4.8) the optically isolated output will be activated when
the flow is less than the Low Flow Alarm value. The Flow Alarm condition is also
indicated on the display Process Information Screen by displaying L character. A
typical display with flow meter Process Information Screen and activated Low
Flow Alarm is shown below.
4.4.3 High Flow Alarm Numerical entry
The limit of required High Flow Alarm value can be entered in increments of 0.1%
from 0 - 100%F.S.
A typical display with flow meter High Flow Alarm settings is shown below.
Note: The value of the Low Flow Alarm must be less than the
value of the High Flow Alarm.
,
Note: The value of the High Flow Alarm must be more than the
value of the Low Flow Alarm.
,
Low Flow Alarm
10.0 %F.S.
0.401 Gl/min AL
MT: 65.81 Gal
Page 40

If a High Alarm occurs, and one of the two optical outputs is assigned to the High
Alarm Event (see Section 4.8) the optically isolated output will be activated when
the flow is more than the High Flow Alarm value. The Flow Alarm condition is also
indicated on the display Process Information Screen by displaying H character. A
typical display with flow meter Process Information Screen and activated High
Flow Alarm settings is shown below.
4.4.4 Flow Alarm Action Delay Numerical entry
The Flow Alarm Action Delay is a time in seconds that the Flow rate value must
remain above the high limit or below the low limit before an alarm condition is
indicated. Valid settings are in the range of 0 to 3600 seconds. A typical display
with flow meter Flow Alarm Delay settings is shown below.
4.4.5 Flow Alarm Action Latch Tabular entry
The Flow Alarm Action Latch settings controls Latch feature when optically isolated outputs are assigned to Flow Alarm event. Following settings are available:
Disable or Enabled.
By default, flow alarm is non-latching. That means the alarm is indicated only
while the monitored flow value exceeds the specified set conditions. If optically
isolated output is assigned to the Flow Alarm event, in some cases, the Flow Alarm
Latch feature may be desirable.
35
High Flow Alarm
90.0 %F.S.
4.641 Gl/min AH
MT: 67.81 Gal
Flow Alarm Delay
1 Second
Page 41

36
The listed above Flow Alarm Action Latch selections can be set with the Up and
Dn buttons and are accepted by pressing ENT button.
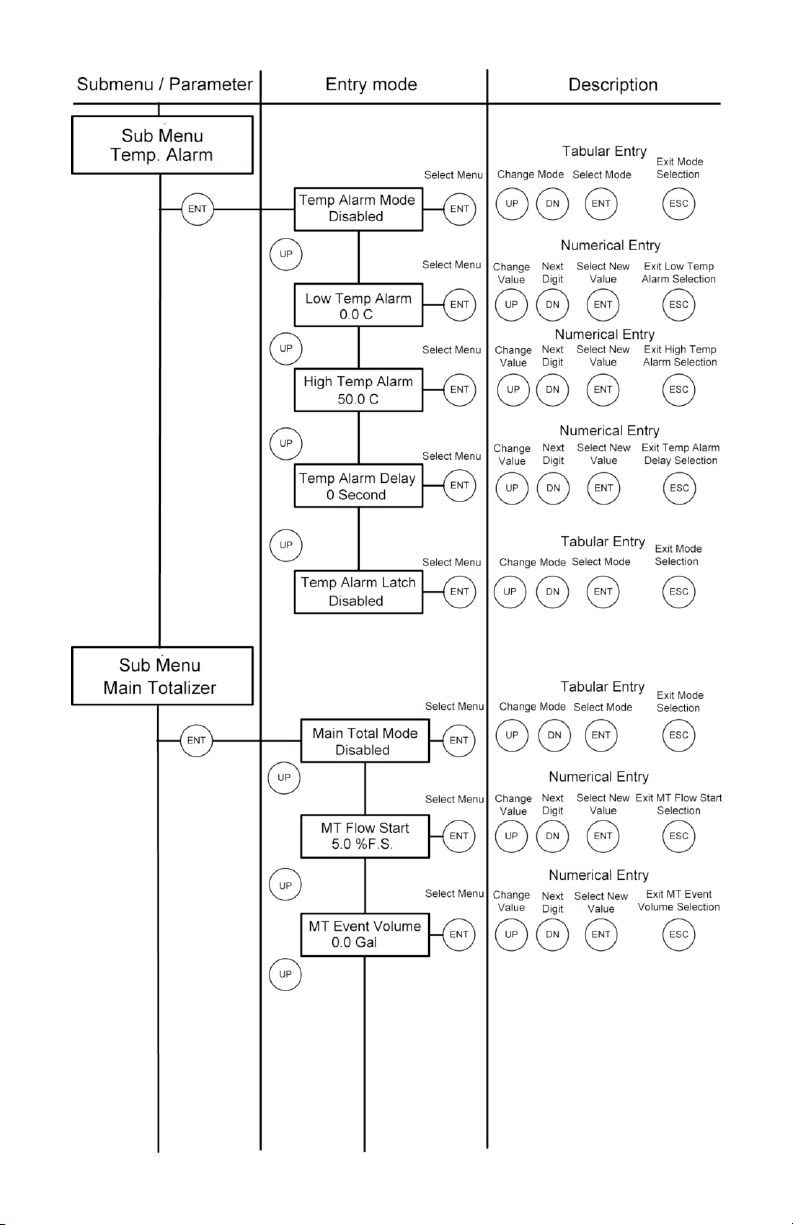
4.5 Submenu Temperature Alarm (*optional)
PWE with RTD option provides the user with a flexible alarm/warning system that
monitors the Fluid Temperature for conditions that fall outside configurable limits
as well as visual feedback for the user via the LCD (only for devices with LCD
option) or via an optically isolated outputs.
The temperature alarm has several attributes which may be configured by the user
via optional LCD/Keypad or digital communication interface. These attributes control the conditions which cause the alarm to occur and to specify actions to be
taken when the temperature value is outside the specified conditions. Temperature
Alarm conditions become true when the current temperature reading is equal or
higher/lower than corresponding values of high and low temperature alarm levels.
Alarm action can be assigned with preset delay interval (0-3600seconds) to activate the optically isolated output (separate for High and Low alarm). Latch Mode
control feature allows each optical output to be latched on or follow the corresponding alarm status.
4.5.1 Temperature Alarm Mode Tabular entry
This function determines whether Temperature Alarm is Enabled or Disabled. The
following selections are available: Enabled or Disabled. The default entry is
Disabled.
The listed above Temperature Alarm Mode selections can be set with the Up and
Dn buttons and are accepted by pressing ENT button.
4.5.2 Low Temperature Alarm Numerical entry
The limit of required Low Temperature Alarm value can be entered in increments
of 0.1 °C from -9.9 °C to 99.9 °C.
Flow Alarm Latch
Disabled
Temp Alarm Mode
Disabled
Page 42

37
A typical display with flow meter Low Temperature Alarm is shown below.
A typical display with flow meter Low Temperature Alarm is shown below.
If a Low Temperature Alarm occurs, and one of the two optical outputs is assigned
to the Low Alarm Event (see Section 4.8) the optically isolated output will be activated when the temperature is less than the Low Temperature Alarm value.
The Temperature Alarm condition is also indicated on the display Process
Information Screen by displaying L character. A typical display with flow meter
Process Information Screen and activated Low Temperature Alarm is shown
below.
4.5.3 High Temperature Alarm Numerical entry
The limit of required High Temperature Alarm value can be entered in increments
of 0.1°C from -9.9 °C to 99.9 °C.
A typical display with flow meter High Temperature Alarm settings is shown below
Note: The value of the Low Temperature Alarm must be less than the
value of the High Temperature Alarm. The value of the Temperature
can be entered only in °C units.
,
Note: The value of the Low Temperature Alarm must be less than the
value of the High Temperature Alarm. The value of the Temperature
can be entered only in °C units.
Note: The value of the High Temperature Alarm must be more than the
value of the Low Temperature Alarm.
,
,
Low Temp Alarm
0.0 C
5.001 Gl/min AD
-0.5 C TA: L
Page 43

If a High Temperature Alarm occurs, and one of the two optical outputs is assigned
to the High Alarm Event (see Section 4.8) the optically isolated output will be activated when the flow is more than the High Temperature Alarm value.
The Temperature Alarm condition is also indicated on the display Process
Information Screen by displaying H character. A typical display with flow meter
Process Information Screen and activated High Temperature Alarm settings is
shown below.
4.5.4 Temperature Alarm Action Delay
Numerical entry
The Temperature Alarm Action Delay is a time in seconds that the Temperature
value must remain above the high limit or below the low limit before an alarm condition is indicated. Valid settings are in the range of 0 to 3600 seconds. A typical
display with flow meter Temperature Alarm Delay settings is shown below.
4.5.5 Temperature Alarm Action Latch Tabular entry
The Temperature Alarm Action Latch settings controls Latch feature when optically isolated outputs are assigned to Temperature Alarm event. Following settings
are available: Disable or Enabled.
By default, flow alarm is non-latching. That means the alarm is indicated only while
the monitored Temperature value exceeds the specified set conditions. If optically
isolated output is assigned to the Temperature Alarm event, in some cases, the
Temperature Alarm Latch feature may be desirable.
38
High Temp Alarm
50.0 C
5.001 Gl/min AD
51.4 C TA: H
Temp Alarm Delay
1 Second
Page 44

The listed above Temperature Alarm Action Latch selections can be set with the
Up and Dn buttons and are accepted by pressing ENT button.
4.6 Submenu Main Totalizer
The total volume of the liquid is calculated by integrating the actual liquid flow rate
with respect to time. The Main Totalizer value is stored in the EEPROM and saved
every 1 second. In case of power interruption the last saved Totalizer value will be
loaded on the next power on cycle, so Main Totalizer reading will not be lost. The
optional LCD/keypad and digital communication interface commands are provided to:
- reset the totalizer to ZERO
- start the totalizer at a preset flow rate
- assign action at a preset total volume
- start/stop totalizing the flow
4.6.1 Main Totalizer Mode Tabular entry
This function determines whether Main Totalizer is Enabled or Disabled. The following selections are available: Enabled or Disabled. The default entry is
Disabled.
The listed above Main totalizer Mode selections can be set with the Up and Dn
buttons and are accepted by pressing ENT button.
39
Temp Alarm Latch
Disabled
Main Total Mode
Disabled
Note: Before enabling the Main Totalizer, ensure that all totalizer settings
are configured properly. Totalizer Start values have to be entered in
%F.S. engineering unit. The Totalizer will not totalize until the flow rate
becomes equal to or more than the Totalizer Start value. Totalizer Stop
values must be entered in currently active volume / mass based
engineering units. If the Totalizer Stop at preset total volume feature is
not required, then set Totalizer Stop value to zero (default settings).
,
Page 45

40
4.6.2 Main Totalizer Flow Start Numerical entry
The Main Totalizer Start Flow value can be entered in increments of 0.1% from 0.0
– 100.0%F.S. A typical display with flow meter Main totalizer Start Flow settings is
shown below.
4.6.3 Main Totalizer Event Volume Numerical entry
Main Totalizer Event Volume value must be entered in currently active volume /
mass based engineering units. Totalizer action event become true when the totalizer reading and preset "Event Volume" values are equal.
If the Totalizer Event at preset total volume feature is not required, then set
Totalizer Event Volume value to zero (default settings).
A typical display with flow meter Main Totalizer Event Volume settings is shown
below.
4.6.4 Main Totalizer Reset Tabular entry
The Main Totalizers reading can be reset by pressing ENTER button. A typical display with flow meter Main Totalizer Reset screen is shown below.
The next conformation screen will appear only for 2 seconds.
MT Flow Start
5.0 %F.S.
MT Event Volume
0.0 Gal
Reset Main Total
Value?
Press Ent key to
reset Totalizer!
Page 46

41
If during these two seconds user will press ENTER button again, the Main Totalizer
volume will be reset to zero. Following screen will appear for two seconds.
4.7 Submenu Pilot Totalizer
The total volume of the liquid is calculated by integrating the actual liquid flow rate
with respect to time. The Pilot Totalizer value is stored in the flow meter volatile
memory (SRAM) and saved every 100 ms. In case of power interruption the Pilot
Totalizer volume will be lost (reset to zero). The optional LCD/keypad and digital
communication interface commands are provided to:
- reset the totalizer to ZERO
- start the totalizer at a preset flow rate
- assign action at a preset total volume
- start/stop totalizing the flow
4.7.1 Pilot Totalizer Mode Tabular entry
This function determines whether Pilot Totalizer is Enabled or Disabled. The following selections are available: Enabled or Disabled. The default entry is Disabled.
The listed above Pilot totalizer Mode selections can be set with the Up and Dn buttons and are accepted by pressing ENT button.
The Totalizer has
been reset!
Pilot Total Mode
Disabled
Note: Before enabling the Pilot Totalizer, ensure that all totalizer settings
are configured properly. Totalizer Start values have to be entered in
%F.S. engineering unit. The Totalizer will not totalize until the flow rate
becomes equal to or more than the Totalizer Start value. Totalizer Stop
values must be entered in currently active volume / mass based
engineering units. If the Totalizer Stop at preset total volume feature is
not required, then set Totalizer Stop value to zero (default settings).
,
Page 47

42
4.7.2 Pilot Totalizer Flow Start Numerical entry
The Pilot Totalizer Start Flow value can be entered in increments of 0.1% from
0.0 – 100.0%F.S. A typical display with flow meter Pilot totalizer Start Flow set-
tings is shown below.
4.7.3 Pilot Totalizer Event Volume Numerical entry
Pilot Totalizer Event Volume value must be entered in currently active volume /
mass based engineering units. Totalizer action event become true when the totalizer reading and preset "Event Volume" values are equal.
If the Totalizer Event at preset total volume feature is not required, then set
Totalizer Event Volume value to zero (default settings). A typical display with flow
meter Pilot Totalizer Event Volume settings is shown below.
4.7.4 Pilot Totalizer Reset Tabular entry
The Pilot Totalizers reading can be reset by pressing ENTER button. A typical display with flow meter Pilot Totalizer Reset screen is shown below.
The next conformation screen will appear only for 2 seconds.
PT Flow Start
10.0 %F.S.
PT Event Volume
0.0 Gal
Reset Pilot Total
Value?
Press Ent key to
reset Totalizer!
Page 48

43
If during these two seconds user will press ENTER button again, the Pilot Totalizer
volume will be reset to zero. Following screen will appear for two seconds.
4.8 Submenu Optical Outputs Numerical entry
Two sets of optically isolated outputs are provided to actuate user supplied equipment. These are programmable via digital interface or optional LCD/Keypad such
that the outputs can be made to switch when a specified event occurs (e.g. when
a low or high flow alarm limit is exceeded or when the totalizer reaches a specified value) or may be directly controlled by user.
The user can configure each optical output action from 11 different options:
- Disabled: No Action (output is not assigned to any events and not energized)
- Low Flow Alarm
- High Flow Alarm
- Range between H&L Flow alarm settings
- Main Totalizer reading exceed set limit
- Pilot Totalizer reading exceed set limit
- Low Temperature alarm (*RTD option only)
- High Temperature alarm (*RTD option only)
- Range between High and Low Temperature alarm (*RTD option only)
- Diagnostic: Output will be energized when any of the Diagnostic events are active
- Manual On Control: Output will be energized until Disabled option will be
selected.
A typical display with Optical Output Function selection is shown below.
The listed above Optical Output selections can be set with the Up and Dn buttons
and are accepted by pressing ENT button.
The Totalizer has
been reset!
Opt #1 function
Disabled
Page 49

44
4.9 Submenu Flow Meter Configuration
4.9.1 Submenu Flow Meter Low Flow Cut–off
Numerical entry
The low flow cut-off can be selected between 0.0 and 10.0 % of the full scale
range. Flows less than the cut-off value are internally driven to zero and not totalized. The analog 0-5 vdc or 4-20mA current outputs are set to 0.0 Vdc and 4.00
mA correspondently. The switching threshold for the low flow cut-off has 1.0
%F.S. hysteresis. A typical display with Low Flow Cut–off selection is shown
below.
4.9.2 Submenu Pulse Number Measure Interval
Numerical entry
Signal Processing software algorithm can be set to calculate flow rate based on
two different methods (see Section 4.9.4):
a) number of pulses over preset measure interval
b) pulse width measurement
Both methods calculates frequency of the pulses from the flow meter sensor. The
number of pulses over preset measure interval method convenient when pulsating flow or especially noisy signals are encountered.
This method allows to get stable average flow rate if pulse measure interval is set
to values more than 4000 ms. This parameters effects the flow update rate. With
higher value of the pulse measure interval, the resolution and stability of the flow
measurement improves, but response time become longer. A suggested pulse
measure interval value of 4000 seconds is a good starting point for most applicable process fluids. With lower settings the response time of the meter will be
shorter, but resolution and stability will degrade.
The pulse measure interval settings are only related to the number of pulses over
preset measure interval method. Pulse measure interval can be selected between
500 and 60000 ms. A typical display with pulse measure interval selection is
shown below.
Low Flow Cut–off
1.000 %F.S.
Page 50

4.9.3 Submenu Flow Meter Calibration Factor
Numerical entry
Calibration Factor is defined as the number of pulses from flow sensor per one
gallon of fluid passing through the meter. This is the parameter by which the factory calibrates the flow meter. Change of this parameter is rarely needed by customers. It is only necessary if you believe the PWE flow meter is no longer accurate.
A typical display with Calibration Factor selection is shown below.
4.9.4 Submenu Flow Meter Measure Mode
Tabular entry
Signal Processing software algorithm can be set to calculate flow rate based on
two different methods:
a) number of pulses over preset measure interval
b) pulse width measurement
First method (a) was explained earlier (see Section 4.9.2). Second method (b)
allows get quick response time and best resolution of the flow rate, but with pulsating or especially noisy flow environment the stability of the flow rate reading
may be compromised. A digital filter (noise reduction algorithm) is available in
the flow meter when pulsating flow or especially noisy signals are encountered
(see Sections 4.9.5 and 4.9.6). The digital filter improves the displayed instantaneous flow values.
45
Measure Interval
4000 ms
Calibration-Fact
1366 Pulse/Gal
Note: Your PWE Flow Meter was calibrated at the factory for the
specified fluid and full scale flow range (see device’s label or calibration
data sheet). There is no need to adjust the Flow Meter calibration
factor, unless adjustment for specific installation or fluid is needed.
Any alteration of the flow meter calibration factor will VOID calibration
warranty supplied with instrument.
,
Page 51

46
The digital filter only works with pulse width measurement method and is not
applicable for flow measurement mode (a) – “number of pulses over measure
interval”. A typical display with Measure Mode selection is shown below. By
default unit shipped from the factory with Measure Mode set to “Pulse Width”.
4.9.5 Submenu Noise Reduction Filter Damping
Time Numerical entry
A noise reduction filter algorithm (running average of the individual flow inputs) is
available in the flow meter when pulsating flow or especially noisy signals are
encountered. There are two parameters that make up Signal Processing Control:
Damping Time and Number of Samples. They are described individually below.
Damping Time: The damping value can be selected between 0 and 99 seconds.
The value represents the response time of the running average flow rate change.
The higher the damping value the longer the response time of the filter. If noise
reduction filter is not desired it may be disabled by setting Damping Time parameter to zero. By default unit shipped from the factory with Damping Time value set
to 5. A typical display with Damping Time selection is shown below.
4.9.6 Submenu Noise Reduction Filter Sample
Number Numerical entry
This is the second parameter that makes up noise reduction filter algorithm. The
sample number value can be selected between 1 and 32. The number of samples
value represents the number of previous individual inputs used to calculate the
average value. Eventually the number of samples in the running average also
affects the response time. The more samples is used, the more inertial flow output reading will be to the actual flow change. A suggested nominal number of 5
samples is a good starting point for most applicable process fluids. A typical display with Sample Number selection is shown below.
Measure Mode
Pulse Width
NRF Damping Time
05 Seconds
Page 52

4.9.7 Submenu Flow Linearizer Tabular entry
The Flow Linearization algorithm may be used to improve linearity of the flow
measurement. The Flow Linearization table is built during factory calibration procedure and stored in the device EEPROM. The Flow Linearizer can be used with
both flow measurement algorithms. By default unit shipped from the factory with
enabled Flow Linearizer. A typical display with Flow Linearizer selection is shown
below.
The listed above Flow Linearizer selections can be set with the Up and Dn buttons
and are accepted by pressing ENT button.
4.9.8 Submenu Fluid Density Numerical entry
When the flow is displayed in gravimetric (mass based) units (e.g: g, kg, t, pound)
a density value of the actual fluid must be entered for the flow rate and total calculation. The translation conversion to mass flow is settable between 0.01 and
5.00000 g/cm3. A typical display with Fluid Density selection is shown below.
4.9.9 Submenu Pilot Calibration timer Tabular entry
The Pilot Calibration timer accumulates operational hours since last time unit was
calibrated. The value of the timer may be reset by the user by pressing Ent button.
A typical display with Calibration timer selection is shown below.
47
NRF Sample Numb.
05
Flow Linearizer
Enabled
Fluid Density
1.12500 g/cm3
Pilot Cal. Timer
70.0 Hours
Page 53

48
Once Ent button is pressed the next conformation screen will appear only for 2
seconds.
If during these two seconds user will press ENTER button again, the Calibration
Timer value will be reset to zero.
4.10 Submenu LCD Back Light Numerical Entry
This parameter indicates the level (intensity) of the LCD back light. The value of
the LCD back light level can be entered in increments of 1% from 0 - 80%F.S. If
LCD back light is not desired, it can be turn off by setting back light level to zero.
A typical display with LCD Back Light selection is shown below.
4.11 Submenu Alarm Events Log
PWE series Flow Meters are equipped with a self-diagnostic alarm event log which
is available via digital interface and on screen LCD indication (for devices with
optional LCD). A typical display with Alarm Events Log selection is shown below.
Press Ent key to
reset Cal. Timer
LCD Back Light
50 %F.S.
Sub Menu
Alarm Events Log
Page 54

49
The following diagnostic events are supported:
Event
Number
Diagnostic Alarm Event Description
LCD bit
Code
1 CPU Temperature too High 0
2 Flow rate more than 125% F.S. 1
3 High Flow Alarm 2
4 Low Flow Alarm 3
5 High Fluid Temperature Alarm 4
6 Low Fluid Temperature Alarm 5
7 Fluid Temperature Above measurement Limit 6
8 Fluid Temperature Below measurement Limit 7
9 Main Totalizer exceed set event volume limit 8
10 Pilot Totalizer exceed set event volume limit 9
11 EEPROM Failure 10
12 DC/DC converter Voltage too High 11
13 DC/DC converter Voltage too Low 12
14 Communication Error 13
15 Reserved 14
16
FATAL ERROR (reset or maintenance service is
required for return in to the normal operation)
15
Any Alarm events that may have occurred (Event 0 to Event F) are
stored in the internal register. All detected events remain stored until the
register is manually reset (by pressing ENTER key or by means of the
digital communication interface). The Alarm Event Log register is
mapped to the SRAM (volatile memory). In case of power interruption
the Alarm Event Log register will be automatically reset.
,
Page 55

50
4.11.1 Submenu Alarm Events Log Status
Each alarm event has fixed designated position on the LCD screen. Most significant event code (F) is set on the right side of the LCD and least significant event
code (0) is set on the left side of the LCD. If event is not present (not active) it is
represented on the LCD as dot (.) character. If event is present (or was detected
in the past) it is represented on the LCD with corresponding character. A typical
display with Alarm Events Log Status without any detected events is shown below.
In the example shown below, event 1 (Flow rate more than 125% F.S.) and event
2 (High Flow Alarm) have occurred since the last reset.
In order to reset (clear) Event Log press Ent button. Following screen will appear
just for two seconds.
If during these two seconds user will press Ent button again, the Alarm Event Log
will be cleared.
Event Log Status
. . . . . . . . . . . . . . . .
Event Log Status
. . 23 . . . . . . . . . . . .
Press Ent key to
Clear events Log
Note: Each Alarm Event can be individually masked (disabled) using
Event Log Mask menu selection (see Section 4.11.3) If alarm event is
masked (disabled) it will not be registered in the Event Status Log even
actual event has occurred.
,
Page 56

51
4.11.2 Submenu Alarm Events List
This menu selection provides list of the descriptions and corresponding code for
all supported events.
If ENTER is pressed again, the description for each error is displayed:
The shown above Event List selections can be scrolled with the Up and Dn buttons. By pressing ENT or Esc buttons user may exit from scrolling mode.
4.11.3 Submenu Alarm Events Log Mask
With this menu selection user may individually mask (disable) any Alarm Event. A
typical display with Alarm Events Mask selection is shown below.
In the example shown above, event 1 (Flow rate more than 125% F.S.) is masked
with asterisk. In order to change event mask settings user should press Ent button. The flashing cursor will appear on the left of the LCD screen (on the 0 event
position). Use Dn button to move to desired event code. Use Up button to change
mask status (asterisk represent masked event). Use Ent button to accept and save
new mask settings.
4.12 Submenu Diagnostic
This submenu provides troubleshooting information about the meter internal variables. These items are informational only and may not be changed (read only).
Events List
Press Enter Key
Events List
0-CPU Temp. High
Event Log Mask
0*23456789ABCDEF
Page 57

52
4.12.1 Submenu Raw Pulses Count
This menu selection provides number of pulses from the flow sensor within specific measurement interval.
In the example shown above the raw pulses count is 400 within 4000 ms measuring interval, which represents pulse frequency of 100 Hz.
4.12.2 Submenu Pulse Frequency
This menu selection provides raw value of the frequency from the pulse width
measurement circuitry.
4.12.3 Submenu Raw RTD reading (RTD option only)
This menu selection provides raw value of the ADC counts for RTD circuitry. The
reading only applicable for PWE meters with optional RTD functionality.
4.12.4 Submenu DAC_A Flow Output
This menu selection provides current value of the DAC register for analog flow
output circuitry.
Raw Pulses Count
400 T= 4000mS
Pulse Frequency
100.00 Hz
Raw RTD Reading
1250 Counts
DAC_A Output (F)
3125 Counts
Page 58

53
4.12.5 Submenu DAC_B Temperature Output
This menu selection provides current value of the DAC register for analog temperature output circuitry.
4.12.6 Submenu CPU Temperature
This menu selection provides current value of the PCB and CPU temperature in °C.
4.12.7 Submenu Raw VCC Reading
This menu selection provides current normalized value of the DC/DC converter
output in counts. The typical values are in the range between 2800 and 3200
counts.
5. Analog Output Signals
5.1 Analog Output Signals configuration
PWE series Flow Meters are equipped with calibrated 0-5 Vdc and/or 4-20 mA output signals for flow and temperature* process variables. The set of the jumpers
(J3A, J3B, J3C, J3D, J3E, J3F) located on the top of the flow meter, inside of the
maintenance access window (see Figure 5-1 “PWE configuration jumpers”) are
used to switch between 0-5 Vdc or 4-20 mA output signals. Jumpers J3A, J3B,
J3C are used to set flow analog output type and jumpers J3D, J3E, J3F are used
to set temperature* analog output type (see Table 5-1). Jumper J3G is used to
configure RS-485 termination resistor (by default is off).
DAC_B Output (T)
1358 Counts
CPU Temperature
35.8 C
Raw VCC Reading
3065 Counts
Page 59

54
Figure 5-1 PWE configuration jumpers
Table 5-1
Function
Analog Flow Output Analog Temp. Output* RS-485
J3A J3B J3C J3D J3E J3F J3G
Analog
Output
0-5 Vdc 2-3 5-6 8-9 11-12 14-15 17-18
4-20 mA 1-2 4-5 7-8 10-11 13-14 16-17
RS-485
220 Ohm
Termination
Resistor
OFF 20-21
ON 19-20
5.2 Analog Output Signals calibration
Note: The analog output available on the PWE Flow Meter was calibrated
at the factory for the specified fluid and full scale flow range (see the
device’s front label). There is no need to perform analog output
calibration unless the EEPROM IC was replaced or offset/span
adjustment is needed. Any alteration of the analog output scaling
variables in the EEPROM table will VOID calibration warranty supplied
with instrument.
,
Page 60

55
Note: It is recommended to use the Aalborg®supplied calibration and
maintenance software for analog output calibration. This software
includes an automated calibration procedure which may radically
simplify calculation of the offsets and spans variables and, the reading
and writing for the EEPROM table.
,
The PWE analog output calibration involves calculation and storing of the offset
and span variables in the EEPROM for each available output. The 0-5 Vdc output
has only scale variable and 20 mA output has offset and scale variables. The following is a list of the EEPROM variables used for analog output computation:
Analog Flow Output variables
Index Name Description
39 FoutScaleV - DAC 0-5 Vdc Flow Analog Output Scale
41 FoutScale_mA - DAC 4-20mA Flow Analog Output Scale
42 FoutOffset_mA - DAC 4-20mA Flow Analog Output Offset
Analog Temperature Output variables*
Index Name Description
43 ToutScaleV - DAC 0-5 Vdc Temperature Analog Output Scale
45 ToutScale_mA - DAC 4-20mA Temperature Analog Output Scale
46 ToutOffset_mA - DAC 4-20mA Temperature Analog Output Offset
5.2.1 Initial Setup
Power up the PWE Flow Meter for at least 15 minutes prior to commencing the
calibration procedure. Make sure absolutely no flow takes place through the meter.
Establish digital RS-485/RS-232 communication between PC (communication terminal) and PWE. The commands provided below assume that calibration will be
performed manually (w/o Aalborg
®
supplied calibration and maintenance software)
and the device has RS-485 address 11. If Aalborg®supplied calibration and maintenance software is used, skip the next section and follow the software prompts.
Enter Backdoor mode by typing: !11,MW,1000,1[CR]
Unit will respond with: !11,BackDoorEnabled: Y
Disable DAC update by typing: !11,WRITE,4,Y[CR]
Unit will respond with: !11,DisableUpdate: Y
Page 61

5.2.2 Flow 0-5 Vdc analog output calibration
1. Install jumpers J3A, J3B and J3C on the PC board for 0-5 Vdc output
(see Table 5-1).
2. Connect a certified high sensitivity multi meter set for the voltage
measurement to the pins M (+) and K (-) of the PWE 12 Pin "M16" connector.
3. Write 4000 counts to the DAC_A channel: !11,WRITE,0,4000[CR]
4. Read voltage with the meter and calculate FOutScaleV value:
5. Save FOutScaleV in to the EEPROM: !11,MW,39,X[CR]
Where: X – the calculated FoutScaleV value.
5.2.3 Flow 4-20 mA analog output calibration
1. Install jumpers J3A, J3B and J3C on the PC board for 4-20 mA output
output (see Table 5-1).
2. Connect a certified high sensitivity multi meter set for the current
measurement to pins M (+) and K (-) of the PWE 12 Pin "M16" connector.
3. Write 4000 counts to the DAC_A channel: !11,WRITE,0,4000[CR]
4. Read current with the meter and calculate FoutScale_mA value:
5. Write zero counts to the DAC_A channel: !11,WRITE,0,0CR]
6. Read offset current with the meter and calculate FoutOffset_mA value:
7. Save FoutScale_mA in to the EEPROM: !11,MW,41,Y[CR]
Save FoutOffset_mA in to the EEPROM: !11,MW,42,Z[CR]
Where: Y – the calculated FoutScale_mA value.
Z – the calculated FoutOffset_mA value.
56
FoutScaleV=
20000
Reading[V]
FoutScale_mA =
4000
Reading[mA]
FoutOffset_mA=-FOutScale_mA*Offset_Reading[mA]
Page 62

57
5.2.4 Temperature 0-5 Vdc analog output
calibration*
1. Install jumpers J3D, J3E and J3F on the PC board for 0-5 Vdc output
(see Table 5-1).
2. Connect a certified high sensitivity multi meter set for the voltage
measurement to the pins L (+) and K (-) of the PWE 12 Pin "M16"
connector.
3. Write 4000 counts to the DAC_B channel: !11,WRITE,1,4000[CR]
4. Read voltage with the meter and calculate TOutScaleV value:
5. Save TOutScaleV in to the EEPROM: !11,MW,43,X[CR]
Where: X – the calculated ToutScaleV value.
5.2.5 Temperature 4-20 mA analog output
calibration*
1. Install jumpers J3D, J3E and J3F on the PC board for 4-20 mA output
output (see Table 5-1).
2. Connect a certified high sensitivity multi meter set for the current
measurement to pins L (+) and K (-) of the PWE 12 Pin "M16" connector.
3. Write 4000 counts to the DAC_B channel: !11,WRITE,1,4000[CR]
4. Read current with the meter and calculate ToutScale_mA value:
5. Write zero counts to the DAC_B channel: !11,WRITE,1,0CR]
6. Read offset current with the meter and calculate ToutOffset_mA value:
7. Save ToutScale_mA in to the EEPROM: !11,MW,45,Y[CR]
Save ToutOffset_mA in to the EEPROM: !11,MW,46,Z[CR]
ToutScaleV=
20000
Reading[V]
ToutScale_mA=
4000
Reading[mA]
ToutOffset_mA=-TOutScale_mA*Offset_Reading[mA]
Page 63

58
Where: Y – the calculated ToutScale_mA value.
Z – the calculated ToutOffset_mA value.
Enable DAC update by typing: !11,WRITE,4,N[CR]
Unit will respond with: !11,DisableUpdate: N
Close BackDoor access by typing: !11,MW,1000,0[CR]
Unit will respond with: !11,BackDoorEnabled: N
6. PWE FLOW CALIBRATION PROCEDURES
Aalborg
®
Instruments' Flow Calibration Laboratory offers professional calibration
support for PWE Flow Meters using precision calibrators under strictly controlled conditions. NIST traceable calibrations are available. Calibrations can also
be performed at customers' site using available standards.
6.1 Connections and Initial Warm Up
Power up the PWE Flow Meter for at least 1minutes prior to commencing the
calibration procedure. Establish digital RS-485/RS-232 communication between
PC (communication terminal) and the PWE. Start Aalborg
®
supplied calibration
and maintenance software on the PC.
Note: When done with the analog output calibration make sure the
DAC update is enabled and the BackDoor is closed
(see command below).
,
NOTE: REMOVAL OF THE FACTORY INSTALLED CALIBRATION
SEALS AND/OR ANY ADJUSTMENTS MADE TO THE METER, AS
DESCRIBED IN THIS SECTION, WILL VOID ANY CALIBRATION
WARRANTY APPLICABLE.
,
Note: All adjustments in this section are made from the outside of the
meter via digital communication interface between a PC (terminal) and
PWE or via local LCD/KeyPad. There is no need to disassemble any part
of the instrument or perform internal PCB component (potentiometers)
adjustment.
,
Page 64

59
6.2 Flow Meter Span Calibration
Using Aalborg
®
supplied calibration and maintenance software start Set Span
procedure by navigating to the Tools/Set Span/PulseCounts menu. The software
will display screen with current frequency and calculated Calibration Factor.
Using the installation flow regulator, adjust the flow rate to 100% of full scale
flow. Check the flow rate indicated against the flow calibrator. Once required flow
rate is established click Save button. The new Calibration Factor will be saved in
to the EEPROM table (index 61) and device linearization table (EEPROM indexes
62-83) will be initialized with default linear values.
Calibration Factor also can be adjusted using local LCD/KeyPad interface (see
Section 4.9.3).
6.3 Flow Meter Linearization Table Calibration
The PWE flow linearization table calibration involves building a table of the actual
flow values (EEPROM indexes 62, 64, 66, 68, 70, 72, 74, 76, 78, 80, 82) and corresponding sensor readings (EEPROM indexes 63, 65, 67, 69, 71, 73, 75, 77, 79,
81, 83). Actual flow values are entered in normalized fraction format: 100.000 %
F.S. corresponds to 1.000000 flow value and 0.000 % F.S. corresponds to
0.000000 flow value. The valid range for flow values is from 0.000000 to 1.000000
(note: PWE will accept up to 6 digits after decimal point). Sensor readings are
entered in pulses and should always be in the range of 10 to 4000. There are 11
elements in the table so the data should be obtained at an increment of 10.0 % of
full scale (0.0, 10.0, 20.0, 30.0, 40.0, 50.0, 60.0, 70.0, 80.0, 90.0 and 100.0 %
F. S .) .
Note: Your PWE Flow Meter was calibrated at the factory for the
specified fluid and full scale flow range (see device’s front label). There
is no need to adjust the Calibration Factor or Flow linearization table
unless linearity adjustment is needed, flow range has to be changed.
Any alteration of the Calibration Factor or flow linearization table will
VOID calibration warranty supplied with instrument.
,
Note: Described above procedure will reinitialize entire Linearization
table. If it is desirable to keep existing linearization table and only minor
adjustment of the calibration curve is required it is recommended
perform linearization table adjustment starting from 90% F.S.
(see Section 6.3).
,
Page 65

60
If a new calibration table is going to be created, it is recommended to start calibration from 100% full scale. If only linearity adjustment is required, calibration
can be started in any intermediate portion of the gas table.
Using the flow regulator, adjust the flow rate to 100% of full scale flow. Check the
flow rate indicated against the flow calibrator. Observe the flow reading on the
PWE. If the difference between calibrator and PWE flow reading is more than 0.5%
F.S., make a correction in the sensor reading in the corresponding position of the
linearization table (see Index 83).
If the PWM flow reading is more than the calibrator reading, the number of counts
in the index 83 must be decreased. If the PWE flow reading is less than the calibrator reading, the number of counts in the index 83 must be increased. Once
Index 83 is adjusted with a new value, check the PWE flow rate against the calibrator and, if required, perform additional adjustments for Index 83.
If a simple communication terminal is used for communication with the PWE, then
“MW” (Memory Write) command from the software interface commands set may
be used to adjust sensor value in the linearization table (see section 8.3 for complete software interface commands list). Memory Read “MR” command can be
used to read the current value of the index.
Assuming the PWE is configured with RS-485 interface and has address “11”, the
following example will first read the existing value of Index 83 and then write a new
adjusted value:
!11,MR,83[CR] - reads EEPROM address 83
!11,MW,83,1200[CR] - writes new sensor value (1200 counts) in to the index 83
Once 100% F.S. calibration is completed, the user can proceed with calibration for
another 9 points of the linearization table by using the same approach.
Note: Do not alter memory index 62 (must be 0.0) and 63 (must be 0
counts). These numbers represent zero flow calibration points and
should not be changed.
,
Note: Once memory index 83 is changed the device firmware will
automatically update Calibration Factor (EEPROM index 61).
,
Note: It is recommended to use Aalborg®supplied calibration and
maintenance software for linearization table calibration. This software
includes an automated calibration procedure which may radically
simplify reading and writing for the EEPROM linearization table.
,
Page 66

7. RS-485/RS-232 SOFTWARE
INTERFACE COMMANDS
7.1 General
The standard PWE comes with an RS-485 interface. For the optional RS-232 interface, the start character (!) and two hexadecimal characters for the address must
be omitted. The protocol described below allows for communications with the unit
using either a custom software program or a “dumb terminal.” All values are sent
as printable ASCII characters. For RS-485 interface, the start character is always
(!). The command string is terminated with a carriage return (line feeds are automatically stripped out by the PWE). See Section 2.2.5 for information regarding
communication parameters and cable connections.
7.2 Commands Structure
The structure of the command string:
!<Addr>,<Cmd>,Arg1,Arg2,Arg3,Arg4<CR>
Where:
! Start character **
Addr RS485 device address in the ASCII representation of hexadecimal
(00 through FF are valid).**
Cmd The one or two character command from the table below.
Arg1 to Arg4 The command arguments from the table below.
Multiple arguments are comma delimited.
CR Carriage Return character.
** - OMIT FOR RS232 INTERFACE.
Several examples of commands for RS-485 option follow. All assume that the PWE
meter has been configured for address 18 (12 hex) on the RS485 bus:
1. To get a flow reading: !12,F<CR>
The device will reply: !12,50.0<CR> (Assuming the flow is at 50.0% FS)
2. To get current Flow Alarm status: !12,FA,R<CR>
The device will reply: !12,FA,N<CR> > (Assuming no alarm conditions)
3. To get a Main Totalizer reading: !12,MT,R<CR>
The device will reply: !12,MT:93.05<CR>
(Assuming the Main totalizer reading is 93.5)
61
Page 67

4. Set the flow high alarm limit to 85% of full scale flow rate:
!12,FA,H,85.0<CR>
The device will reply: !12,FA,H:85.0<CR>
Several examples of commands for RS-232 option follow.
1. To get a flow reading: F<CR>
The device will reply: 50.0<CR> (Assuming the flow is at 50.0% FS)
2. To get current Flow Alarm status:FA,R<CR>
The device will reply: FA,N<CR> > (Assuming no alarm conditions)
3. To get a Main Totalizer reading: MT,R<CR>
The device will reply: MT:93.05<CR>
(Assuming the Main totalizer reading is 93.5)
4. Set the flow high alarm limit to 85% of full scale flow rate: FA,H,85.0<CR>
The device will reply: FA,H:85.0<CR>
62
Page 68

63
AALBORG PWE METER ASCII SOFTWARE INTERFACE COMMANDS
NOTE: AN "*" INDICATES POWER UP DEFAULT SETTINGS.
AN "**"INDICATES OPTIONAL FEATURE NOT AVAILABLE ON ALL MODELS.
COMMAND
NAME
DESCRIPTION
NO.
COMMAND SYNTAX
COMMAND
ARGUMENT 1 ARGUMENT 2
ARGUMENT 3 ARGUMENT 4 RESPONSE
Flow
Requests the current flow
sensor reading in current EU
1
F
<Value> (Actual flow in
current engineering units)
Temperature
**
Requests the current
temperature reading in current
EU (°C or °F)
2 T
<Value> (Actual temp. in
current engineering units)
DIagnostic
Events
Read/Reset current status of
Diagnostic Events Log register.
3 DE
NO ARGUMENT
(read status)
DE:0x10
0x10 – diagnostic word
(16 bits wide)
R (reset Event
Log register to
0x00)
DE:0x0
Diagnostic
Mask
Display/Set Diagnostic Events
Mask register
See list of the Diagnostic
Events below.
4
DM
NO ARGUMENT
(read current
Diagnostic Events
Mask register)
DM:0x9FFF
0x9FFF – diagnostic mask
(16 bits wide).
Set bit - Enable
Clear bit - Disable
<Value>
0x0000
To 0xFFFF
NOTE: all 6
characters are
required
DM:0x9FFF
7.3 ASCII Commands Set
Page 69

64
COMMAND
NAME
DESCRIPTION
NO.
COMMAND SYNTAX
COMMAND ARGUMENT 1 ARGUMENT 2 ARGUMENT 3 ARGUMENT 4 RESPONSE
Meter Info
Requests meter configuration
info:
- full scale range (L/min)
- RTD option support(Y,N)
- Analog Flow Output
configuration (V,C)
- Analog Temp. Output
configuration (V,C)
5
MI
MI: 18.92706,Y,V,V
Y – RTD support
N – No RTD support
V – 0-5 Vdc output
C – 4-20mA output
Flow Alarms
Sets / reads the status of the
flow alarms.
Note: High and Low limits
have to be entered in the
%F.S. High alarm value has to
be more than Low alarm
value.
Alarm conditions:
Flow > High Limit = H
Flow < Low Limit = L
Low < Flow < High = N
6 FA
H (high flow limit)
<Value>(0-100%FS)
FAH:<Value (%F.S.)>
L (low flow limit)
<Value>(0-100%FS) FAL:<Value (%F.S.)>
A (action delay in
seconds)
<Value> (0-3600
sec.)
FAA:<Value (sec)>
E (enable alarm)
FA:E
D (disable alarm)*
FA:D
R (read current
status)
FA:N (no alarm)
FA:H (high alarm)
FA:L (low alarm)
S (Read current
settings)
FAS:M,L,H,D,B where:
M – mode (E/D)
L – Low settings (%FS)
H – High settings (%FS)
D – Action Delay (sec)
B – Latch mode (0-3)
B Block (Latch)
mode
<Value>
(0-disabled*)
(1-enabl’d L)
(2-enabl’d H)
(3 –both L,H)
FAB:<Value> where:
Value = 0 – 3
Page 70

65
COMMAND
NAME
DESCRIPTION
NO.
COMMAND SYNTAX
COMMAND
ARGUMENT 1
ARGUMENT 2 ARGUMENT 3 ARGUMENT 4 RESPONSE
Temperature
Alarms**
Sets / reads the status of the
temperature alarms.
Note: High and Low limits
have to be entered in the °C.
High alarm value has to be
more than Low alarm value.
Alarm conditions:
Temp. > High Limit = H
Temp. < Low Limit = L
Low < Temp. < High = N
7 TA
H (high flow limit)
<Value>
(-10.1-100°C)
TAH:<Value (°C)>
L (low flow limit)
<Value>
(-10.1-100 °C)
TAL:<Value (°C)>
A (action delay in
seconds)
<Value> (0-3600
sec.)
TAA:<Value (sec)>
E (enable alarm) TA:E
D (disable alarm)* TA:D
R (read current
status)
TA:N (no alarm)
TA:H (high alarm)
TA: L (low alarm)
S (Read current
settings)
TAS:M,L,H,D,B where:
M – mode (E/D)
L – Low settings (°C)
H – High settings (°C)
D – Action Delay (sec)
B – Latch mode (0-3)
B Block (Latch)
mode
<Value>
(0-disabled*)
(1-enabl’d L)
(2-enabl’d H)
(3 –both L,H)
TAB:<Value> where:
Value = 0 – 3
Page 71

66
COMMAND
NAME
DESCRIPTION
NO.
COMMAND SYNTAX
COMMAND ARGUMENT 1 ARGUMENT 2
ARGUMENT 3
ARGUMENT 4
RESPONSE
Optical
Outputs
Assigns action of the two
optical outputs. The optical
output becomes active when
the condition specified by an
Argument 2 becomes true.
Argument 2:
D - no action, disabled*
FL - low flow alarm
FH - high flow alarm
FR - Range between High &
Low alarms
MT - main tot. reading > limit
PT - pilot tot. reading > limit
TL - low temp. alarm
TH - high temp. alarm
TR - Range between High &
Low temp. alarms
MC - Manual On Control
DE - Diagnostic Events
8 O
1 (output #1)
2 (output #2)
D * O1:D or O2:D
FL
O1:FL or O2:FL
FH
O1:FH or O2:FH
FR
O1:FR or O2:FR
MT
O1:MT or O2:MT
PT
O1:PT or O2:PT
TL
O1:TL or O2:TL
TH
O1:TH or O2:TH
TR
O1:TR or O2:TR
DE
O1:DE or O2:DE
MC
O1:MC or O2:MC
S (read
current
settings)
Ox:D
Main
Totalizer
Sets and controls action of the
Main flow totalizer.
NOTE:
Main Totalizer reading is
stored in EEPROM (non
volatile) memory. Power cycle
will not affect Main Totalizer
reading.
9
MT
Z (Reset to zero)
MTZ
F (start totalizer
at flow %F.S.)
MTF:<value>
L (Limit gas
volume in
current E.U.)
MTL:<value>
D (disable
totalizer)*
MT:D
E(enable totalizer)
MT:E
R(read current
totalizer volume)
MTR:<value>
(in current EU)
S(setting status)
MTS:Mode,Start,Limit
Page 72

67
COMMAND
NAME
DESCRIPTION
NO.
COMMAND SYNTAX
COMMAND ARGUMENT 1
ARGUMENT 2 ARGUMENT 3
ARGUMENT 4 RESPONSE
Pilot
Totalizer
Sets and controls action of
the Pilot flow totalizer.
NOTE:
Pilot Totalizer reading is
stored in SRAM (volatile)
memory. Power cycle will
reset Pilot Totalizer reading
to zero.
10
PT
Z (Reset to zero) PTZ
F (start totalizer
at flow %F.S.)
<value>
(flow %FS)
PTF:<value>
L (Limit gas
volume in
current E.U.)
<value>
(gas volume)
PTL:<value>
D (disable
totalizer)*
PT:D
E (enable
totalizer)
PT:E
R (read current
totalizer volume)
PTR:<value>
(in current EU)
S (setting status)
PTS: Mode, Start, Limit
Low Flow
Cut Off
Display /Change Meter Low
Flow Cut Off settings in %F.S.
11
CO
<Cut off Value>
(0 to 10.0%)
CO:<Cut off Value>
Example: CO:2.0
No Argument
(Returns Current
Cut off Value
settings)
CO:<Cut off Value>
Example: CO:2.0
Fluid
Density
Read and set Fluid Density in
g/cm3
12
FD
(New Density
Value) 0.01
Density 5.0
g/cm3
FD:<value>
No Argument
(Returns Current
Density in g/cm3)
FD:<value>
Example: FD:1.000
Page 73

68
COMMAND
NAME
DESCRIPTION
NO.
COMMAND SYNTAX
COMMAND
ARGUMENT 1 ARGUMENT 2
ARGUMENT 3 ARGUMENT 4 RESPONSE
Units
Set the units of measure for
gas flow and totalizer reading.
Note: The units of the totalizer
output are not per unit time.
For user defined units:
k-factor value represents
conversion value from L/min.
Time base argument:
S – seconds
M – minutes
H – hours
Density argument:
Y – use density
N – do not use density
13 U
%(% full scale)*
U:%
mL/sec
U:mL/sec
mL/min U:mL/min
mL/hr
U:mL/hr
L/sec U:L/sec
L/min U:L/min
L/hr
U:L/hr
m3/sec
U:m3/sec
m3/min U:m3/min
m3/hr
U:m3/hr
f3/sec
U:f3/sec
f3/min
U:f3/min
f3/hr
U:f3/hr
g/sec U:g/sec
g/min U:g/min
g/hr U:g/hr
kg/sec U:kg/sec
kg/min U:kg/min
kg/hr
U:kg/hr
Lb/sec
U:Lb/sec
Lb/min
U:Lb/min
Lb/hr U:Lb/hr
Gl/sec U:Gl/sec
Gl/min U:Gl/min
Gal/hr U:Gal/hr
t/sec
U:t/sec
t/min U:t/min
t/hr U:t/hr
USER (user defined) U:USER,<F>,<T>,<D>
No Argument
(status)
U,<EU name>
Page 74

69
COMMAND
NAME
DESCRIPTION
NO.
COMMAND SYNTAX
COMMAND ARGUMENT 1 ARGUMENT 2 ARGUMENT 3
ARGUMENT 4
RESPONSE
Maintenance
Timer
Hours since last time unit was
calibrated.
NOTE: has to be reset to zero
after calibration.
14
C
R (read timer)
CR:<value>
Z (set timer to
zero)
CZ
Pulse
Measure
Interval
Display/Change Meter Pulse
Measure Interval settings
Note: Pulse Measure Interval
has to be in the range:
500mS MI 60000 mS
15
I
<new value> in
mS
I:<value>
Example: I:2000
No Argument
(Returns Current
MI settings in mS)
I:<value>
Example: I:2000
Flow
Measure
Mode
Display/Change Meter Flow
Measuring Mode
Following measurement
modes are supported:
W - Pulse Width
C - Number of Pulses per
measure interval
16 MM
<New Mode>
W - Pulse Width*
C - # of Pulses
MM:<value>
Example: MM:W
No Argument
(Returns Current
settings)
MM:<value>
Example: MM:W
Flow Meter
Linearizer
Enable/Disable flow meter
Linearizer
17
FL
<New Value>
E or D
FL:<value>
Example: FL:E
No Argument
(Returns Current
Linearizer settings)
FL:<value>
Example: FL:E
LCD Back
Light**
Display/Change LCD Back
Light settings
Note: LCD Back Light settings
has to be in the range:
0% BL 80%
18 BL
(New LCD Back
Light value)
0 - 80%
BL: <BL Value>
Example: BL:50
No Argument
(Returns Current
LCD Back Light
settings)
BL: < BL Value >
Example: BL:50
Page 75

70
COMMAND
NAME
DESCRIPTION
NO.
COMMAND SYNTAX
COMMAND
ARGUMENT 1
ARGUMENT 2
ARGUMENT 3 ARGUMENT 4
RESPONSE
Noise
Reduction
Filter
Noise Reduction Filter
parameter settings. Following
arguments supported:
T - Running Average Time
Interval (0-99 seconds)
N -Running Average Number
of samples (1-32)
19 NR
T (time interval) NRT:5
N (number of
samples)
NRN:5
S (status) NR:5,5
Read
EEPROM
Memory
Reads the value in the
specified memory location.
20
MR
0 to 100
(Memory Table
Index)
<memory value>
Write
EEPROM
Memory
Writes the specified value to
the specified memory
location. Use Carefully, can
cause unit to malfunction.
(Note: Some addresses are
write protected!)
21 MW
20 to 100
(Memory Table
Index)
Value
MW,XXX,<Value>
where:
XXX=Table Index
Example:
MW,100,”Meter#6”
UART Error Codes:
1 - Not Supported Command or Back Door is not enabled.
2 - Wrong # of Arguments.
3 - Address is Out of Range (MR or MW commands).
4 - Wrong # of the characters in the Argument.
5 - Attempt to Alter Write Protected Area in the EEPROM.
6 - Proper Command or Argument is not found.
7 - Wrong value of the Argument.
8 - Reserved.
9 - Manufacture specific info EE KEY (wrong key or key is disabled).
Diagnostic events codes and bit position:
1. CPU Temp. High 0
2. Flow > 125% F.S. 1
3. High Flow Alarm 2
4. Low Flow Alarm 3
5. High Temperature Alarm 4
6. Low Temperature Alarm 5
7. Temperature Above Limit 6
8. Temperature Below Limit 7
9. Main Totalizer Limit 8
10. Pilot Totalizer Limit 9
11. EEPROM Failure A
12. DC/DC converter Voltage too High B
13. DC/DC converter Voltage too Low C
14. Communication Error D
15. Reserved E
16. Fatal ERROR F
Page 76

71
8. TROUBLESHOOTING
8.1 Common Conditions
Your PWE Flow Meter was thoroughly checked at numerous quality control points
during and after manufacturing and assembly operations. It was calibrated according to your desired flow and pressure conditions for a given fluid. It was carefully
packed to prevent damage during shipment. Should you feel that
the instrument is not functioning properly, please check for the following common
conditions first:
Are all cables connected correctly? Are there any leaks in the installation? Is the
power supply correctly selected according to requirements? When several meters
are used a power supply with appropriate current rating should be selected. Were
the connector pinouts matched properly? When interchanging with other
manufacturers' equipment, cables and connectors must be carefully wired for correct pin configurations. Is the pressure differential across the instrument sufficient?
No INDICATION LIKELY REASON SOLUTION
1
LCD Display remains blank
when unit is powered up.
No response when flow is
introduced from analog
outputs 0-5 Vdc or 4-20
mA.
Power supply is bad or
polarity is reversed.
Measure voltage on pins A and B
of the 12 pin M16 connector. If
voltage is out of specified range,
then replace power supply with a
new one. If polarity is reversed
(reading is negative) make correct
connection.
PC board is defective. Return PWE to factory for repair.
2 LCD Display reading or
/and flow analog output 05Vdc signal fluctuate in
wide range during flow
measurement.
Flow output 0-5 Vdc signal
(pin L of the 12 pin M16 connector) is shorted on the GND
or overloaded.
Check external connections to pin
L of the 12 pin M16 connector.
Make sure the load resistance of
the equipment connected to the
flow 0-5 Vdc output is more than
1000 Ohm.
3 LCD Display reading or
/and temperature analog
output 0-5Vdc signal fluctuate in wide range during
flow measurement.
Temperature output 0-5 Vdc
signal (pin M of the 12 pin
M16 connector) is shorted on
the GND or overloaded.
Check external connections to pin
M of the 12 pin M16 connector.
Make sure the load resistance of
the equipment connected to the
flow 0-5 Vdc output is more than
1000 Ohm.
4 LCD Display reading does
correspond to the correct
flow range, but 0-5 Vdc
output signal does not
change (always the same
reading or around zero).
Output 0-5Vdc schematic is
burned out or damaged.
Return PWE to factory for repair.
Analog flow output scale and
offset variable are corrupted.
Restore original EEPROM scale and
offset variable or perform analog
output recalibration (see section
5.2).
Page 77

72
No INDICATION LIKELY REASON SOLUTION
5 LCD Display flow reading
and 0-5 Vdc output voltage
do correspond to the
correct flow range, but 4-20
mA output signal does not
change (always the same or
reading around 4.0 mA).
External loop is open or load
resistance more than 500
Ohm.
Check external connections to pins
L and K of the 12 pin M16 connector. Make sure the loop resistance
is less than 500 Ohm.
Flow output 4-20 mA schematic is burned out or damaged.
Return PWE to factory for repair.
6 LCD Display temperature
reading and 0-5 Vdc output voltage do correspond
to the correct flow range,
but 4-20 mA output signal
does not change (always
the same or reading
around 4.0 mA).
External loop is open or load
resistance more than 500
Ohm.
Check external connections to pins
M and K of the 12 pin M16 connector. Make sure the loop resistance
is less than 500 Ohm
Temperature output 4-20 mA
schematic is burned out or
damaged.
Return PWE to factory for repair.
7 Fluid flows through the PWE
meter and Paddle Wheel is
turning, but LCD Display
reading and the flow output
voltage 0-5 Vdc signal do
not respond to flow.
The fluid flow rate is below set
Low flow cut-off value.
Check settings for Low flow cut-off
value and make required
adjustment.
Sensor or PC board is
defective.
Return PWE to factory for repair.
8 Fluid flows through the
PWE meter and Paddle
Wheel is turning, but LCD
Display reading and the
flow output voltage 0-5
Vdc signal do not respond
to flow. There is no pulse
output signals from pin C
of the 12 pin M16
connector.
PWE magnetic sensor is
defective
Replace PWE magnetic sensor.
Paddle Wheel magnets are
defective
Replace PWE Paddle Wheel
9 The Temperature reading on
the LCD and analog 0-5 Vdc
or 4-20 mA is not correct
(out of the device measurement range: -10 to 70C)
RTD connector got loose and
is not connected to the PCB
board.
Check RTD connector, make sure it
is firmly attached to the header J2
on the PCB.
RTD sensor is defective Replace RTD sensor
10 The PWE Diagnostic Alarm
Event with code
0 – “CPU Temp. High” is
active.
MCU temperature is too high
(overload).
Disconnect power from the PWE.
Make sure the ambient temperature
is within specified range (below 70°
C). Let the device cool down for at
least 15 minutes. Apply power to the
PWE and check Diagnostic Alarm
Event. If overload condition will be
indicated again the unit has to be
returned to the factory for repair.
11 The PWE Diagnostic Alarm
Event with code F - “Fatal
Error” is active.
Fatal Error (EEPROM or SRAM
corrupted)
Cycle the power on the PWE. If
Diagnostic Alarm Event with code F
indicating again the unit has to be
returned to the factory for repair.
Page 78

73
APPENDIX I
AALBORG7 PWE Flow Meter EEPROM Variables Rev:A002 [10/01/2009]
Note: indexes 0-19 are write protected (manufacture and calibration specific data)
INDEX NAME DATA TYPE
NOTES
0 BlankEEPROM[10]
char[10] Do not modify. Table Revision [PROTECTED]
1
SerialNumber[20]
char[20] Serial Number [PROTECTED]
2
ModelNumber[20]
char[20] Model Number [PROTECTED]
3
SoftwareVer[10]
char[10] Firmware Version [PROTECTED]
4
ManufReservedF1
float Manufacture Specific float data [PROTECTED]
5
ManufReservedF2
float Manufacture Specific float data [PROTECTED]
6 MeterCalFactorM
float
Manufacture Assigned Number of Pulses per Gallon
[PROTECTED]
7
MeterSize
float Size of the meter’s flow tube [mm] [PROTECTED]
8
ReservedText[12]
char[12]
Reserved for Manufacture Specific Text Info
[PROTECTED]
9
ManufReservedF3
float Manufacture Specific float data [PROTECTED]
10
ManufReservedF4
float Manufacture Specific float data [PROTECTED]
11
ManufReservedF5
float Manufacture Specific float data [PROTECTED]
12
ManufReservedF6
float Manufacture Specific float data [PROTECTED]
13
ManufReservedUI1
uint Manufacture Specific uint data [PROTECTED]
14
ManufReservedUI2
uint Manufacture Specific uint data [PROTECTED]
15
ManufReservedUI3
uint Manufacture Specific uint data [PROTECTED]
16
ManufReservedUI4
uint Manufacture Specific uint data [PROTECTED]
17
ManufReservedSI1
int Manufacture Specific int data [PROTECTED]
18
ManufReservedSI2
int Manufacture Specific int data [PROTECTED]
19
ManufReservedSI3
int Manufacture Specific int data [PROTECTED]
20
TimeSinceCalHr
float Time elapsed since last calibration in hours
21
ProtectionCode
uint Program Parameters Protection Code [0-255]
22
BackLight
int Back Light Level [0-4095]**
23
BackLightMode
int Back Light Mode (E-Enable/D-Disable)**
24
LCD_Diagnostic
uint LCD Diagnostic Mode: [0, 1]
25
Address485
char[4]
Two hexadecimal characters address for RS485
only [01-FF]
26
FlowUnits
int Current Units of Measure [0-28]
27
AlarmMode
uint Flow Alarm Mode (0=Disabled, 1=Enabled)
28
LowAlarmPFS
float Low Flow Alarm Setting [%FS] 0-Disabled
29
HiAlarmPFS
float High Flow Alarm Setting [%FS] 0-Disabled
30
AlmDelay
uint Flow Alarm Action Delay [0-3600sec] 0-Disabled
31
RelaySetting
char[4] Relays Assignment Setting**
32
TotalMode
uint Totalizer Mode [1- Enabled, 0 - Disabled]
Page 79

74
INDEX NAME DATA TYPE NOTES
33
TotalFlowStart float Start Main Totalizer at flow [%FS] 0 - Disabled
34
TotalVolStop float
Main Totalizer Action Limit Volume [%*s]
0- Disabled
35
TotalConfLock uint
Key Pad Totalizer reset access Lock [0 – Disabled, 1
– Enabled]
36
UDUnitKfactor float K-Factor for User Defined Units of Measure
37
UDUnitTimeBase int K-Factor = UDUnit/(L/min)
38
UDUnitDensity uint User Defined Unit Time Base [1, 60, 3600 sec]
39
FoutScaleV float
User Defined Unit Density Flag
[0-not used, 1 - used]
40
FoutOffsetV float Flow Analog 0-5 Vdc Out Scale
41
FoutScalet_mA float Flow Analog 0-5 Vdc Out Offset
42
FoutOffset_mA float
Flow Analog 4-20 mA Out Scale
43
ToutScaleV float Temperature Analog 0-5 Vdc Out Scale**
44
ToutOffsetV float
Temperature Analog 0-5 Vdc Out Offset**
45
ToutScalet_mA float Temperature Analog 4-20 mA Out Scale**
46
ToutOffset_mA float Temperature Analog 4-20 mA Out Offset**
47
FlowMeasureMode uint
0-Pulse width measure, 1 - Number of Pulses per
measure interval
48
OptOut1_Config uint
Optical Output #1 Configuration (function) [0-10]
49
OptOut2_Config uint
Optical Output #2 Configuration (function) [0-10]
50
RTD_LinearMode uint
RTD Linearizer (0-Disabled, 1-Enabled)**
51
AlarmLatch uint
Alarm Latch settings [0-3]
52
PTotalMode uint
Pilot Totalizer mode (0-Disabled, 1-Enabled)
53
Reserved uint
Reserved
54
PTotalFlowStart float
Start Pilot Totalizer at flow [%FS] 0 - Disabled
55
PTotalVolStop float
Pilot Totalizer Action Limit Volume [%*s]
0-Disabled
56
MeterFSRange float
Meter Full Scale range in L/min
57
LowFlowCutOff float
Low Flow cut off. Must be between 0 and 10.0
%F.S.
58
Damping uint Flow Reading Damping 1-99 seconds
59
Density float Fluid Density g/cm3 [0.01 - 5.00000 g/cm3]
60
PulseMeasInt uint Flow Pulse Measure Interval in mS [500-60000]
61
MeterCalFactor uint Calibration Factor:Number of Pulses per Gallon
62
FlowTbl[0].FlowPFS float Flow Linearizer Index 0 PFS (must be 0.0)
63
FlowTbl[0].LinCounts uint Flow Linearizer Index 0 Counts (must be 0)
64
FlowTbl[1].FlowPFS float Flow Linearizer Index 1 PFS [0.0 – 1.0]
65
FlowTbl[1].LinCounts uint Flow Linearizer Index 1 Counts
66
FlowTbl[2].FlowPFS float Flow Linearizer Index 2 PFS [0.0 – 1.0]
67
FlowTbl[2].LinCounts
uint
Flow Linearizer Index 2 Counts
Page 80

75
INDEX NAME DATA TYPE NOTES
68
FlowTbl[3].FlowPFS float Flow Linearizer Index 3 PFS [0.0 – 1.0]
69 FlowTbl[3].LinCounts uint Flow Linearizer Index 3 Counts
70
FlowTbl[4].FlowPFS float Flow Linearizer Index 4 PFS [0.0 – 1.0]
71
FlowTbl[4].LinCounts uint Flow Linearizer Index 4 Counts
72
FlowTbl[5].FlowPFS float Flow Linearizer Index 5 PFS [0.0 – 1.0]
73
FlowTbl[5].LinCounts uint Flow Linearizer Index 5 Counts
74
FlowTbl[6].FlowPFS float Flow Linearizer Index 6 PFS [0.0 – 1.0]
75
FlowTbl[6].LinCounts uint Flow Linearizer Index 6 Counts
76
FlowTbl[7].FlowPFS float Flow Linearizer Index 7 PFS [0.0 – 1.0]
77
FlowTbl[7].LinCounts uint Flow Linearizer Index 7 Counts
78
FlowTbl[8].FlowPFS float Flow Linearizer Index 8 PFS [0.0 – 1.0]
79
FlowTbl[8].LinCounts uint Flow Linearizer Index 8 Counts
80
FlowTbl[9].FlowPFS float Flow Linearizer Index 9 PFS [0.0 – 1.0]
81
FlowTbl[9].LinCounts uint Flow Linearizer Index 9 Counts
82
FlowTbl[10].FlowPFS float Flow Linearizer Index 10 PFS [0.0 – 1.0]
83
FlowTbl[10].LinCounts uint Flow Linearizer Index 10 Counts
84
T_InScale float Temperature RTD input Scale**
85
T_InOffset float Temperature RTD input Offset**
86
T_Mode float Reserved**
87
DiagEventMask
uint
Mask for Diagnostic Events: Clear bit-> mask corre
sponding event. Default mask is 0xFFFFh
88
FlowLinearizer uint Flow Linearizer (0-Disabled, 1-Enabled)
89
T_AlarmMode uint Temp. Alarm Mode (0=Disabled, 1=Enabled)**
90
T_AlarmDelay uint Delay in seconds 0-3600 for Tem.Alarm action**
91
T_AlarmLatch uint Temp Alarm Latch 0-3**
92
T_LowAlarm_C float Low Temperature Alarm in %FS [-.1-1]**
93
T_HiAlarm_C float High Temperature Alarm in %FS [-.1-1]**
94
ReservedF3 float Reserved
95
FluidName[20] char[20] Name of the Liquid used for Calibration
96
CalibratedBy[20] char[20] Name of person, meter was calibrated by
97
CalibratedAt[20] char[20] Name of the Calibration Lab
98
DateCalibrated[12] char[12] Calibration date
99 DateCalibrationDue[12] char[12] Date calibration due
100 UserTagName char[20] User Defined Device Tag Name or Number
101 EEMagicNumber uint Number used to verify EEPROM integrity
** Not supported in some hardware configurations
Page 81

76
APPENDIX II
Component Diagram Top Side
Component Diagram Bottom Side
Page 82

77
APPENDIX III
Dimensional Drawing
Page 83

WARRANTY
Aalborg7 Flow Systems are warranted against parts and workmanship for
a period of one year from the date of purchase. Calibrations are warranted
for up to six months after date of purchase, provided calibration seals have
not been tampered with. It is assumed that equipment selected by the customer is constructed of materials compatible with gases used. Proper
selection is the responsibility of the customer. It is understood that gases
under pressure present inherent hazards to the user and to equipment, and
it is deemed the responsibility of the customer that only operators with
basic knowledge of the equipment and its limitations are permitted to control and operate the equipment covered by this warranty. Anything to the
contrary will automatically void the liability of Aalborg7 and the provisions
of this warranty. Defective products will be repaired or replaced solely at
the discretion of Aalborg7 at no charge. Shipping charges are borne by the
customer. This warranty is void if the equipment is damaged by accident
or misuse, or has been repaired or modified by anyone other than Aalborg7
or factory authorized service facility. This warranty defines the obligation of
Aalborg7 and no other warranties expressed or implied are recognized.
TRADEMARKS
Aalborg7 is a registered trademark of Aalborg Instruments.
Buna7 is a registered trademark of DuPont Dow Elastometers.
Kalrez7 is a registered trademark of DuPont Dow Elastomers.
VCR7 is a registered trademark of Swaglok Marketing Co.
Viton7 is a registered trademark of Dupont Dow Elastometers L.L.C.
APPENDIX IV
CAUTION:
This product is not intended to be used in life support applications!
78
 Loading...