

Page 1

Personal Ozone Monitor Manual Rev. E-2
i
Personal Ozone Monitor™
2B Technologies, Inc.
OPERATION MANUAL
Model POM™
© Copyright 2016, 2B Technologies, Inc.
All rights reserved.
Technical Support:
www.twobtech.com/techsupport
+1(303)273-0559
Page 2

Personal Ozone Monitor Manual Rev. E-2
ii
Contents
IDENTIFICATION RECORDS iv
PRINTING HISTORY v
WARRANTY STATEMENT vi
WARNINGS viii
1. PERSONAL OZONE MONITOR INTRODUCTION 1
1.1. Theory of Operation ................................................................................................................. 1
1.2. Adaptive Filter .......................................................................................................................... 4
2. SPECIFICATIONS 5
2.1. Overview .................................................................................................................................. 5
2.2. Table of Specifications: Personal Ozone Monitor (PAM) ........................................................ 6
3. OPERATION 7
3.1. Shipping Box Contents ............................................................................................................ 7
3.2. Operation of the Personal Ozone Monitor ............................................................................... 7
3.3. Measurement of the Zero Offset ............................................................................................. 8
3.4. Collecting Data over the USB Port or Serial Port in Real Time............................................... 8
4. GPS 9
5. FRONT PANEL MENU 10
5.1. Menu Tree ............................................................................................................................. 10
5.2. Data Averaging and Data Logging Using the Menu .............................................................. 11
5.3. Navigating the Front Panel Menu .......................................................................................... 11
5.4. Entering the Front Panel Menu ............................................................................................. 11
5.5. Acquiring Data without Logging ............................................................................................. 11
5.6. To Begin Logging Data .......................................................................................................... 12
5.7. To Stop Logging Data............................................................................................................ 13
5.8. To Average Data ................................................................................................................... 14
5.9. Capturing the Transmitted Logged Data Using the USB or Serial Port ................................ 14
5.10. To Set the Calibration Parameters ........................................................................................ 15
5.11. To Set the Time and Date ..................................................................................................... 16
5.12. Viewing the Power Supply Voltage via the Front Panel ........................................................ 16
5.13. Viewing GPS Coordinates via the Front Panel ..................................................................... 16
6. LAMP TEST 17
7. QUIET MODE 18
8. SERIAL AND USB MENU 18
9. USB INSTALLATION 20
9.1. Items Required ...................................................................................................................... 20
9.2. Driver Installation ................................................................................................................... 20
10. USING THE USB CONNECTION 23
10.1. Determine the Connection Port ............................................................................................. 23
Page 3

Personal Ozone Monitor Manual Rev. E-2
iii
10.2. Using the Connection ............................................................................................................ 24
11. CALIBRATION 25
11.1. Overview ................................................................................................................................ 25
11.2. Equipment Required .............................................................................................................. 26
11.3. Instrument Preparation .......................................................................................................... 26
11.4. Calibration Setup Preparation ............................................................................................... 26
11.4.1. Setup Check ............................................................................................................. 27
11.4.2. Ozone Loss Test ...................................................................................................... 27
11.4.3. Linearity Check......................................................................................................... 27
11.4.4. Intercomparison Test ............................................................................................... 28
12. CALIBRATION PROCEDURE 28
12.1. Instrument Preparation .......................................................................................................... 28
12.2. Measurement of Zero Air ....................................................................................................... 28
12.3. Measurement of Ozone Standards ....................................................................................... 29
12.4. Calibration Curve ................................................................................................................... 29
12.5. Periodic Zero and Span Checks ............................................................................................ 29
13. MAINTENANCE/TROUBLESHOOTING 31
14. LABELED INSTRUMENT PHOTOS 34
15. PARTS LIST 37
16. SERVICE LOG 38
Appendix A: Using the 2B Technologies Display and Graphing Software 40
Page 4

Personal Ozone Monitor Manual Rev. E-2
iv
IDENTIFICATION RECORDS
Record the following information for future reference:
Serial number: ______________________________________
Warranty start date: _______________________________________
(date of receipt)
Page 5

Personal Ozone Monitor Manual Rev. E-2
v
PRINTING HISTORY
This manual covers the Personal Ozone Monitor (POM) used for measurement of
ozone concentrations in air. New editions of this manual are complete revisions that
reflect updates to the instrument itself, as well as clarifications, additions, and other
modifications of the text.
Revision A ................................................................................................... March 2012
Revision B ................................................................................................. January 2014
Revision C ............................................................................................... February 2014
Revision D ...................................................................................................... April 2015
Revision E .................................................................................................. August 2016
Rev E-2....................................................................................................... August 2017
(Correction to Equation 2 on page 2; added information in Sections 5.6, 5.8, and 5.10; minor
formatting changes.)
TRADEMARKS & PATENTS
2B Technologies, 2B Tech, 2B, Personal Ozone Monitor and POM are
trademarks of 2B Technologies, Inc.
CONFIDENTIALITY
The information contained in this manual may be confidential and proprietary, and is the
property of 2B Technologies, Inc. Information disclosed herein shall not be used to
manufacture, construct, or otherwise reproduce the goods disclosed herein. The
information disclosed herein shall not be disclosed to others or made public in any
manner without the expressed written consent of 2B Technologies, Inc.
© Copyright 2B Technologies, Inc.
All rights reserved.
Page 6

Personal Ozone Monitor Manual Rev. E-2
vi
WARRANTY STATEMENT
2B Technologies, Inc. warrants its products against defects in materials and
workmanship. 2B Technologies will, at its option, repair or replace products that prove
to be defective. The warranty set forth is exclusive and no other warranty, whether
written or oral, is expressed or implied. 2B Technologies specifically disclaims the
implied warranties of merchantability and fitness for a particular purpose.
Warranty Period
The warranty period is one (1) year from date of receipt by the purchaser, but in no
event more than thirteen (13) months from original invoice date from 2B Technologies,
Inc.
Warranty Service
Warranty Service is provided to customers via web ticket, email and phone support,
Monday - Friday, from 9:00 a.m. to 5:00 p.m., Mountain Time USA. The preferred
method of contacting us is through our web ticketing software at:
www.twobtech.com/techsupport
This way all technical staff at 2B Tech will be alerted of your problem and be able to
respond. When you receive an email reply, please click on the Ticket link provided to
continue to communicate with us directly over the internet. The web ticket approach
to customer service allows us to better track your problem and be certain that you get
a timely response. We at 2B Tech pride ourselves on the excellent customer service
we provide.
You may also contact us by email at [email protected] or by phone at
+1(303)273-0559. In either case, a web ticket will be created, and future
communications with you will be through that ticket.
Initial support involves trouble-shooting and determination of parts to be shipped from
2B Technologies to the customer in order to return the product to operation within
stated specifications. If such support is not efficient and effective, the product may be
returned to 2B Technologies for repair or replacement. Prior to returning the product,
a Repair Authorization Number (RA) must be obtained from the 2B Technologies
Service Department. We will provide you with a simple Repair Authorization Form to
fill out to return with the instrument.
Page 7

Personal Ozone Monitor Manual Rev. E-2
vii
Shipping
2B Technologies will pay freight charges for replacement or repaired products shipped
to the customer site. Customers shall pay freight charges for all products returning to
2B Technologies.
Conditions
The foregoing warranty shall not apply to defects resulting from improper or
inadequate maintenance, adjustment, calibration or operation by customer.
Maintenance, adjustment, calibration or operation must be performed in accordance
with instructions stated in this manual. Usage of maintenance materials purchased
from suppliers other than 2B Technologies will void this warranty.
Limitation of Remedies and Liability
The remedies provided herein are the Customer's sole and exclusive remedies. In no
event shall 2B Technologies be liable for direct, indirect, special, incidental or
consequential damages (including loss of profits) whether based on contract, tort or
any other legal theory. The Personal Ozone Monitor manual is believed to be
accurate at the time of publication and no responsibility is taken for any errors that
may be present. In no event shall 2B Technologies be liable for incidental or
consequential damages in connection with or arising from the use of the Personal
Ozone Monitor manual and its accompanying related materials. Warranty is valid only
for the country designated on the 2B Technologies quote or invoice.
Page 8

Personal Ozone Monitor Manual Rev. E-2
viii
WARNINGS
ENGLISH
WARNING:
Any operation requiring access to the inside of the equipment, could result
in injury. To avoid potentially dangerous shock, disconnect from power
supply before opening the equipment.
WARNING:
This symbol, on the instrument indicates that the user should refer to
the manual for operating instructions.
WARNING:
If this instrument is used in a manner not specified by 2B Technologies,
Inc. USA, the protection provided by the instrument may be impaired.
ESPAÑOL
ATENCION:
Cualquier operación que requiera acceso al interior del equipo, puede
causar una lesión. Para evitar peligros potenciales, desconectarlo de la
alimentación a red antes de abrir el equipo.
ATENCION:
Este símbolo, en el instrumento indica que el usuario debería
referirse al manual para instrucciones de funcionamiento.
ATENCION:
Si este instrumento se usa de una forma no especificada por 2B
Technologies, Inc., USA, puede desactivarse la protección suministrada
por el instrumento.
FRANÇAIS
ATTENTION:
Chaque opération à l’intérieur de l’appareil, peut causer du préjudice. Afin
d’éviter un shock qui pourrait être dangereux, disconnectez l’appareil du
réseau avant de l’ouvrir.
ATTENTION:
Le symbol, indique que l’utilisateur doit consulter le manuel
d’instructions.
ATTENTION:
Si l’instrument n’est pas utilisé suivant les instructions de 2B Technologies,
Inc., USA, les dispositions de sécurité de l’appareil ne sont plus valables.
DEUTSCH
WARNHINWEIS:
Vor dem Öffnen des Gerätes Netzstecker ziehen!
WARNHINWEIS:
Dieses, auf dem Gerät weist darauf hin, dab der Anwender zuerst
das entsprechende Kapitel in der Bedienungsanleitung lesen sollte.
WARNHINWEIS:
Wenn das Gerät nicht wie durch die Firma 2B Technologies, Inc., USA,
vorgeschrieben und im Handbuch beschrieben betrieben wird, können
die im Gerät eingebauten Schutzvorrichtungen beeinträchtigt werden.
ITALIANO
ATTENZIONE:
Qualsiasi intervento debba essere effettuato sullo strumento può essere
potenzialmente pericoloso a causa della corrente elettrica.
Il cavo di alimentazione deve essere staccato dallo strumento prima della
sua apertura.
ATTENZIONE:
Il simbolo, sullo strumento avverte l’utilizzatore di consultare il
Manuale di Istruzioni alla sezione specifica.
ATTENZIONE:
Se questo strumento viene utilizzato in maniera non conforme alle
specifiche di 2B Technologies, Inc. USA, le protezioni di cui esso è dotato
potrebbero essere alterate.
CHINESE
警告:
任何需要接触设备内部的操作均可能造成人身伤害。为避免可能
的触电危险,请在打开设备前切断电源。
警告:
这个符号 在仪器上表示用户应参考说明书上的操作指南。
警告 :
如果仪器没有按照美国2B科技公司指定方式操作,仪器的保护性
能会减弱。
DUTCH
OPGELET:
Iedere handeling binnenin het toestel kan beschadiging veroorzaken.
Om iedere mogelijk gevaarlijke shock te vermijden moet de aansluiting
met het net verbroken worden, vóór het openen van het toestel.
OPGELET:
Het symbool, geeft aan dat de gebruiker de instructies in de
handleiding moet raadplegen.
OPGELET:
Indien het toestel niet gebruikt wordt volgens de richtlijnen van 2B
Technologies, Inc., USA gelden de veiligheidsvoorzieningen niet meer.
JAPANESE
警告:
機器の内部で操作する時、怪我できます。危険な衝撃を回避
するために、機器を開ける前に、電源を切断してください。
警告:
機器でこの記号 を見れば、マニュアルを読んでください。
警告:
この機器は2B テクノロジー会社、US A
の指定でしなければ、機器の保護が損なえます。
Page 9

Personal Ozone Monitor Manual Rev. E-2
1
1. PERSONAL OZONE MONITOR INTRODUCTION
The 2B Technologies Personal Ozone MonitorTM (POMTM) is designed to enable
accurate measurements of ozone in air over a wide dynamic range extending from a
limit of detection of 3 parts-per-billion by volume (ppb) to an upper limit of 10 partsper-million (ppm) based on the well-established technique of absorption of ultraviolet
light at 254 nm. Note that throughout this manual and in the instrument output, “ppb”
(identical to “ppbv”) refers to parts-per-billion by volume (not weight). The Personal
Ozone Monitor is small (4.0″ × 3.0″ × 1.5″; 10.2 × 7.6 × 3.9 cm), lightweight (0.75 lb;
0.34 kg) and has a low power consumption (3.0 watt) relative to conventional
instruments and is therefore well suited for applications such as:
• Long-term monitoring at remote locations where power is highly limited
• Monitoring and control of ozone in industrial settings
• Monitoring of exposure to individuals in the workplace
• Personal exposure monitoring for studies of health effects of air
pollutants
For aircraft flights where high temporal and spatial resolution is desired, the Model
205 Ozone Monitor is recommended.
1.1. Theory of Operation
Absorption of UV light has long been used for measurements of atmospheric ozone
with high precision and accuracy. The ozone molecule has an absorption maximum
at 254 nm, coincident with the principal emission wavelength of a low-pressure
mercury lamp. Fortunately, few molecules found at significant concentrations in the
atmosphere absorb at this wavelength. However, interferences, such as organic
compounds containing aromatic rings, can occur in highly polluted air. For additional
information about UV-absorbing interferences and how to estimate their contributions
see Tech Note #040.
Figure 1.1 is a schematic diagram of the Personal Ozone Monitor. Ozone is
measured based on the attenuation of light passing through a 15-cm absorption cell
fitted with quartz windows. The 15-cm cell length is accomplished by using a “U”
shaped cell with mirrors in the corners to transmit light from the lamp at one end to the
detector at the other. A low-pressure mercury lamp is located on one side of the
absorption cell, and a photodiode is located on the opposite side of the absorption
cell. The photodiode has a built-in interference filter centered on 254 nm, the principal
wavelength of light emitted by the mercury lamp. An air pump draws sample air into
the instrument at a flow rate of approximately 0.75 L/min. A solenoid valve switches
so as to alternately send this air directly into the absorption cell or through an ozone
scrubber and then into the absorption cell.
Page 10

Personal Ozone Monitor Manual Rev. E-2
2
Figure 1.1. Schematic Diagram of the Personal Ozone Monitor.
The intensity of light at the photodiode is measured in air that has passed through the
ozone scrubber (Io) and air that has not passed through the scrubber (I). Ozone
concentration, [O3], in units of molecules/cm3 is calculated from the measurements of
Io and I according to the Beer-Lambert Law:
(1)
where l is the path length (15 cm) and is the absorption cross section for ozone at
254 nm (1.15 x 10
-17
cm2 molecule-1 or 308 atm-1 cm-1), which is known with an
accuracy of approximately 1%. The 2B Technologies instrument uses the same
absorption cross section (extinction coefficient) as used in other commercial
instruments.
In order to convert this concentration to a mixing ratio (fraction of total air molecules
that are ozone, we also measure the cell temperature and pressure, which determines
the total concentration of air molecules. From the temperature and pressure, we use
the ideal gas law to calculate the concentration of molecules, M, in the detection cell.
Ozone in units of ppb is then given by:
(2)
where NA is Avogadro’s number (6.02214129 x 10²³ molec/mol), R is the gas constant
(82.05746 cm3 atm K
−1
mol
−1
), T is the absolute temperature in K, and P is the cell
pressure in atmospheres.
The instrument displays and records the cell temperature and pressure in addition to
the ozone mixing ratio. The cell pressure is displayed and logged in units of mbar or
torr and the cell temperature in units of either °C or K.
Page 11

Personal Ozone Monitor Manual Rev. E-2
3
Shown on Fig. 1 is the DewLine, which serves to make the humidity entering the
detection cell identical during I and Io measurements. Please see our website for a
technical discussion of the DewLine™ and its importance to ozone measurements:
www.twobtech.com/dewline.htm. Briefly, water vapor adsorbed to the inner wall of the
detection cell changes the reflectivity of the cell. If humidity is not the same during I
and Io measurements, an offset in the ozone measurement will occur and can be up to
several tens of ppb for sudden changes in ambient humidity. The offset will change
with time as the internal ozone scrubber equilibrates with water vapor. Even for fixedsite ozone monitors, an offset measurement error will occur if the instrument is zeroed
with dry tank air and then used to measure ozone in humid air. The DewLine
solution to this often-ignored problem is unique to 2B Tech instruments.
In principle, the measurement of ozone by UV absorption requires no external
calibration; it is an absolute method. However, non-linearity of the photodiode
response and electronics can result in a small measurement error. Therefore, each
instrument is compared with a NIST-traceable standard ozone photometer in the
laboratory over a wide range of ozone mixing ratios. These results are used to
calibrate the POM with respect to an offset and slope (gain or sensitivity). The
corrections for offset and slope are recorded in the instrument Birth Certificate. These
calibration parameters are entered into the microprocessor prior to shipment. The
user may change the calibration parameters from the front panel if desired. It is
recommended that the instrument be recalibrated at least once every year and
preferably once every six months. The offset may drift due to temperature change or
chemical contamination of the absorption cell. As discussed below, an accurate offset
correction can be measured from time to time using the external ozone scrubber
(Zeroing Cartridge) supplied with the instrument.
An animated video explaining how a UV-absorbance ozone monitor works is posted
on the 2B Tech website at: http://twobtech.com/videos_general.htm
Page 12

Personal Ozone Monitor Manual Rev. E-2
4
1.2. Adaptive Filter
The POM firmware processes sample concentration data through a built-in adaptive
filter. During operation, the firmware may automatically switch between two different
filter lengths based on the conditions at hand. During the measurement of stable
concentrations, the firmware, by default, computes an average of the last 50 raw (2second) measurements, or approximately 1.5 minutes. This provides smooth and
stable readings by averaging out a considerable amount of random noise to improve
the precision. If the filter detects rapid changes in concentration, the filter reduces the
averaging to only 10 samples or about 20 seconds to allow the analyzer to respond
more quickly. Two conditions must be simultaneously met to switch to the short filter.
First, the instantaneous concentration must differ from the average in the long filter by
at least 15 ppb. Second, the instantaneous concentration must differ from the
average in the long filter by at least 5% of the average in the long filter. The lengths of
the long and short filter can be changed as well as the minimum difference and
percent difference. This can be done via the serial or USB connection as outlined in
the Serial Menu section in this manual (Section 8).
As shipped from the factory, the default settings of the adaptive filter are: short filter
length = 10, long filter length = 50, difference = 15, and percent difference = 5%. To
disable the adaptive filter, set the short filter length to 1, the difference to 0, and the
percent to 0.
Page 13

Personal Ozone Monitor Manual Rev. E-2
5
2. SPECIFICATIONS
2.1. Overview
2B Tech has taken the next step in miniaturization of UV-based ozone monitors by
developing the Personal Ozone Monitor or “POM.” The POM has dimensions of 4 × 3
× 1.5 inches and weighs only 0.75 lb. (340 g). It has a built in GPS so that ozone
measurements may be logged continuously along with geographic location. By
folding the optical path in the shape of a “U,” it was possible to achieve the same path
length in the POM as in the Models 202, 205, and 106-L and thus have similar
precision and accuracy (~1.5 ppb or better). The POM’s many possible applications
include:
• Personal exposure monitoring for studies of health effects of air pollutants
• Health and safety monitoring at industrial sites using ozone
• Citizen science and educational measurements such as GO3 Treks
• Vertical profiling using balloons, kites, RPVs and light aircraft where space and
weight are highly limited
• Long-term monitoring at remote locations where power is highly limited
• Urban arrays of ground-based detectors
Detailed specifications are given in the table on the next page.
Page 14

Personal Ozone Monitor Manual Rev. E-2
6
2.2. Table of Specifications: Personal Ozone Monitor (PAM)
Measurement Principle
UV Absorption at 254 nm
Federal Equivalent Method (FEM)
Yes, EQOA-0815-227
Linear Dynamic Range
0 ppb to 10 ppm
Resolution
0.1 ppb
Precision (1σ; rms noise)
Greater of 1.5 ppb or 2% of reading
(10-s measurement mode, with default adaptive filter settings)
Limit of Detection (2σ)
3.0 ppb
(10-s measurement mode, with default adaptive filter settings)
Accuracy
Greater of 1.5 ppb or 2% of reading
NIST-Traceable Calibration
Yes
Measurement Intervals
Measurement mode: 10 s; Fast mode: 2s
Flow Rate (nominal)
~0.8 Liter/min
Flow Rate Requirement
>0.5 L/min
Baseline Drift
<2 ppb/day; <5 ppb/year
Sensitivity Drift
<1%/day; <3%/year
Measurement Time, Frequency
10 s, 0.1 Hz (Fast mode: 2s, 0.5 Hz)
Response Time, 100% of Step
Change
For 10-s output: 20 s, 2 data points
For 2-s output: 4s, 2 data points
Data Averaging Options
1 min, 5 min, 1 hr
Data Storage
8,192 lines (2-s fast mode ~4.6 hrs; 10-s meas. mode ~1
day; 1-min avg ~6 days; 5-min avg ~1 mo; 1-hr avg ~1 yr)
Ozone Units
ppb
Pressure Units
torr
Temperature Units
K
T and P Corrected
Yes
Operating Temperature/
Pressure/Altitude Ranges
0 to 50°C; 150-1013 mbar; 0-13.5 km
[lower pressure range available as an option]
Power Requirement;
Supplied by battery or 110/220
VAC Power Pack
7-24 V dc, nominally 250 mA at 12 V, 3.0 watt
External Battery
7.4 volt, 1.6 amp hour, Lithium Ion Battery, 5-8 hr
Size
With GPS: 5.5 × 3.0 × 1.5 inches (14.0 × 7.6 × 3.8 cm)
Without GPS: 4.0 × 3.0 × 1.5 inches (10.2 × 7.6 × 3.8 cm)
Weight
1.0 lb (454 g); without battery: 0.8 lb (360 g)
Data Transfer Baud Rate
19200
DewLineTM
Yes
GPS
Yes
Page 15

Personal Ozone Monitor Manual Rev. E-2
7
3. OPERATION
Please read all the following information before attempting to operate the Personal
Ozone Monitor. For assistance, please call 2B Technologies at +1(303)273-0559.
NOTE:
Save the shipping carton and packing materials that came with the
Personal Ozone Monitor. If the Personal Ozone Monitor must be returned
to the factory, pack it in the original carton. Any repairs as a result of
damage incurred during shipping will be charged.
3.1. Shipping Box Contents
Open the shipping box and verify that it contains all of the items on the shipping list. If
anything is missing or obviously damaged, contact 2B Technologies immediately.
3.2. Operation of the Personal Ozone Monitor
To operate the Personal Ozone Monitor, connect it to an external power source and
power the instrument by switching the power switch on. The instrument requires a 724 V DC source which can be supplied by: 1) the 100-240 V AC power adapter, 2) a
cigarette lighter adapter plugged into a 12 V DC source such as found in an
automobile or many light aircraft, or 3) a 7-24 V battery. The source can be in the
range 7-24 V DC without any detrimental effects on the measurement. When using a
battery, be certain to attach the positive (red) and negative (black) wires correctly.
Batteries and battery chargers are available from 2B Technologies. A circuit breaker
and diode are installed on the circuit board in case of an electrical short or incorrect
battery attachment. If activated, the breaker will reset itself after a few minutes. Also,
for safety purposes the provided 7.4-V lithium ion battery has its own protective circuit
in case of a short.
Turn the instrument on with the small switch between the power connection and the
GPS antenna (see Figure 14.2). Once turned on, the instrument will display the
version number of the software installed on the microprocessor. After a few seconds,
the instrument will start displaying readings for ozone. The first dozen readings
(requiring about two minutes) will be spurious, with large positive and negative swings
due to the rapid warmup of the lamp and electronics. Also, ozone readings may be
inaccurate during the 10-20 minutes required for the lamp, photodiode, and internal
temperature of the absorption cell to stabilize.
Inlet tubing may be attached to the white fitting on the front of the instrument (see
Figure 14.1). The inlet tubing should be made of PTFE (Teflon), PFA, FEP, PVDF,
or some other inert material that does not destroy ozone and that does not desorb
Page 16

Personal Ozone Monitor Manual Rev. E-2
8
plasticizers and other organics that can contaminate the flow path. The length of
tubing should be kept as short as possible (preferably not more than a few feet) to
minimize ozone destruction within the inlet tubing. Tygon, polypropylene (which may
look like Teflon), and metal tubing should not be used. FEP-lined Tygon tubing, which
is used inside the instrument, provides the flexibility of Tygon with the inertness of
FEP. A Teflon or PVDF inlet filter is highly recommended to prevent internal
contamination of the tubing and absorption cell by particulate matter. The filter should
be tested for ozone loss by measuring ambient ozone with and without the filter
attached. Filters and filter holders are available through 2B Technologies.
Although the instrument compensates for temperature drift, if strong temperature
fluctuations are expected, as in vertical profiling applications using balloons, the
instrument should be placed in a thermally insulated box.
3.3. Measurement of the Zero Offset
The electronic zero of the instrument may be measured by attaching an ozone zeroing
scrubber (2B Technologies part no. ZEREXTPOM or other ozone destruction cartridge) to
the air inlet for a period of 5-10 minutes. For an accurate measurement, the instrument
must have been turned on long enough for the internal temperature to stabilize. The
observed offset, which can amount to a few ppb, can be corrected for by changing the
offset calibration parameter (Z) from the front panel, as described in Section 5.10 below.
3.4. Collecting Data over the USB Port or Serial Port in Real Time
To transmit data to a computer over the USB port or the serial port in real time,
connect the Personal Ozone Monitor to the serial port of the computer using the
stereo plug to D9 serial cable provided. Start your data acquisition software,
preferably using the 2B Technologies Display and Graphing Software (available as a
free download from http://twobtech.com/downloads_software.htm; see Appendix A for
a description of working with this software). Other terminal emulation software such
as HyperTerminal (a program provided with earlier versions of Windows) or Tera Term
may be used as well.
The ozone mixing ratio (ppb), internal cell temperature (K), cell pressure (torr), time,
and date are sent as comma-delimited ASCII text to the serial and USB ports (19200
baud as selected in the menu; 8 bits; no parity; 1 stop bit) every 2 seconds, 10
seconds, 1 minute, 5 minutes, or 1 hour, depending on the averaging time selected
from the microprocessor menu. Time is provided in 24-hour (military) format, and the
date is given in European style (day/month/year).
A typical data line would read:
3.2,307.4,608.1,1.2740,12.1,4001.27765,-10513.0308,1591.20,1,23/03/12,16:39:14
where:
Ozone = 3.2 ppb
Cell temperature = 307.4 K
Page 17

Personal Ozone Monitor Manual Rev. E-2
9
Cell pressure = 608.1 torr (1 atm = 760 torr)
Photodiode Voltage = 1.2740 volts
Power Supply Voltage = 12.1 volts
Latitude = 4001.27765
Longitude = -10513.0308
Altitude = 1591.20 meters
GPS Quality = 1
Date = March 23, 2012
Time = 4:39:14 pm
If outputting logged data, the output serial data line will be preceded by the log
number; e.g.,
2893,3.2,307.4,608.1,1.2740,12.1,4001.27765,-10513.0308,1591.20,1,23/03/12,16:39:14
where 2893 is the log number.
In addition to data lines, messages are written to the serial port when logging is begun
or ended, when transmission of data from the logger is begun and ended, when data
collection is interrupted (e.g., due to a power failure), and when the averaging time is
changed.
4. GPS
The POM contains an on-board GPS unit that incorporates the well-known u-blox 6
GPS position engine and an efficient antenna system to provide highly accurate and
precise location data with each ozone measurement.
To acquire satellite signals, go outdoors away from tall buildings and trees. Acquiring
satellite signals may take 1-5 minutes. For best results, stand still in an open area
with the POM powered on until an asterisk appears on the LCD as shown below. The
asterisk denotes a valid satellite connection:
* O3= 2.7 ppb
T=305.4 P=682.3
As described in Section 5.13 (“Viewing GPS Coordinates via the Front Panel”) below,
it is possible to view the GPS data in real time on the LCD by navigating to the GPS
submenu. GPS coordinates, along with the GPS quality indication are also logged
with each measurement when the POM is set to log. The GPS quality indication can
be translated as:
0 = Fix not available
1 = Non-differential GPS fix available
2 = Differential GPS (WAAS) fix available
6 = Estimated.
Page 18
Personal Ozone Monitor Manual Rev. E-2
10
5. FRONT PANEL MENU
5.1. Menu Tree
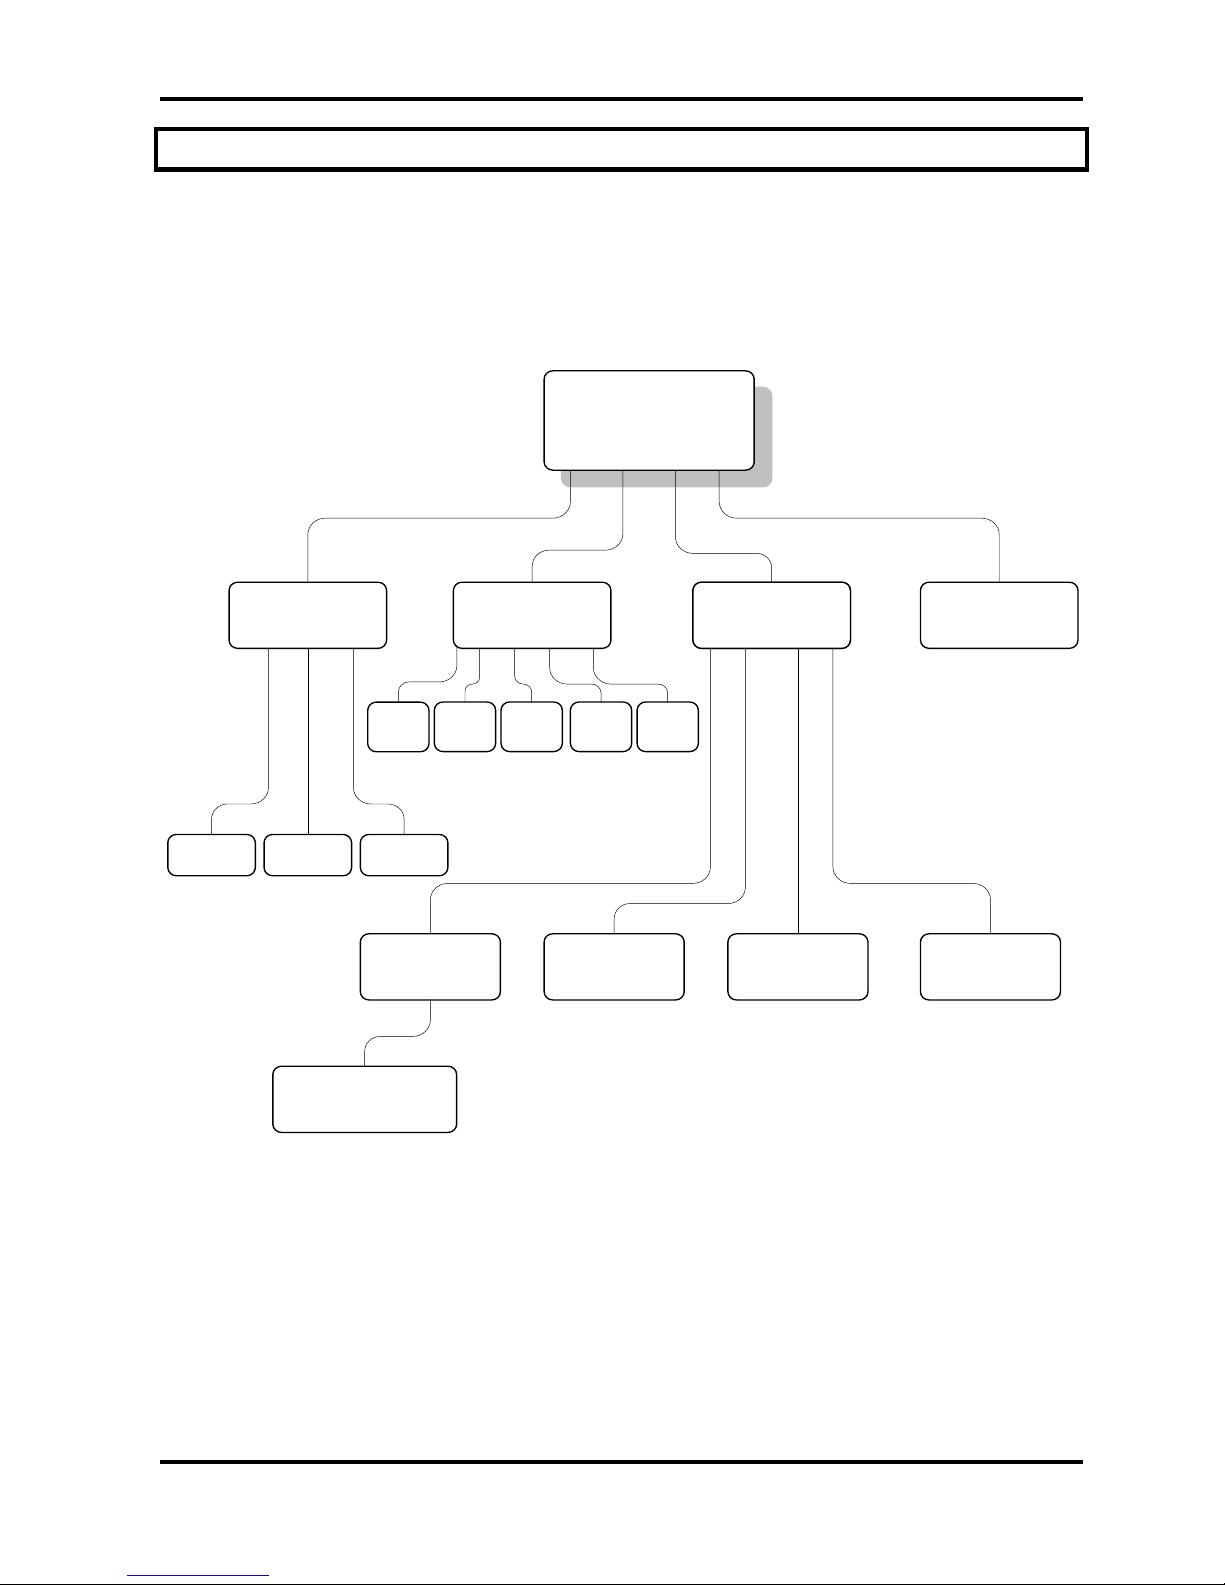
The following diagram summarizes the complete instrument Menu accessed via the
LCD, Select, and Move buttons.
Main Menu
Dat Avg Cfg Lmp
1h10s 5m
Log EndXmt
D/T Cal Bat Gps
D/T: 10:32:21
14/10/2009
Cfg
1m
2s
Figure 5.1. Instrument Menu.
Page 19

Personal Ozone Monitor Manual Rev. E-2
11
5.2. Data Averaging and Data Logging Using the Menu
When first turned on, the instrument will start making measurements. Data may be
logged in the internal data logger. Up to 8,192 data lines containing log number,
ozone mixing ratio, internal cell temperature, internal cell pressure, photodiode
voltage, power supply voltage, GPS latitude, GPS longitude, GPS altitude, GPS signal
quality, time, and date may be stored in internal memory, corresponding to an
operational time of 4.6 hours in the 2-s fast mode, and 22.8 hours in the 10-s
measurement mode. Averaging times of 1 min, 5 min, and 1 hr also may be selected
from the menu, thereby increasing the logging capacity to 5.6 days, 28 days, and 341
days, respectively, before filling the memory.
Note that entering the menu will interrupt the averaging interval that is in progress,
and the averaging interval will start over when the menu is exited and measuring is
resumed.
5.3. Navigating the Front Panel Menu
The front panel consists of a 2-row by 16-character LCD screen and two push buttons
that are located below the LCD screen (see Fig. 14.1 below). The curved arrow, or
“Select” button, is used to enter and exit menus and for selecting values. The right
pointing arrow, or “Move” button, is used to move the cursor from left to right.
5.4. Entering the Front Panel Menu
The menu is accessed via the Select button (curved arrow) on the front panel of the
instrument. To reach the main Menu, hold in the Select button until
Menu
is displayed, then release the Select button. After a few seconds the main Menu will
appear:
Menu
Dat Avg Cfg Lmp
where Dat, Avg, Cfg, and Lmp are submenus that may be selected. A blinking
cursor will show across the D of the Dat submenu. Clicking on the Move button will
move the cursor under the first letter of one of the other submenus. To select a
particular submenu, move the cursor under the first letter of a submenu by pressing
the Move button and press the Select button to select the submenu. To exit the main
Menu and begin making measurements again, move the cursor to the left arrow ()
and press the Select button.
5.5. Acquiring Data without Logging
Select the Dat submenu from the main Menu using the Select button. The display will
now show:
Dat Menu
Page 20

Personal Ozone Monitor Manual Rev. E-2
12
Xmt Log End
To make measurements without logging data, move the cursor to End and click to end
the logging mode. Select to return to the main Menu, and select again to exit
the Menu and start making measurements. Note that “” always takes you up one
level in the menu.
If the 10-s measurement mode has been selected (see Section 5.8 below), for example,
the Personal Ozone Monitor will then alternate every 5 seconds between displaying the
most recent 10-s measurement and the current value. For example, the display might
read
O3= 30.2 ppb
T=303.3 P=689.7
where the current ozone measurement is 30.2 ppb (by volume), the internal cell
temperature is 303.3 K and the internal cell pressure is 689.7 torr. Five seconds later,
this display might be followed by
O3= 31.1 ppb
19:55 23/05/16
showing that the time of the measurement is 7:55 pm and the date is 23 May, 2016. If
averaging of 1-min, 5-min, or 1-hr has been selected (see Section 5.8 below), the
above display will be replaced by
Avg O3= 24.1 ppb
19:55 23/05/16
for example, where the most recent average value of ozone computed is 24.1 ppb. At
the end of an averaging period, a new average value will be displayed along with the
internal cell temperature and internal cell pressure. For example:
O3= 25.3 ppb
T=303.5 P=688.1
5.6. To Begin Logging Data
Select the Dat submenu from the main Menu using the Select button. The display will
now show:
Dat Menu
Xmt Log End
To start logging data, move the cursor to Log and click to select the logging mode.
You will then receive the prompt:
Overwrite Data?
No Yes
Warning: If you start logging, all data previously stored in the logger will be
irretrievably lost.
Page 21

Personal Ozone Monitor Manual Rev. E-2
13
If you have data in the logger that you want to keep, be sure to download it (see
Section 5.9 below) before starting logging. Select Yes if you are sure you want to
start logging new data. This will return you to the Dat submenu. Select to return to
the main Menu, and select again to exit the Menu and start making measurements.
As previously mentioned, note that “” always takes you up one level in the menu.
If data are being logged and averaged, the log number and the number of new
measurements made for the next average (minus 1) are displayed in place of the date
and time; e.g.,
Avg O3= 29.1 ppb
Log= 193:4
where Avg O3 is the average ozone value most recently written to the logger, and the
current log number is 193. The “4” in 193:4 refers to the number of 10-s data points
that have been measured so far for inclusion in the next average to be displayed and
logged. If 1-min averaging is used, this number will increment from 0 to 5; for 5-min
averaging, the number will increment from 0 to 29; and for 1-hr averaging, it will
increment from 0 to 359. This number is displayed so that the user will know how
many more 10-s measurements need to be made before a new average is displayed
and logged.
Note that entering the menu will interrupt the averaging interval that is in progress,
and the averaging interval will start over when the menu is exited and measuring is
resumed.
If there is a power failure while the instrument is in the logging mode, logging will
resume after power is restored. A note of “Data Interruption” will be written to the
logger prior to writing the first new data line. The instrument can accommodate
multiple data interruptions due to power failures. For example, one can purposely
switch the instrument off, move to another location and restart logging simply by
turning the instrument back on. Data sets will be separated by the data interrupt
message.
5.7. To Stop Logging Data
Hold in the Select button to obtain the main Menu. Go to the Dat submenu by clicking
on Dat. Select the End function. This will end data logging. You may now return to
the Dat menu to transmit the data to a computer by selecting Xmt (see below). The
stored data will reside in memory (even when new measurements are being made)
and can be transmitted using the Xmt function as often as you like.
Note: All stored data are lost once logging is started again using
the Log function.
Thus, you should always transmit your data to a computer before
restarting logging.
Page 22

Personal Ozone Monitor Manual Rev. E-2
14
If you fail to End logging prior to transmitting the data using the Xmt function, the
instrument will automatically execute the End function for you prior to transmitting the
data.
5.8. To Average Data
Hold down the Select button to obtain the main Menu. Select Avg to obtain the Avg
menu:
Avg Menu
2s 10s 1m 5m 1h
Use the Move button to move the cursor to 2s, 10s, 1m, 5m or 1h for times of 2 s (fast
mode), 10 s (measurement mode), 1-min averaging, 5-min averaging, or 1-hr
averaging, respectively. Then select the time you want to use. You will be returned to
the main Menu. To exit the main Menu and start acquiring data, select again.
While in an averaging mode, the current 10-s measurement is displayed alternately
with the average value at 5-s intervals, as discussed above. Averaged data may be
logged, thereby greatly extending the length of time that the data logger can be used.
Note that entering the menu will interrupt the averaging interval that is in progress,
and the averaging interval will start over when the menu is exited and measuring is
resumed.
5.9. Capturing the Transmitted Logged Data Using the USB or Serial Port
Connect the USB or serial port of the instrument to your computer using the
appropriate cable. Enable a data acquisition program on the computer such as the 2B
Technologies Display and Graphing Software, which can be downloaded at:
http://twobtech.com/software.htm
See Appendix A for a description of working with this software. Alternatively,
HyperTerminal can be used (available on most earlier Windows platforms, usually in
Start/All Programs/Accessories/Communications/Hyper Terminal) or Tera Term, which
can be downloaded at: http://logmett.com/index.php?/download/tera-term-486-freeware.html
The correct settings for receiving data are: chosen baud rate 19200; 8 bits; no parity;
1 stop bit.
Enter the main Menu. Go to the Dat submenu by clicking on Dat. Next, select Xmt.
The message “Transmitting logged data” will be written to the serial port, followed by a
carriage return and all of the lines of logged data. After all data are transmitted, the
message “End Logged Data” and a carriage return are written. After transmission is
complete, you can return to any position in the menu or resume ozone measurements
without logging. The previously logged data continues to be available for transmission
until a new data logging session is started.
Page 23

Personal Ozone Monitor Manual Rev. E-2
15
5.10. To Set the Calibration Parameters
The instrument is calibrated at the factory where slope (S) and offset (Z) parameters
are entered into the instrument’s memory. These preset calibration parameters are
given in the instrument’s Birth Certificate and recorded on the calibration sticker on the
bottom of the instrument. However, the calibration parameters may be changed by
the user. Because of noise and/or an inherent offset, some measured values will be
below zero at very low ozone mixing ratios or while zeroing the instrument with an
external scrubber. Also, the instrument zero may drift by a few ppb over time. For
this reason, frequent zeroing of the instrument using an external ozone scrubber to
determine the offset is recommended. Any change in the slope (gain) of the
instrument is likely due to a serious problem such as contamination, an air leak,
obstruction of air flow, or loss of catalytic activity by the internal ozone scrubber, but it
also can be adjusted. Once the zero of the instrument is corrected, the slope may be
adjusted so that the instrument readout agrees with a standard ozone source (such as
the 2B Technologies Model 306 Ozone Calibration Source) or with the readout from
another instrument whose calibration is considered to be accurate.
To change the calibration parameters, choose the Cfg submenu from the main Menu
and click on Cal to obtain the display
Cal Menu
Z= -3 S= 1.01
Here Z is the offset applied in units of ppb (in this case –3 ppb) and S is the slope
applied (in this case 1.01). The value of Z is added to the measured ozone value, and
the value of S is then multiplied by the measured ozone value. During calibration Z is
set to 0 and S set to 1.00, if the instrument reads an average of 3 ppb with the
external scrubber in place, the value of Z should be set to –3. If after correction for
the zero, the instrument consistently reads 2% low, the value of S should be set to
1.02. If a calibration is done in units other than ppb, the offset (Z) value must be
converted to ppb before entering the value.
When the Cal Menu first appears, the Z will be underlined with a cursor. You may
move the cursor to choose the calibration parameter S or Z. Selecting S or Z will
select that parameter for change and activate a blinking cursor. Once S or Z is
selected, its value can be changed by pressing the Move button to increase the value.
The value will roll-over to negative values after reaching the maximum allowable offset
(–50 to +50 for Z, 0.5 to 1.5 for S). After choosing the desired value, press the curved
arrow to exit stop editing mode. The cursor can then be moved by pressing the right
pointing arrow to the S to edit the slope or to the to exit the submenu. Once the
values of Z and S are set, selecting will return the display to the Cfg menu, and
again selecting will return to the main Menu. The calibration parameters reside in
non-volatile memory and are not affected by power failures.
In order to adjust the zero offset, after the instrument has warmed up for at least 20
minutes attach the external ozone scrubber and make measurements for a few
minutes. If the average of those measurements is 4.4 ppb, for example, subtract 4
Page 24

Personal Ozone Monitor Manual Rev. E-2
16
from the current value of Z; e.g., if Z was set to 3 during the measurements, change Z
to –1. For more details about calibrating the Personal Ozone Monitor against another
instrument or calibrated ozone source, see the “Calibration” section of this manual or
refer to Tech Note No. 15 at: http://www.twobtech.com/tech_notes/TN015.pdf
5.11. To Set the Time and Date
From the main Menu, select the Cfg submenu. Next, select the D/T submenu. The
display will read, for example:
D/T: 14:32:21
17/10/2015
meaning that it is 21 seconds after 2:32 p.m. on October 17, 2015 (military time and
European date). To change a number in the date and time, move the cursor to
underline the numeral you want to change. Pressing the Select button then causes a
blinking cursor to cover that numeral. The number can then be changed by pressing
the Move button. Once the number is correct, press the Select button to turn off the
blinking cursor. You may now use the Move button to choose another numeral to
change. Once the time and date is correct, selecting will set the internal clock to
that time and return the display to the Cfg menu. As in setting a digital watch, the
seconds should be set in advance of the real time since the clock starts to run again
only when the set time is entered; in this case by selecting .
5.12. Viewing the Power Supply Voltage via the Front Panel
To view the power supply voltage in real time, select Bat from the Cfg Menu. Exit this
view by pressing the Select button.
5.13. Viewing GPS Coordinates via the Front Panel
To view real time Latitude, Longitude and Altitude data, select GPS from the Cfg
Menu. Latitude and Longitude are constantly shown and Altitude (in meters) is
available by pressing and holding the Move button. Exit this view by pressing the
Select button.
Page 25

Personal Ozone Monitor Manual Rev. E-2
17
6. LAMP TEST
If the instrument is excessively noisy (standard deviation greater than 2 ppb) when
measuring clean or zero air, or always reads near zero in the presence of ozone, it is
useful to perform the lamp test to make sure that the lamp is turning on and does not
fluctuate too rapidly. Before performing the lamp test, allow the instrument to warm up
for at least twenty minutes.
Choose Lmp from the main Menu. The display will momentarily read “Lamp Test.”
The photodiode voltage will then be displayed, and after a few lamp measurements
have been made, the electronic offset and standard deviation also will be displayed
as, for example:
PDV= 0.89801 V
1.2+/-1.85
The photodiode voltage (PDV) is a measure of the lamp intensity and should be in the
range 0.6-2.2 volts. Since absorbance is a ratio measurement, the absolute value of
the voltage is not particularly important. However, above 2.5 volts, which could occur
if the instrument is allowed to become too hot, the photodiode is saturated and the
calculated ozone concentration will be zero. Photodiode voltage less than 0.6 volts is
indicative of either a weak lamp or a dirty detection cell and may result in a noisy
measurement. The photodiode voltage will typically increase as the instrument warms
up. Lamp drift is continuously monitored and corrected for in the firmware and thus
has very little effect on the measured ozone concentration.
Once the instrument is warmed up, fluctuations in photodiode voltage should be
limited primarily to the last digit displayed. The lamp test also calculates an electronic
offset and standard deviation of the measurement itself, displayed in the above
example as 1.2 ppb for the electronic offset and +/-1.85 for the standard deviation.
The standard deviation is a quantitative measure of the lamp and associated
electronic noise. Electronic offsets should normally be –5 to 5 ppb equivalent. After
running the lamp test for a few minutes, values above 2.50 for the standard deviation
usually indicate an excessively noisy lamp. Lamps seldom “burn out” but may
become noisy with time and need to be replaced. Some lamps become noisy after
only a short period, while others will be extremely stable for years. If your lamp fails
the lamp test during the first year of operation, contact us for a new lamp under the
instrument warranty. Contamination of the detection cell may also cause a high
standard deviation, in which case the flow path should be cleaned with methanol and
the internal ozone scrubber replaced. Please contact us to return the instrument to 2B
Tech for cleaning and/or lamp replacement.
To exit the Lamp Test, press and hold the Select button.
Page 26

Personal Ozone Monitor Manual Rev. E-2
18
7. QUIET MODE
The POM firmware allows the user to select a “quiet mode” where the pump will be
throttled down to decrease the high pitch frequency sound output. This can be done
one of two ways. The user can press and hold the Select button while powering on
the POM to display
Pump Mode
Quiet Fast
where the user can select “Quiet,” which will slow the pump down and change the
instrument flush cycle time from 2 seconds to 4 seconds. This setting will also change
the 10 second averaging time to 20 seconds.
Restarting the instrument and changing back to “Fast” will reset the flush time to 2
seconds. Another way to change the pump mode is through the serial menu as
described in the next section.
8. SERIAL AND USB MENU
Measurements and logging tasks can be accessed via the serial port or the USB using
the 2B Technologies Data Display software (see Appendix A) or a terminal emulator
such as Tera Term or HyperTerminal running on an attached computer. Commands
can be sent using the terminal emulator set with the properties listed in the section of
this manual entitled “Collecting Data over the USB Port or Serial Port in Real Time”
(Section 3.4). Listed below are the lower-case letters that are commands for
performing certain operations while the instrument continues to measure:
l Start logging and write over existing logged data
t Transmit logged data
e End logging
h Output serial data line header
n Output serial number of the instrument
m Serial menu
If the letter m is sent as a command, menu> will be displayed in the terminal emulator
window. When the serial menu is accessed, the instrument is no longer making
measurements; it is waiting for the next command to be entered. The next page
shows the list of menu items accessible from this point:
Page 27

Personal Ozone Monitor Manual Rev. E-2
19
l Start logging and write over existing logged data.
t End logging and transmit logged data.
e End logging.
h Output serial data line header.
a Displays list of possible averaging times and waits for the user to enter the
number to change to the desired averaging time.
z Displays current zero calibration setting and waits for new setting followed by a
carriage return (must be entered in units of ppb).
s Displays current slope calibration setting and waits for new setting followed by
a carriage return.
c Asks user to enter the time in HHMMSS format.
d Asks user to enter the date in DDMMYY format.
g Outputs GPS data sentences as read from GPS device (enter x to return to the
menu and then to measuring).
n Outputs the serial number of the instrument.
f Sets pump mode to FAST (2-second cycles).
q Sets pump mode to QUIET (4-second cycles).
b Displays current Adaptive filter difference and waits for new setting followed by
a carriage return. (Factory default setting is 15.)
i Displays current Adaptive filter percent and waits for new setting followed by a
carriage return. (Factory default setting is 5.)
k Displays current Adaptive filter long average length and waits for new setting
followed by a carriage return. (Factory default setting is 50.)
m Displays current Adaptive filter short average length and waits for new setting
followed by a carriage return. (Factory default setting is 10.)
p/o Toggles the LCD backlight on and off.
u Performs a lamp test (enter x to return to the menu and then to measuring).
? Prints the help menu.
x Exit menu and return to measuring.
Page 28
Personal Ozone Monitor Manual Rev. E-2
20
9. USB INSTALLATION
The following procedure describes how to install the USB connection for the Model
Personal Ozone Monitor.
9.1. Items Required
1. Personal Ozone Monitor
2. USB Cable (supplied with POM)
3. PC Computer with Windows 10, 2000, XP, Vista, 7 or 8
4. USB to UART Driver Disk (or download from 2B Tech website here:
http://twobtech.com/downloads_software.htm)
9.2. Driver Installation
1. Insert USB to UART Driver Disk in the computer’s CD ROM drive or download
the Model POM USB Driver from the 2B Tech website.
2. The installation files are located in a zip folder. Navigate to the folder labeled
“cdc_NTXP” and double click on it.
3. Unzip the contents to a folder on the desktop or any area you wish.
4. With the POM off, attach USB cable from the POM to a USB port on the
computer.
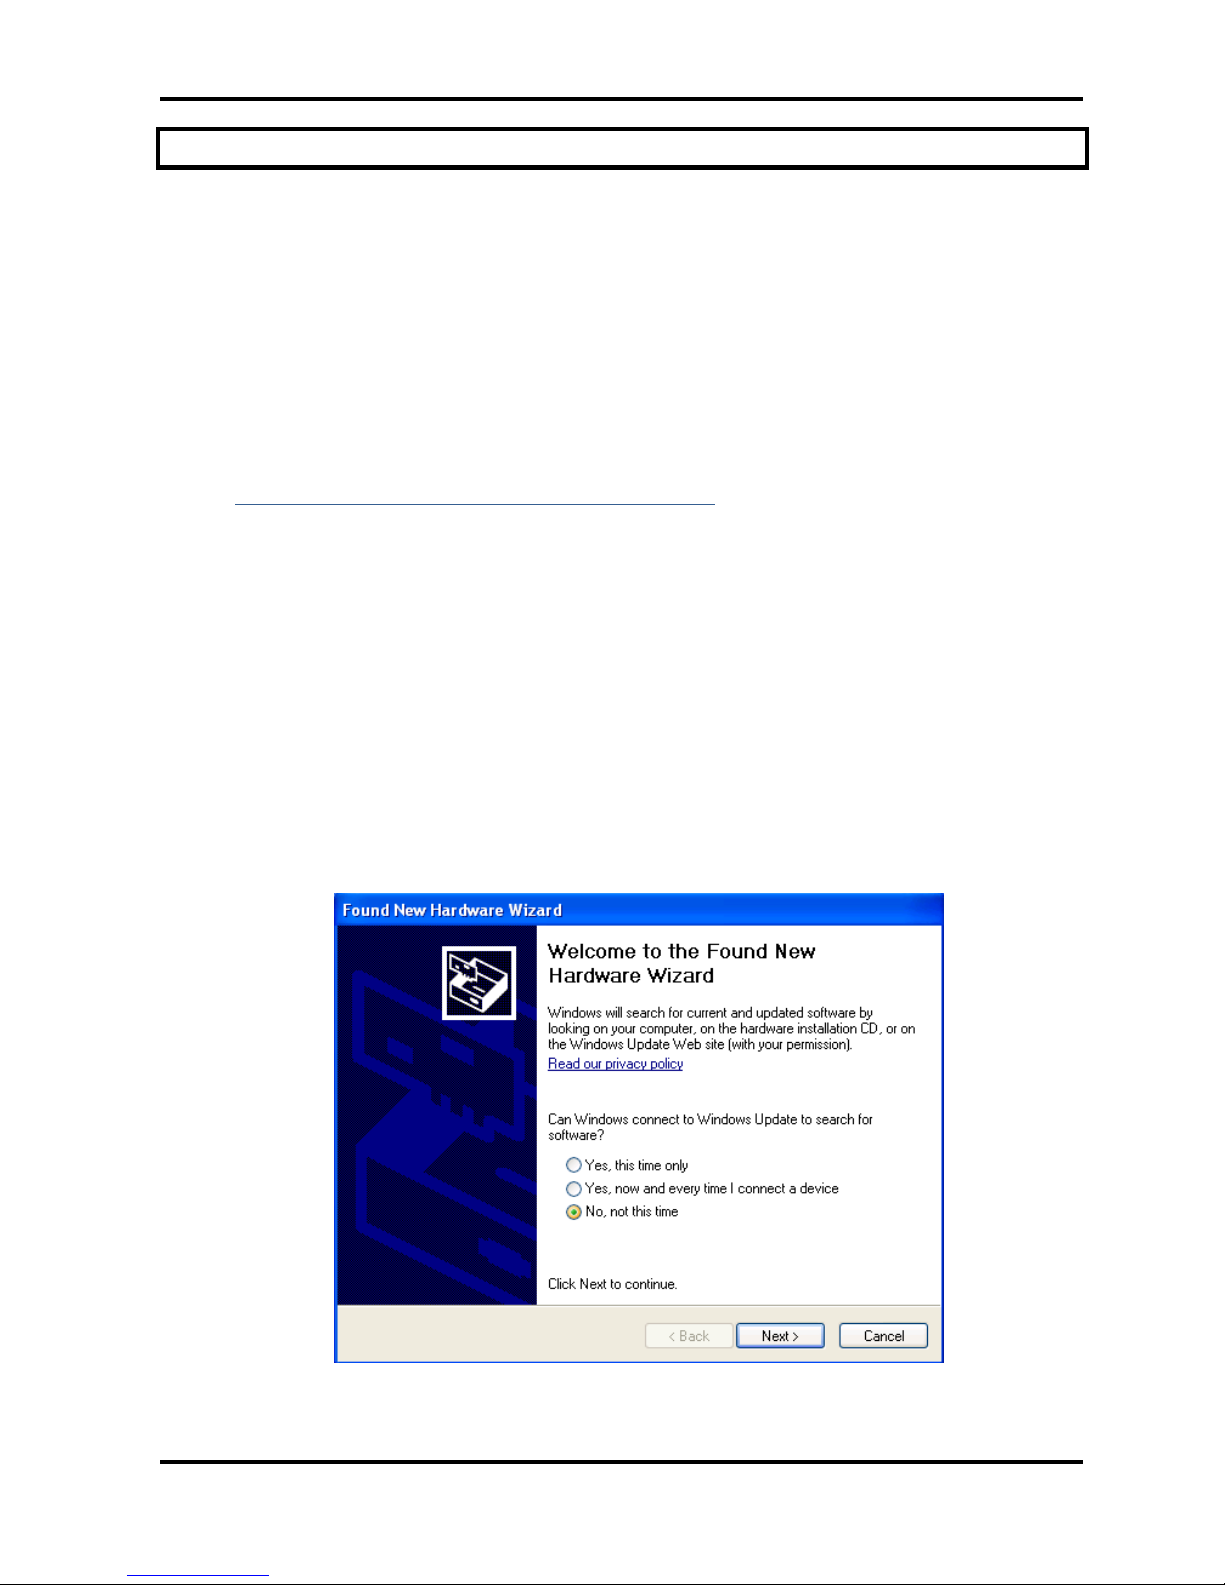
5. Turn on POM. The install wizard should pop up as follows. Select “No, not this
time” and click “Next”.
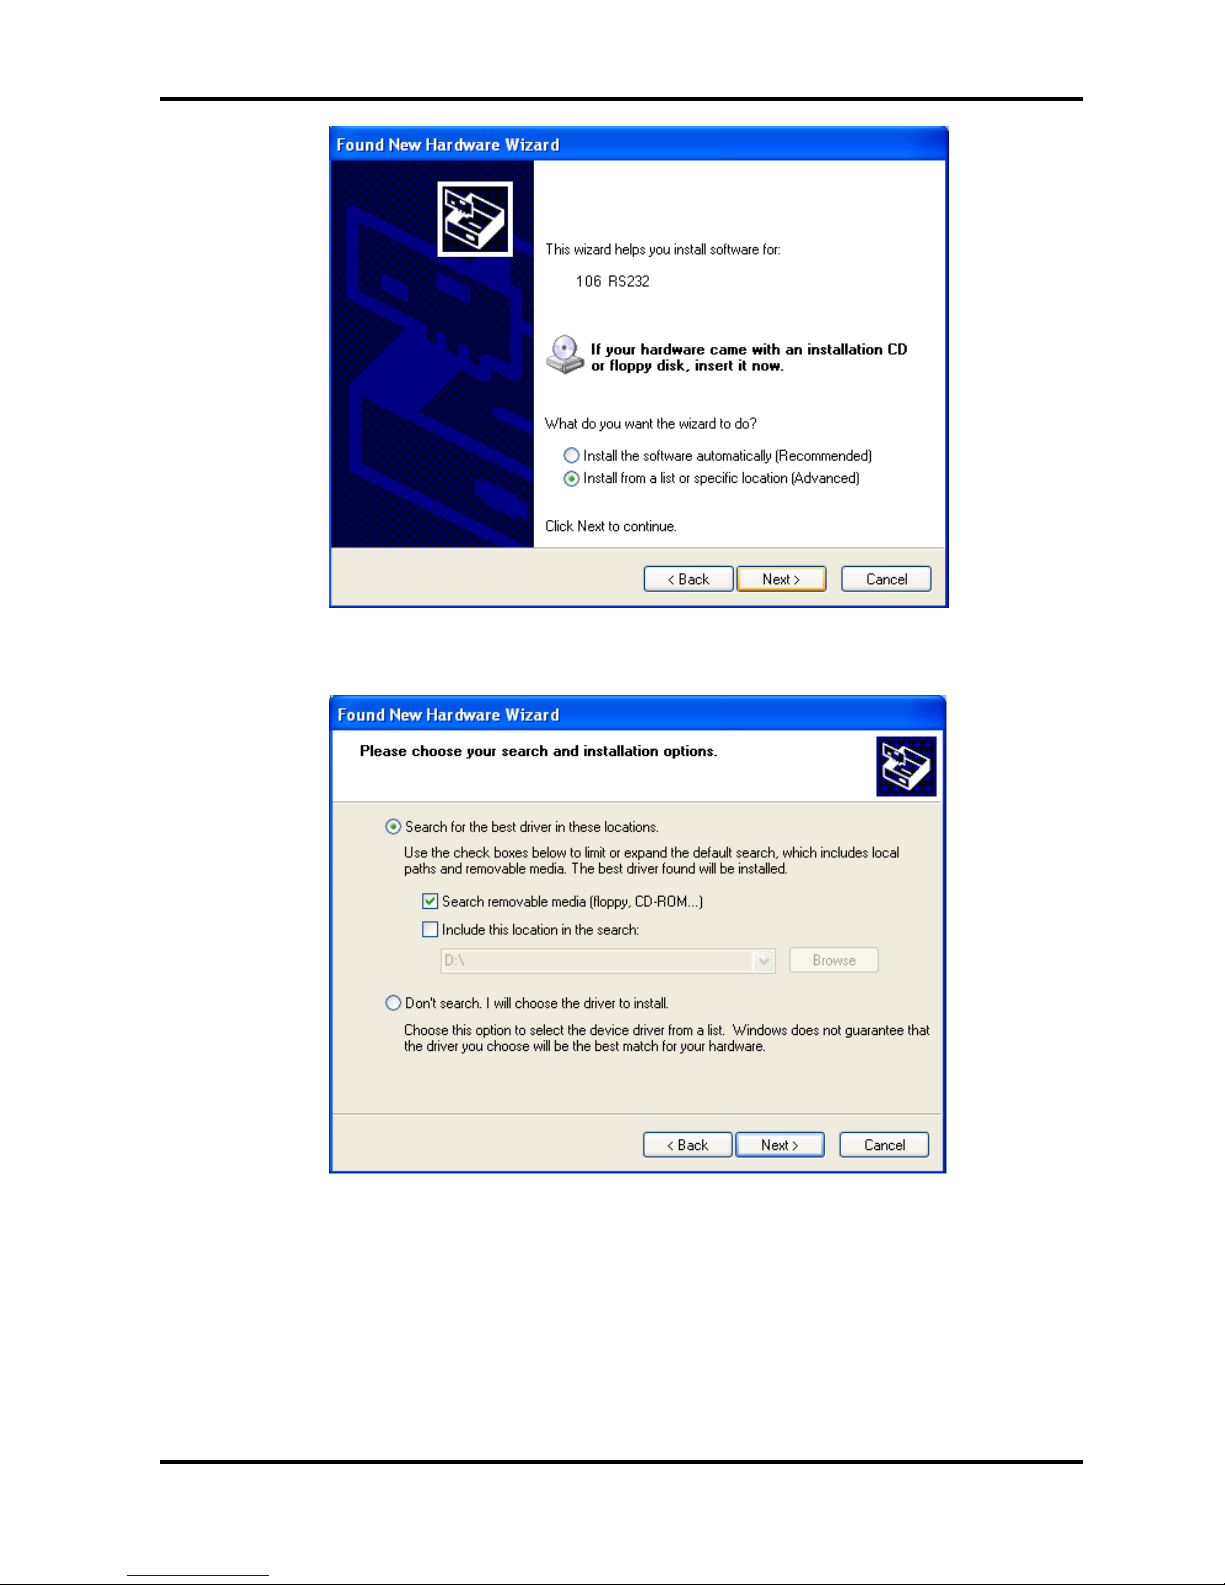
6. Select the “Install from a specific location” option and click “Next”.
Page 29
Personal Ozone Monitor Manual Rev. E-2
21
7. Navigate to folder where you unzipped the cdc_NTXP.
8. Select “Continue Anyway” when this window appears.
Page 30
Personal Ozone Monitor Manual Rev. E-2
22
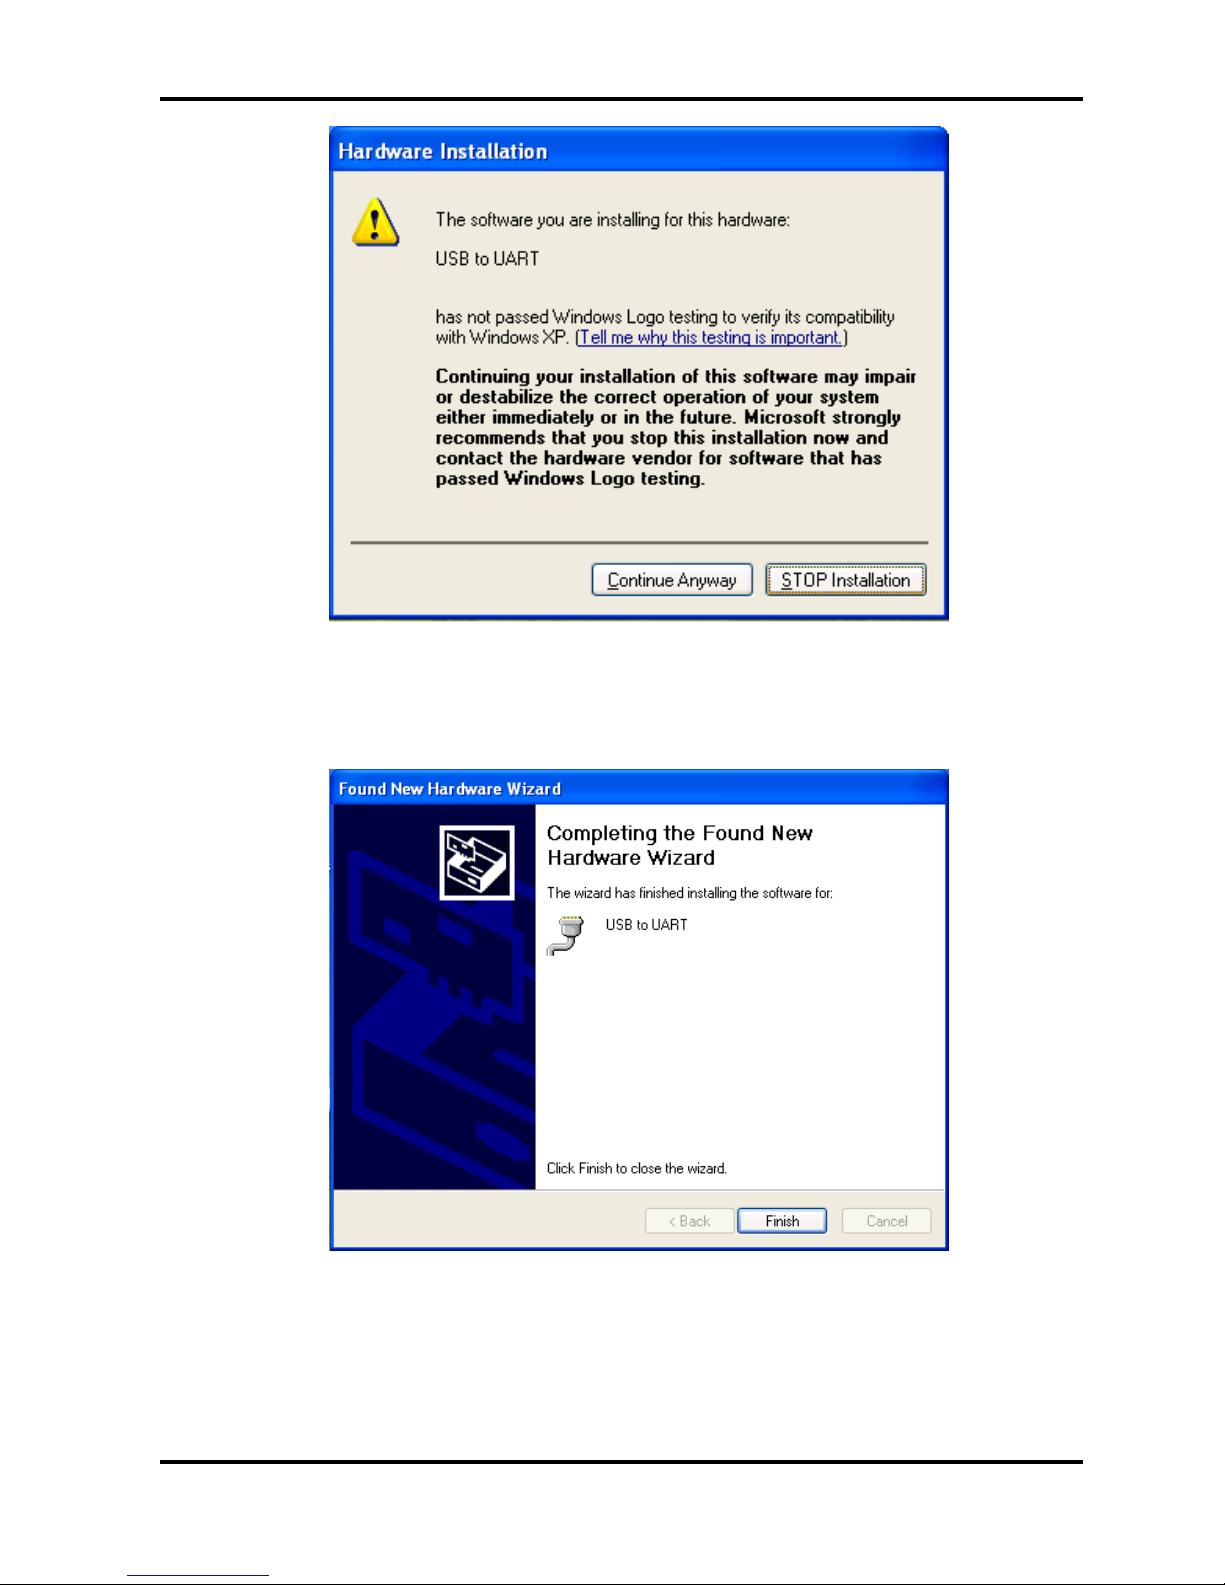
9. After a few seconds, the driver will be finished installing.
Page 31
Personal Ozone Monitor Manual Rev. E-2
23
10. USING THE USB CONNECTION
10.1. Determine the Connection Port
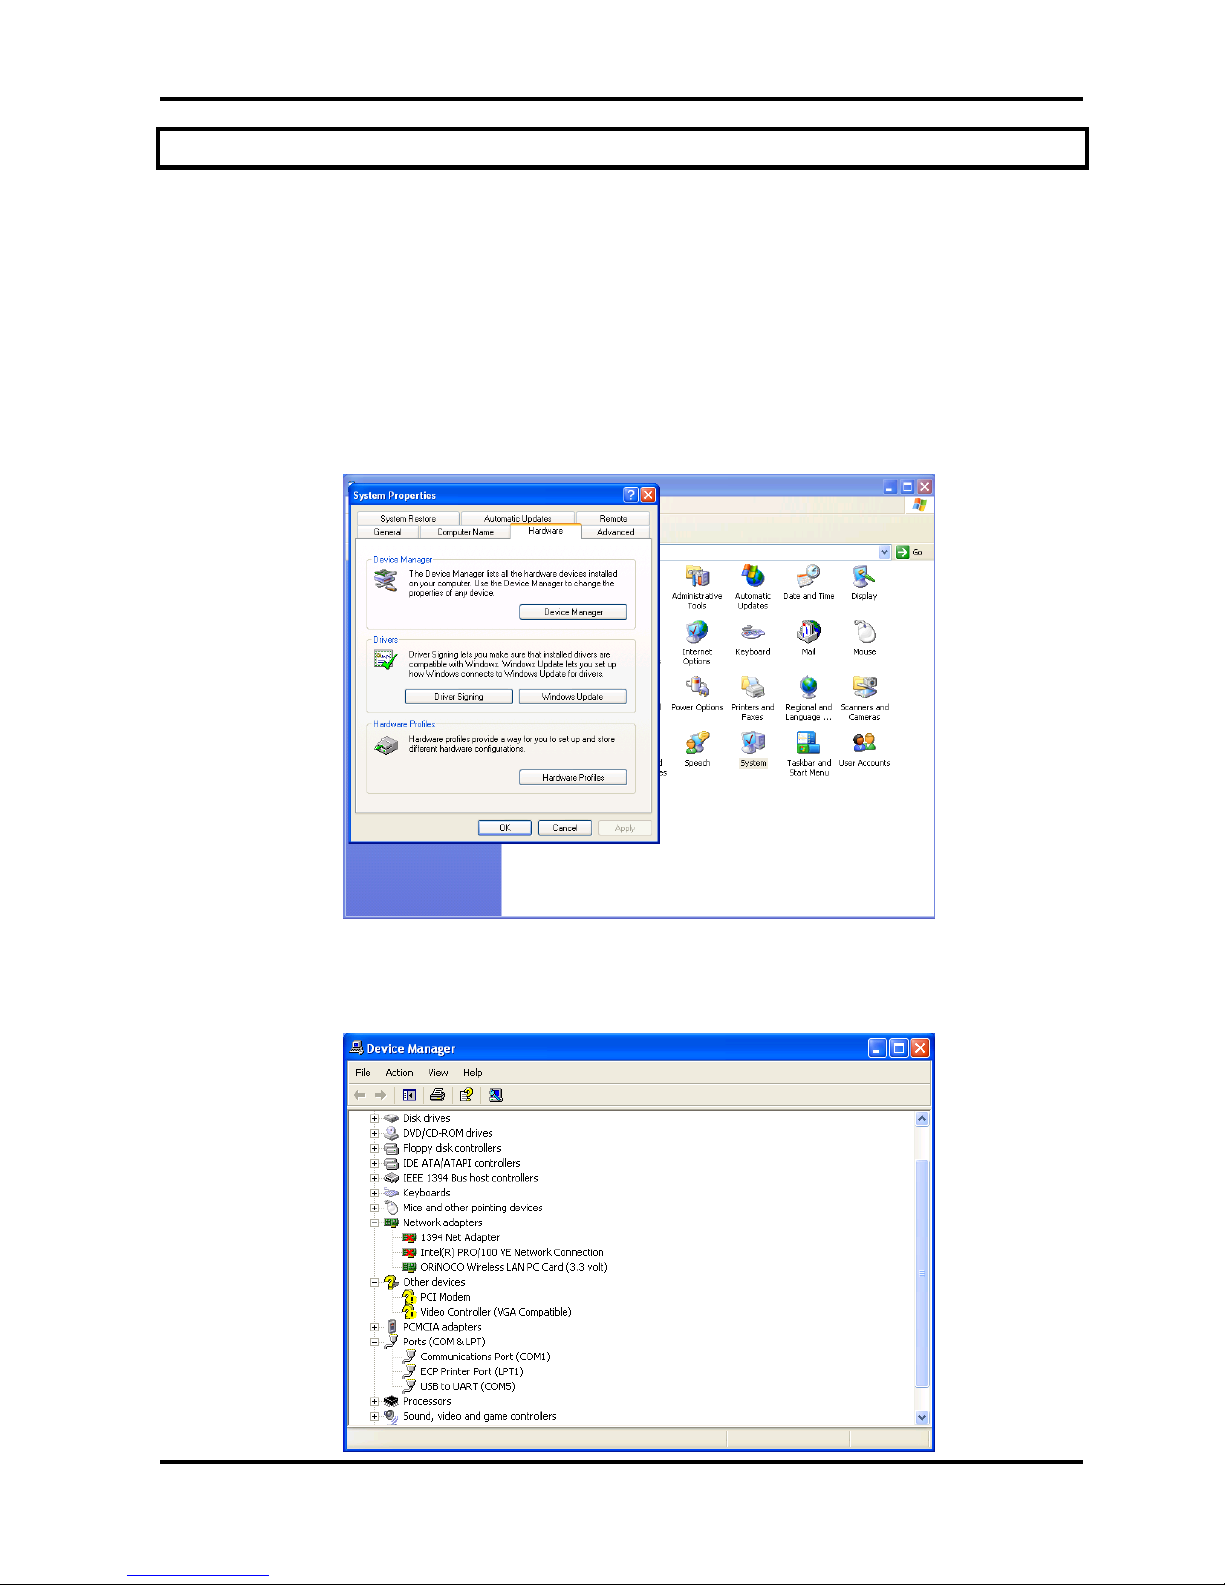
After installation is complete, determine which COM port the connection is using.
This can be done by the following procedure.
1. If using Windows (10, XP, Vista, 7, 8), go to the control panel and select
“System”.
2. Click on the “Hardware” tab.
3. Click the “Device Manager” button.
4. Press the “+” sign next to “Ports”.
Page 32

Personal Ozone Monitor Manual Rev. E-2
24
5. In Parenthesis, next to the “USB to UART” listing is the assigned COM port
number. This number will be used for the settings for the 2B Tech software or
terminal emulator used to read data from the POM.
10.2. Using the Connection
• Plug the USB cable in after the powering the POM to ensure correct
functionality.
• When setting up your software or terminal emulator, choose the correct COM
port listed in the Device manager.
• Use these baud rate settings: 19200, 8 bits; no parity; 1 stop bit.
• Use 2B Technologies Display and Graphing Software (free download from
http://twobtech.com/downloads_software.htm) to read measurement data from
the POM.
Page 33

Personal Ozone Monitor Manual Rev. E-2
25
11. CALIBRATION
11.1. Overview
Every analytical instrument is subject to some drift and variation in response, making it
necessary to periodically check the calibration. Dynamic calibration is a multipoint
check where gas samples of known concentrations are sampled by the instrument in
order to determine a calibration relationship. For more information on calibration of
ozone monitors refer to the Code of Federal Regulations (Title 40, Part 50, Appendix
D) and the EPA’s Technical Assistance Document for the Calibration of Ambient
Ozone Monitors.
Calibration is the process of adjusting the gain and offset of the Personal Ozone
Monitor against some recognized standard. The reliability of the data collected from
any analytical instrument depends on the accuracy of the calibration, which is largely
dependent upon its analytical traceability to a reference material or reference
instrument calibration.
Because of the instability of ozone, the certification of ozone concentrations in a
compressed gas cylinder is impossible due to loss of ozone over time. When ozone
concentration standards are required, the ozone must be generated and certified on
site. The following information is based on EPA requirements for calibrations of ozone
monitors for monitoring in compliance with the U.S. Clean Air Act. Similar procedures
are recommended for other applications as well.
Ozone standards can be classified into two basic types:
1. A Primary Ozone Standard is the combination of an ozone generator and an
ozone monitor based on UV absorbance (a UV photometer) that has been setup in
accordance with the procedures prescribed by the U.S. Environmental Protection
Agency (EPA) under Title 40 of the Code of Federal Regulations, Part 50,
Appendix D (40 CFR Part 50).
2. An Ozone Transfer Standard is a system (a portable ozone monitor and/or a
portable ozone generator) that can produce accurate ozone concentration standards
that are quantitatively related to a primary ozone standard. An example of an ozone
transfer standard is the 2B Technologies Model 306 Ozone Calibration Source.
Ozone transfer standards must be certified before use in accordance with the
procedures prescribed by the U.S. Environmental Protection Agency (EPA) under
Title 40 of the Code of Federal Regulations, Part 50, Appendix D (40 CFR Part 50).
Page 34

Personal Ozone Monitor Manual Rev. E-2
26
11.2. Equipment Required
The equipment that is needed to carry out the calibration is commercially available, or
it can be assembled by the user. Calibration using a primary ozone standard involves
the generation of ozone concentrations that are simultaneously measured by a
primary ozone standard and the instrument undergoing calibration. This procedure
requires the following equipment:
1. Zero air source
2. Ozone generator
3. Sampling manifold (inert material such as PTFE or FEP only)
4. Sampling lines (inert material such as PTFE or FEP only)
5. UV Photometer
Use of a certified transfer standard for calibration involves the generation of ozone
concentrations, using the calibrated ozone generator, that are measured by the
instrument undergoing calibration. This procedure requires the following equipment:
1. Zero air source
2. Certified Transfer Standard
3. Sampling manifold (inert material such as PTFE or FEP only)
4. Sampling lines (inert material such as PTFE or FEP only)
Zero air can be generated either from compressed cylinders or from scrubbed ambient
air. If ambient air is used, contaminants such as ozone and nitric oxide must be
removed. Detailed procedures for generating zero air are in the EPA’s Technical
Assistance Document for the Calibration of Ambient Ozone Monitors.
11.3. Instrument Preparation
Prior to calibration, follow the steps below:
1. Turn on the Personal Ozone Monitor and allow it to stabilize for a minimum
of one hour.
2. Connect the instrument to the manifold on the ozone calibration setup. If a
particle filter will be used in normal operation, the calibration must be
performed through the filter. The manifold must be vented to atmosphere
so that pressure does not build up in the calibration setup. Connection of
the POM directly to a pressurized output of any device can damage the
Personal Ozone Monitor.
3. Verify that the flow rate into the manifold is greater than the total flow required
by the instrument and any other flow demand drawing from the manifold.
11.4. Calibration Setup Preparation
As indicated in the EPA Technical Assistance Document there are several tests that
should be performed prior to calibration to ensure the accuracy of the measurements.
These tests include:
Page 35

Personal Ozone Monitor Manual Rev. E-2
27
• Setup check
• Ozone loss test
• Linearity check
• Intercomparison test
11.4.1. Setup Check
A visual inspection of the calibration setup should be performed before calibration to
verify that the setup is in proper order. All plumbing connections should be checked
and verified to follow the manufacturer's instructions. Any obvious leaks should be
fixed and the manifold and sampling lines should be checked for general cleanliness.
For more information, refer to the manufacturer's User Manual for the primary ozone
standard or ozone transfer standard.
11.4.2. Ozone Loss Test
Some ozone may be lost in the calibration setup due to reaction with the walls of the
manifold and sampling lines. Any significant loss of ozone must be measured and be
subsequently applied to correct the calibration measurements. For more information,
refer to the manufacturer's User Manual for the primary ozone standard or ozone
transfer standard.
11.4.3. Linearity Check
Since the Personal Ozone Monitor is inherently linear over several orders of magnitude,
a linearity check provides a test that the instrument is operating properly. Instrument
linearity can be checked by comparison to an ozone standard (see Section 12.4,
“Calibration Procedure – Calibration Curve”) or by dilution of an ozone measurement.
To check the instrument linearity by dilution of an ozone measurement, generate and
measure a concentration of ozone near the upper range of ozone concentrations to be
measured using the POM. Additional ozone concentrations should be generated by
accurately diluting the ozone flow with zero air and each concentration should be
measured once the instrument reaches a stable response. The accuracy of the linearity
test relies on the accuracy of the flow meters used to perform the dilution. The percent
of non-linearity is calculated from the formula:
do
o
FF
F
R
(2)
%100
1
2
1
x
C
R
C
C
E
(3)
where:
R = Dilution ratio
Fo = Ozone generator flow
Fd = Diluent zero air flow
E = Linearity error, in percent
C1 = Measured concentration of original concentration
C2 = Measured concentration of diluted concentration
Page 36

Personal Ozone Monitor Manual Rev. E-2
28
The linearity error should not be greater than 5%. If the error is greater than 5%, the
accuracy of the flow dilution should be checked before assuming that the instrument is
not linear. Note that the inherent linearity of the POM is better than the error
calculated in this linearity check due to the uncertainty introduced by the flow
measurements.
11.4.4. Intercomparison Test
Comparison of the calibration setup with other ozone standards is a good check of the
overall accuracy of the setup. If measurements from another ozone standard are
found to deviate from the calibration setup greater than the instrument specifications,
one of the calibration setups is not accurate.
12. CALIBRATION PROCEDURE
A multipoint calibration should be performed within the calibration frequency, any time
major disassembly of components is performed, or any time the zero or span checks
give results outside of the acceptable limits. The instrument may be returned to 2B
Technologies for calibration service. Alternatively, the user may perform the
calibration using the suggested procedure below.
12.1. Instrument Preparation
1. Turn on the Personal Ozone Monitor and allow it to stabilize for a minimum
of one hour.
2. Enter the calibration menu (Main Menu / Cfg / Cal / O3) and set the zero
(Z) value to 0 and the slope (S) value to 1.00.
3. Connect the Personal Ozone Monitor to the manifold on the ozone
calibration setup. If a particle filter will be used in normal operation, the
calibration must be performed through the filter. The manifold must be
vented to atmosphere so that pressure does not build up in the calibration
setup. Connection of the POM directly to a pressurized output of any
device can damage the instrument.
4. Verify that the flow rate into the manifold is greater than the total flow
required by the Personal Ozone Monitor plus any other flow demand
drawing from the manifold such as a UV photometer or ozone transfer
standard.
12.2. Measurement of Zero Air
1. Verify that the zero air supply is on and the ozone generator is off. The
same zero air supply used in the ozone generator must be used in the zero
air measurement.
2. Allow the POM to sample zero air until the response is stable.
3. Record the average zero air response.
Page 37

Personal Ozone Monitor Manual Rev. E-2
29
12.3. Measurement of Ozone Standards
1. Generate an ozone concentration slightly less than the concentration range
of interest and allow the ozone generator to warm up for at least 5 minutes.
The same zero air supply used for making zero air measurements must be
used in the ozone generator.
2. Allow the Personal Ozone Monitor to sample the ozone concentration
standard until a stable response is measured.
3. Record the average response of the Personal Ozone Monitor as well as
either the average response of the UV photometer or the transfer standard.
4. Generate several other ozone concentration standards. At least 5 ozone
concentration standards are recommended over the range of interest.
5. For each ozone concentration standard, record the response of the
Personal Ozone Monitor as well as either the response of the UV
photometer or the transfer standard.
12.4. Calibration Curve
1. Plot the POM Monitor responses (y-axis) versus the corresponding
standard ozone concentrations (x-axis).
2. Fit the data to a straight line (y = mx + b) using the linear regression
technique to determine the calibration relationships, where m = slope and b
= intercept.
3. Determine if any points deviate significantly from the line, which is an
indication of an error in determining the calibration curve. The error may
be due to the calibration setup or the Personal Ozone Monitor being
calibrated. The most likely causes of problems for the POM are leaks, a
malfunctioning ozone scrubber, a contaminated valve, or contamination in
the optical setup. See the “Troubleshooting” section of this manual
(Section 13).
4. The inverse of the slope of the line (1/m) is the gain factor (S) and the
negative of the intercept (–b) is the offset (Z, in units of ppb) that need to
be applied to the instrument response to calibrate it to the primary ozone
standard. If the intercept is outside of the range from –10 to 10 or the
slope is outside of the range from 0.90 to 1.10, this is an indication of a
problem in the calibration setup or the instrument being calibrated. The
most likely cause of errors in the POM are leaks, a malfunctioning ozone
scrubber, a contaminated valve, or contamination in the optical setup. See
the “Troubleshooting” section of the manual (Section 13).
5. Enter the calibration menu (Main Menu / Cfg / Cal) in the instrument
firmware and set the calibration parameters Z and S as determined above.
Note that if the calibration is done in units other than ppb, the Z value must
be converted to ppb before entering the number into the calibration menu.
12.5. Periodic Zero and Span Checks
To ensure the quality of the Personal Ozone Monitor data, periodic zero and span
checks can be performed by following the steps below:
Page 38

Personal Ozone Monitor Manual Rev. E-2
30
1. A zero check is performed by sampling zero air with the POM as described
in Section 12.2 above, “Measurement of Zero Air.”
2. A span check is performed by sampling an ozone concentration at the high
end of the concentration range of interest following the “Measurement of
Ozone Standards” Section 12.3 above.
3. Average measurements from the zero check or span check should be within
the instrument specifications. If the measurements are not within
specifications, this is an indication of problem in the calibration setup or the
POM being checked. The most likely causes of problems in the POM are
leaks, a malfunctioning ozone scrubber, a contaminated valve, or
contamination in the optical setup. See the “Troubleshooting” section of this
manual (Section 13).
Page 39

Personal Ozone Monitor Manual Rev. E-2
31
13. MAINTENANCE/TROUBLESHOOTING
The Personal Ozone Monitor is designed to be nearly maintenance-free. The only
component that requires routine maintenance is the internal ozone scrubber, which
should be changed at least once every six months (~4,000 hours) of operation.
Return the instrument to 2B Technologies for replacement of the internal ozone
scrubber.
Also, the inlet filter (user supplied) should be changed as recommended by the filter
manufacturer.
Other components with a limited lifetime are the air pump (~3,000 hours), lamp
(~20,000 hours) and solenoid valve (rarely fails). It is recommended that the
instrument be returned to 2B Technologies if any of these components fail.
The following are indications of various instrument malfunctions.
Air Pump Failure: The instrument will not make a humming sound. Also, the circuit
breaker may prevent the instrument from powering up if the motor in the air pump
develops a short.
Lamp Failure: The ozone measurements will be erratic and the Lamp Test will show
0.0 volts for the photodiode voltage.
Solenoid Valve Failure: The ozone readings will be low and average to close to zero
if the solenoid valve is not switching. Partial switching of the solenoid valve will cause
the instrument to read low but not zero.
Contaminated Flow Path: The instrument will typically have a large positive or
negative offset, and the ozone readings will be low once corrected for the measured
offset.
Help with trouble shooting is provided in the following table. Because the POM
instrument is constructed to be extremely compact, we recommend returning it to 2B
Technologies for any repairs or diagnostics that require disassembly (including
cleaning of the flow path and/or replacement of the internal mercury scrubber, pump,
lamp, or solenoid).
Page 40

Personal Ozone Monitor Manual Rev. E-2
32
Table 13.1. Troubleshooting the Personal Ozone Monitor for performance
problems.
Problem/symptom
Likely cause
Corrective action
Instrument does not turn
on.
Power not connected
properly or circuit breaker
open.
Check external power
connection for reverse
polarity or a short and wait a
few minutes for the thermal
circuit breaker to reset.
Instrument turns on then
powers off.
Burned out air pump.
Return the instrument to 2B
Tech for replacement of the
air pump.
Readings are noisy with
standard deviations greater
than 2.5 ppb.
Lamp output is weak, below
0.6 V on Lamp Test.
Flow path contaminated.
Return the instrument to 2B
Tech for replacement of the
lamp.
Return the instrument to 2B
Tech for cleaning.
Required calibration
parameters are large (>9
ppb offset and/or >9%
slope) when calibrated
using a standard ozone
source or reliable ozone
instrument.
Internal ozone scrubber is
contaminated.
Flow path is contaminated.
Solenoid valve is
contaminated and not
opening and closing properly.
Air pump is not drawing
sufficient flow.
Return the instrument to 2B
Tech for replacement of the
internal ozone scrubber.
Return the instrument to 2B
Tech for cleaning.
Return the instrument to 2B
Tech for replacement of the
solenoid valve if not working
properly.
As a first check, hold your
finger over the air inlet to
determine whether air is
being drawn in. If there is
flow, measure the flow rate
by attaching a high
conductance flow meter to
the air inlet. Air flow should
be greater than 0.5 L/min
when making measurements.
If flow is lower, check for
leaks. If there are no leaks,
return the instrument to 2B
Tech for replacement of the
air pump.
Page 41

Personal Ozone Monitor Manual Rev. E-2
33
2B Technologies offers reasonably priced customer service for instrument repairs.
The calibration service includes cleaning of the entire flow path with methanol, testing
of all components for proper function, installation of a new internal ozone scrubber
and calibration against a NIST-traceable standard. The best way to contact us for
service is to log a customer service ticket at www.twobtech.com/techsupport.
Normally, you will hear back from us by email within a few hours. Or, call us at
+1(303)273-0559.
There is a great deal of technical information about our instruments posted as
technical notes at www.twobtech.com/downloads_tech_notes.htm. Manuals,
brochures, software, technical notes, and scientific papers may be downloaded at
www.twobtech.com/downloads_POM.htm.
Page 42
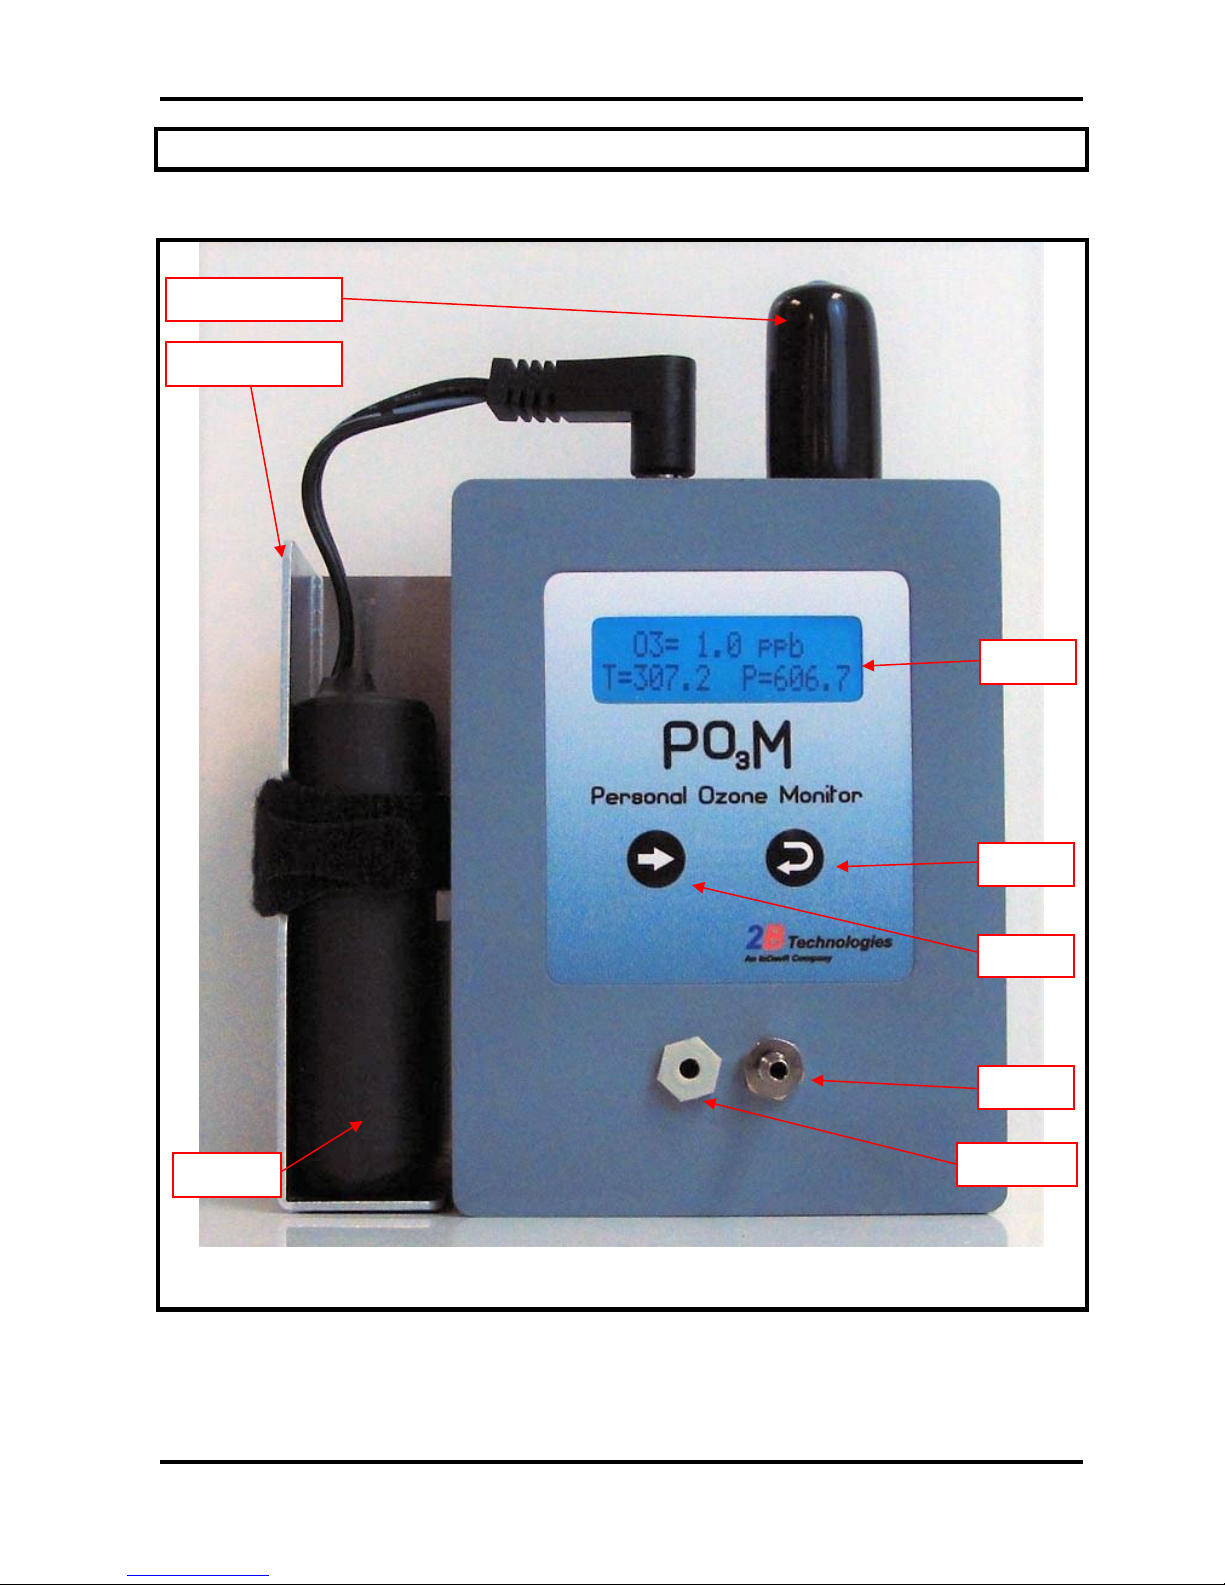
Personal Ozone Monitor Manual Rev. E-2
34
14. LABELED INSTRUMENT PHOTOS
Figure 14.1. Front Cover of the POM.
Select
Scroll
LCD
Inlet
Exhaust
Battery
GPS Antenna
Battery Holder
Page 43
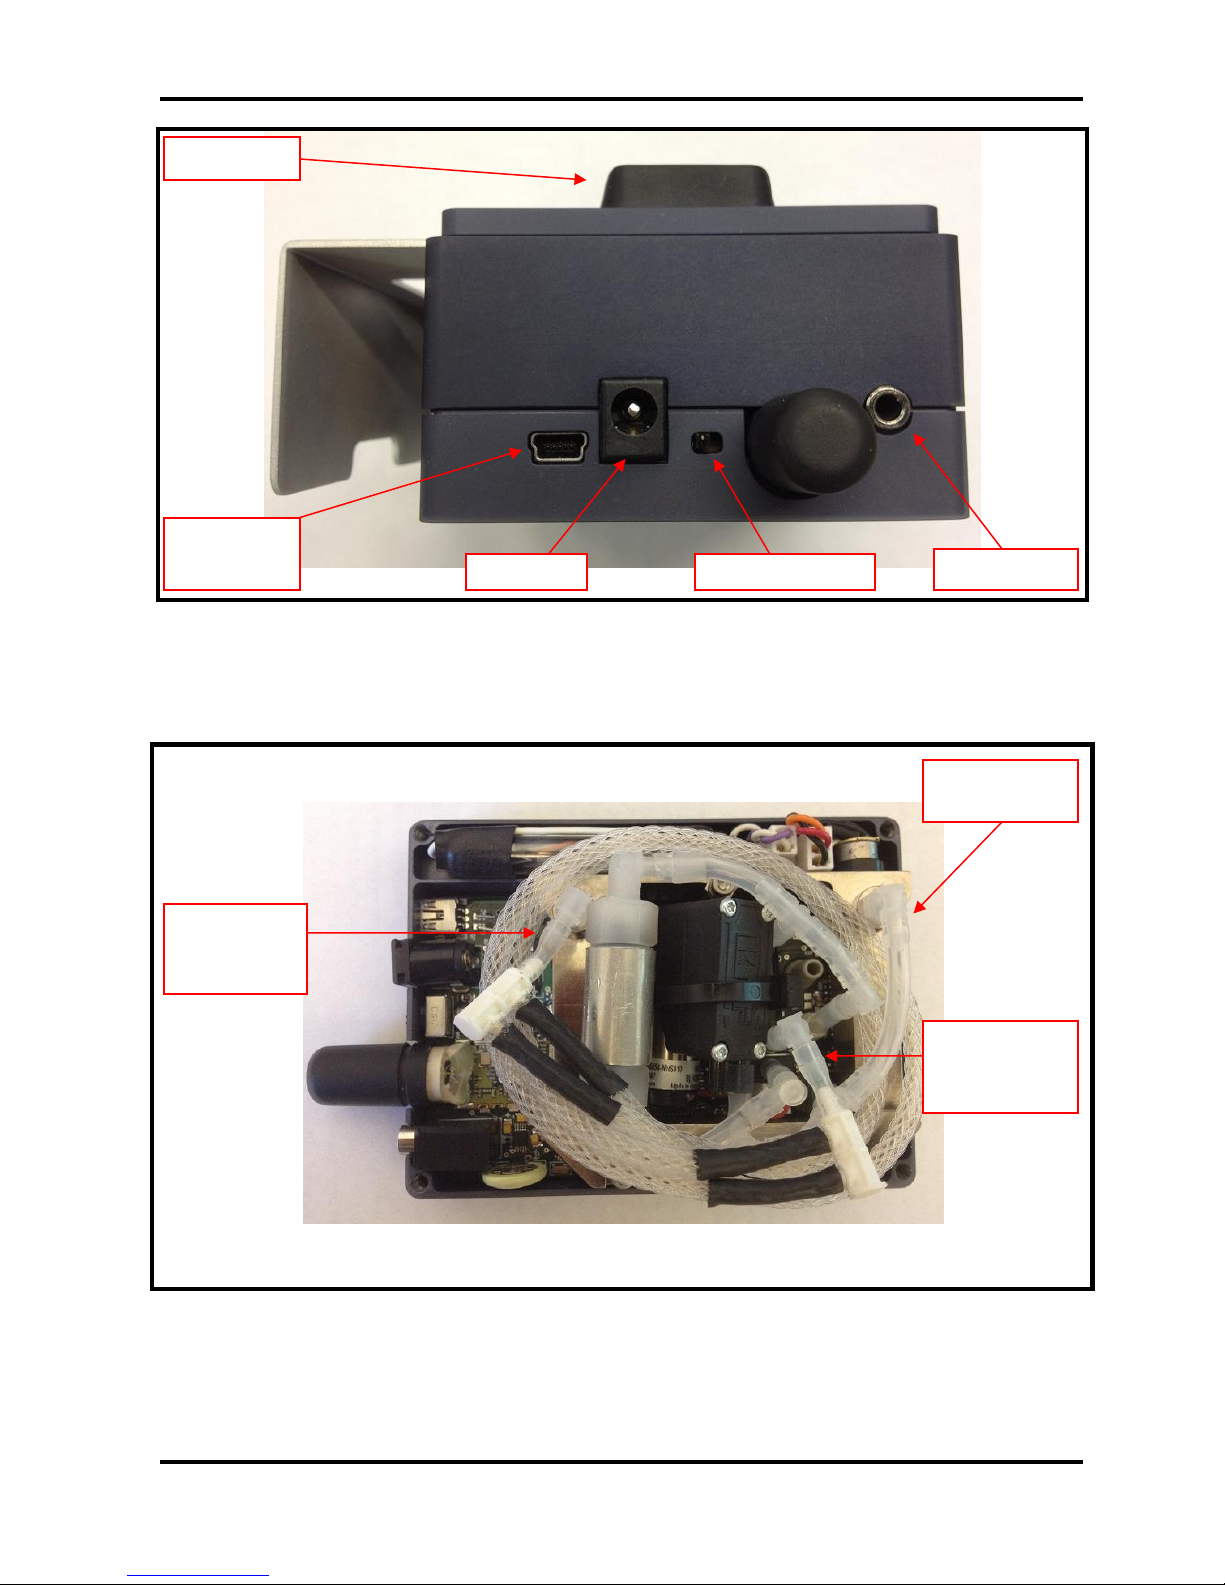
Personal Ozone Monitor Manual Rev. E-2
35
Figure 14.2. Top View.
Figure 14.3. Inside View.
DewLineTMCell
Connection
DewLineTMValve
Connection
Power Switch
USB
Connector
Serial Port
Power In
Belt Clip
Cell-pump
Connection
Page 44
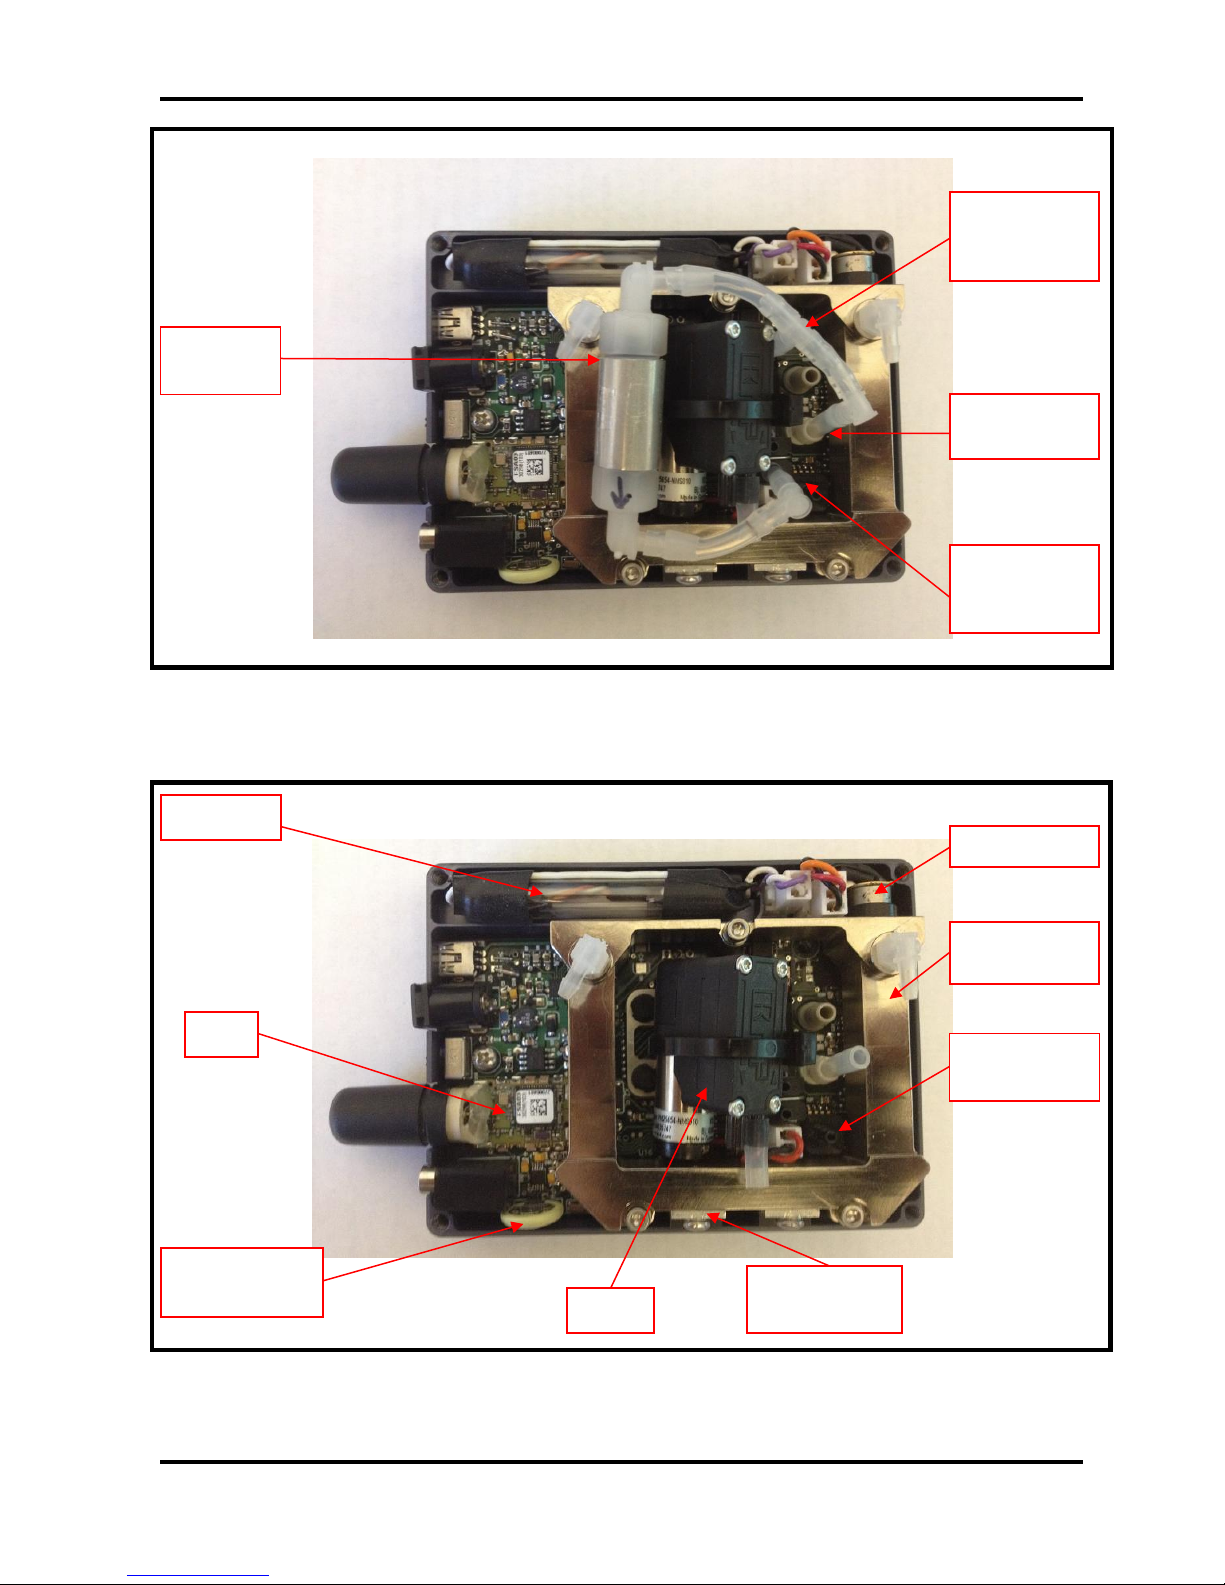
Personal Ozone Monitor Manual Rev. E-2
36
Figure 14.4. Inside view without Nafion DewLineTM.
Figure 14.5. Inside view without Scrubber or Nafion DewLineTM.
Inlet
Connection
Ozone
Scrubber
ScrubberValve_NO
Connection
ScrubberValve_NC
Connection
Photodiode
UV-Lamp
GPS
Clock Battery
3.3V
Pump
Absorption
Cell
Temperature
Sensor
Pressure
Sensor
Page 45

Personal Ozone Monitor Manual Rev. E-2
37
15. PARTS LIST
The following list includes those parts that are user serviceable by the user. They
may be ordered online from 2B Technologies from our website here:
Please see the 2B Technologies website for a full and updated list of parts and pricing
for the Personal Ozone Monitor: http://twobtech.com/parts-online.html
It is recommended that the instrument be sent to 2B Technologies servicing of any
internal parts.
Part Number Description
ZEREXTPOM Ozone zeroing scrubber (external)
SERCABLPOM Serial port cable (to computer)
USBMNICABL Mini USB Cable (to computer)
12VADP 12 V DC cigarette lighter adapter
TEFTYG25 Teflon-lined Tygon tubing (25 ft)
TEFTYG05 Teflon-lined Tygon tubing (5 ft)
SILTUB05 Silicone tubing (5 ft)
Page 46
Personal Ozone Monitor Manual Rev. E-2
38
16. SERVICE LOG
Date/
Hours
Calibrated
Cleaned
New O3
Scrubber
New Pump
(main)
New
Lamp
Other
Page 47

Personal Ozone Monitor Manual Rev. E-2
39
Date/
Hours
Calibrated
Cleaned
New O3
Scrubber
New Pump
(main)
New
Lamp
Other
Page 48

Personal Ozone Monitor Manual Rev. E-2
40
Appendix A: Using the 2B Technologies Display and Graphing
Software
Copyright© 2B Technologies, Inc. All rights reserved
Introduction
2B Data Display© is an easy way to display and save data from your serial or USB
connection.
With easy one-click operations, data are read from your instrument and displayed on
an extremely versatile chart. Two items, such as Ozone and Temperature, can be
displayed simultaneously on the chart with multiple zoom levels. Data are
automatically saved to a .txt file and can optionally be saved to a .CSV file to be read
in Excel. Saved data can be restored for later viewing and analyzing on the chart. By
requesting an account with 2B Technologies, you can upload your data and view it on
a Google Earth overlay.
Downloading the Software
Go to http://twobtech.com/downloads_software.html and select the Software tab.
Click the link for “2B Tech Display and Download Software.” Follow the instructions,
doing the two installations if needed and choosing to save the “setup.exe” file.
Double-click the setup.exe download to launch the 2B Data Display application.
Connecting Devices
Connect to a Monitor
1. Select the device you are connecting to from Settings: Select Device...
2. Click OK.
3. Select the Connection you will be using from Settings: Connection...
Choose the settings as follows:
a) Port:
• The default port is “COM1” for computers with a serial port.
• If using a USB connection, check for the correct port in the “Device
Manager” under “Ports” located in: Control Panel : System : Device
Manager.
• If using a USB to Serial adapter, check for the correct port the same as for
a USB connection and look for the name of the adapter (e.g., Belkin,
Prolific, or other USB to Serial adapter manufacturers).
b) Baud Rate: The Default baud rate of the software is 2400. Check your
monitor’s settings in the “Cfg / I/O” menu and match the software with the
monitor’s setting (19200 for the POM). Note that for the USB port, the baud
rate must match the baud rate of the Monitor at the Monitor’s startup.
c) Parity: None
d) Data Bits: 8
e) Stop Bits: One
Page 49

Personal Ozone Monitor Manual Rev. E-2
41
4. Click Start button in the Instrument Data Capture section in the upper left corner of
the main screen.
a) The “Save As” window will appear. A default file name will appear which is
made of the date and time. You may change the filename and change where
it is saved if you wish.
b) Click the “Save” button. This will start the data capture software and data will
fill into the chart as they are transmitted from the device.
c) The red OFF text will change to green ON text. The text: Waiting for data…
will appear until data arrives from the instrument. If the instrument
measurement frequency is set to 2 seconds (fast mode), you will see a data
point every 2 seconds. The instrument can be set to 10 seconds
(measurement mode) or to averaging modes of 1 minute, 5 minutes, and 1
hour in the Avg submenu on the instrument.
Connect to Weather Station (Davis Vantage Pro)
1. Be sure the weather station is physically connected to the USB port or Serial port
of the computer.
2. Select the COM port for the weather station from Settings : Weather Connection
Settings…
3. Select “Retrieve Weather Data” from the “Weather Link” menu. A window will
appear and the software will try to retrieve the weather station data. If the
connection is good, weather data will be displayed in the window. If not, an error
message will appear. Try a different com port if the error message appears. You
may move this window so it is out of the way or you may close it. The weather
data is updated every 5 seconds.
• Since the Monitor and the Weather Station both use COM ports, you may have
to unplug one of the USB adapters from the PC to determine which device is
using which COM port.
4. To bring up the window again if you have closed it, select “Display Weather Data.”
Viewing Data
The Data Grid Tab
1. Make sure the application is connected to a device or that you have opened a
previously saved data file.
2. Click the Data Grid tab on the right side of the screen.
3. The data lines received from your instrument will be listed in a grid with the latest
point at the top.
4. The header contains the device specific variables (e.g., Ozone, Cell Temp...). Log
Number is always listed even if your instrument is not set to log.
The Charts Tab
1. Make sure the application is connected to a device or you have opened a
previously saved data file.
2. Click the Charts tab on the right side of the screen.
3. Select which data items to display from the drop down windows “Data 1” and “Data
2.”
Page 50

Personal Ozone Monitor Manual Rev. E-2
42
4. The data points will appear in a graph window in the middle of the screen.
5. Adjust the zoom level by pressing the + or – buttons under the Settings button
(upper right side of screen).
6. Adjust the Y scale or set the Auto Range feature by pressing the Settings button
a. Check the Auto Range box to use autoscaling.
b. Uncheck the Auto Range box to manually set Y max and Y min for the Data 1
and Data 2 fields.
The Buffer Tab
• Selecting the Buffer tab brings up a buffer window, similar to Tera Term or
HyperTerminal, where all data from the serial port are displayed.
• From this tab, the user can also send commands through the serial port by typing
on the keyboard. This is only applicable if the device that is connected accepts
serial commands. See the instrument manual for a list of the serial commands.
• This buffer window can also be used for troubleshooting for instances when: the
baud rate, device, or serial port is unknown. For example, if the status bar in the
“Instrument Data Capture area states “Receiving…” and no data appear in the
Data Grid or the Charts, click on the Buffer tab to view the serial data. If the
correct device is not selected, no data will be displayed in the Data Grid or the
Charts, but data will be displayed in the Buffer window.
Saving Data
Saving Data to a .txt File
1. Click the Start button in the Instrument Data Section to begin collecting data from
the instrument.
2. A window will pop up to prompt for the name and location of the file.
3. Click Save to begin the data collection.
4. All data read from the monitor through the COM port are written to the .txt file in
real time until Stop is clicked.
Saving Data to a .CSV or an Excel File
NOTE: Weather data are NOT saved to the .txt file. In order to save weather data, be
sure to save a .CSV file after Stop is clicked.
1. After collecting data, click the Stop button in the Instrument Data Capture Section
on the main screen.
2. A window will pop up to ask you if you would like to save to a CSV file as well.
Click Yes.
3. A default name appears from the date and time of the data capture. You may
change the name and path of the file if you wish.
4. Click on the Save button.
Opening Files
1. To open a file, click Open from the File menu.
2. Navigate to the folder where the file was stored.
3. Select either the .txt file or the excel file and press Open.
Page 51

Personal Ozone Monitor Manual Rev. E-2
43
1. NOTE: To view weather data, you must open the corresponding .CSV file.
4. Choose the correct device associated with the file.
a. If you are unsure, open the file in a text editor or Excel to determine which
device.
Serial and USB Commands
The menu commands are the same as given in Section 8 of this manual.
 Loading...