USL PCA-100 User Manual

Color Meter
181 Bonetti Drive
San Luis Obispo, CA 93401 ph: 805-549-0161
fax: 805-549-0163 e-mail:usl@uslinc.com

PCA INSTRUCTION MANUAL |
Ultra Stereo Labs, Inc. |
One Year Limited Warranty
USL, Inc. warrants that each product manufactured by it will be free from defects in material and workmanship under normal usage for a period of one (1) year after its purchase new from an authorized dealer. Our obligation under this warranty is limited to repairing or replacing any product or component which we are satisfied does not conform with the foregoing warranty and which is returned to our factory, freight paid, or serviced by one of our authorized contractors. The forgoing warranty is exclusive and in lieu of all other warranties, whether expressed or implied. Such warranty shall not apply to any product or component (A) repaired or altered by anyone other than USL, Inc. or an authorized service contractor;
(B) tampered with or altered in any way or subjected to misuse, negligence or accident or (C) which has been improperly connected installed or adjusted other than in accordance with USL, Inc.’s instruction.
- 1 -

PCA INSTRUCTION MANUAL |
Ultra Stereo Labs, Inc. |
Table of Contents
Getting Started ...................................................... |
3 |
How It Works ......................................................... |
5 |
Measuring Color .................................................... |
6 |
Terminology ........................................................... |
8 |
Measurements ...................................................... |
9 |
Making The Measurements ................................... |
9 |
Specifications .......................................................... |
11 |
Please record the following information for your records: Model: ___________________ Serial Number: ___________
Date of Purchase: __________
Purchased from: ________________________________
- 2 -

PCA INSTRUCTION MANUAL |
Ultra Stereo Labs, Inc. |
PRELIMINARY OPERATING INSTRUCTIONS
This color analyzer measures luminance (in ft-Lamberts or candelas per square meter), chromaticity, (CIE 1931 x,y values) and correlated color temperature, cct, in Kelvin. It has an optical viewfinder with a seven degree field of view. Measurements are made within a one degree area that is indicated by a small circle in the center of the field. The measurement results are displayed within a window on your laptop computer. The software included is designed to work with Windows versions 98, ME, 2000 and XP.
GETTING STARTED
You should have: the Projection Color Analyzer, a USB cable and the software installation CD.
 IMPORTANT
Install the Color Analyzer software BEFORE plugging in the cable and analyzer.
Insert the CD in the computer CD tray. The install software should automatically start. If not, go to the “Run” item on your start menu and enter X:\set up. (Where X is the letter indicating your CD drive.) Follow the instructions. After the sofrtware installation is complete, connect the Color Analyzer to the USB port of your laptop computer using the cable supplied. Next, find the little rainbow icon on your desk top.
Double click on this, the Color Analyzer icon, to start the software. If you point the analyzer at a wall or surface in the room, the laptop display will indicate the luminance and color characteristics of the light reflected from the surface.
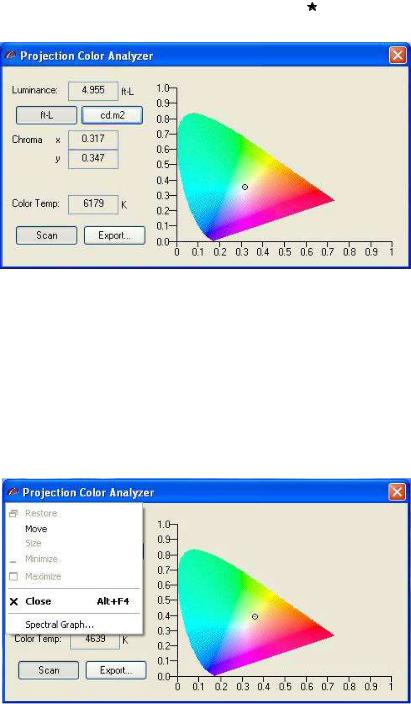
The Color Analyzer display window, (figure one), shows the luminance, chromaticity and the correlated color temperature values on the left and a graphical display of the color characteristics on the right. The position of the small spot within the color chart shows a representation of the target color measured within the viewfinder’s one-degree circle. The x and y values of chromaticity are shown on the horizontal and vertical scales respectively.
- 3 -

PCA INSTRUCTION MANUAL |
Ultra Stereo Labs, Inc. |
Figure 1
Luminance values can be shown in either foot-Lamberts or candelas per square meter. The choice is made by clicking on either button below the luminance value box.
A spectral graph of the light seen by the Color Analyzer is shown in figure three. This graphical representation can be displayed by first clicking on the small rainbow icon in the upper left-hand corner of the laptop display and then on the spectral graph option as shown in figure two.
The horizontal axis displays color wavelength in nanometers and the vertical axis indicates relative amplitude of the spectral components in arbitrary units.
Figure 2
- 4 -
 Loading...