


Graphing Calculator
EL-9450/9400
OPERATION GUIDE
Introduction
The EL-9450/9400 was developed to meet the needs of an expanding education market and is based on three concepts: easy to teach, easy to learn and easy to use. The EL-9450/9400 has been designed with simplified operations and time-saving features, allowing teachers to concentrate on actual teaching.
This manual was designed to introduce teachers to the unique features of the EL-9450/9400 using detailed operation examples.
Built-in slide shows Educational tools (OHP/PC-link/Data collection)
Easy to Teach
Easy to Learn |
Easy to Use |
Shift/Change function |
Large display |
Equation editor |
Rapid graph |
Split display |
Rapid window |
|
Rapid zoom |
Contents |
Sales points |
P 1 |
System options |
|
Basic operation |
P 2 |
PC-link system |
P 14 |
|
|
Equation editor |
P 4 |
Set to set communication |
P 15 |
|
Features |
|
OHP system |
P 16 |
|
Shift |
P 5 |
Menu tree 1~6 |
P 17 |
|
Change |
P 6 |
Specifications |
P 23 |
|
Slide show |
P 7 |
|
|
|
Slide show selections |
P 8 |
|
|
|
Graphing procedure |
P 10 |
|
|
|
Rapid graph |
P 11 |
|
|
|
Rapid window |
P 12 |
|
|
|
Rapid zoom |
P 13 |
|
|
|
|
|
|
|
Sales points
1Large 96 x 64-dot display
2 Graph Shift/Change shows how "changing" the graph affects the equation
3 Slide Shows reduce class preparation time
4 Equation Editor shows equations just as in textbooks
5 Rapid graph/Rapid window simplify graphing procedures
6 Rapid zoom allows easy adjustment of window size
1
Basic operation
Power ON/OFF
|
|
|
|
Power on |
|
|
|
|
Power off |
|
|
|
|
|
|
|
|
|
Erase equations and |
CL |
|
|
||
|
|
QUIT |
|
remove error displays |
|
|
|||
|
|
|
|
|
|
|
CL |
|
Cancel of previous |
|
|
|
|
function (Escape) |
Function keys
|
Y = |
|
|
Use to enter equations |
||||
|
|
|
|
|
|
|
|
Use to draw graphs |
|
|
|
|
|
|
|
|
|
|
|
|
|
|
|
|
|
Use to view table of function value |
|
|
|
|
|
|
|
|
|
|
|
|
|
|
|
|
|
Use to set size of viewing window |
|
|
|
|
|
|
|
|
|
|
|
|
|
|
|
|
|
|
|
|
|
|
|
|
|
|
Use to adjust the viewing range |
|
|
|
|
|
|
|
|
|
|
|
|
|
|
|
|
|
|
|
|
|
|
|
|
|
|
Use to trace graphs |
|
|
|
|
|
|
|
|
|
|
|
|
|
|
|
|
|
Use to enter calculation mode |
|
|
|
|
|
|
|
|
|
|
|
|
|
|
|
|
|
Use to enter slide show mode |
|
|
|
|
|
|
|
|
|
|
|
|
|
|
|
|
|
|
|
|
|
|
|
|
|
|
|
|
|
|
|
|
|
|
|
Use to operate Rapid Graph/Rapid |
|
|
|
|
|
|
|
|
|
|
|
EZ |
|
|
||||
|
|
|
|
|
|
|
|
Window and Rapid Zoom functions |
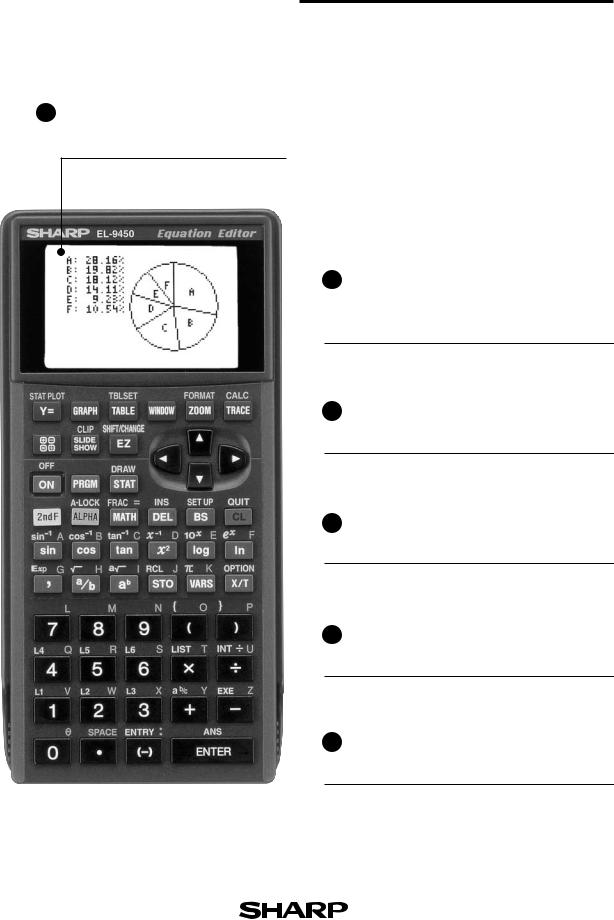
Names of parts
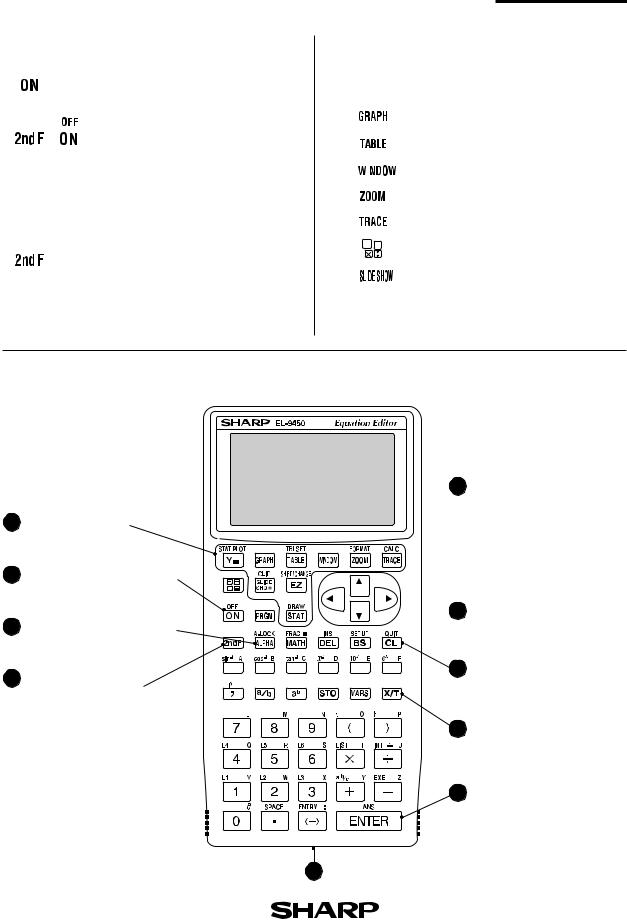
 5 Display screen
1 Graphing keys
2 Power supply ON/OFF key
 6 Cursor movement keys
3 Alphabet specification key


 7 Clear/Quit key 4 Secondary function


specification key
8 Variable enter key
9 Calculation execute key
10 Communication port for peripheral devices
2
Basic operation
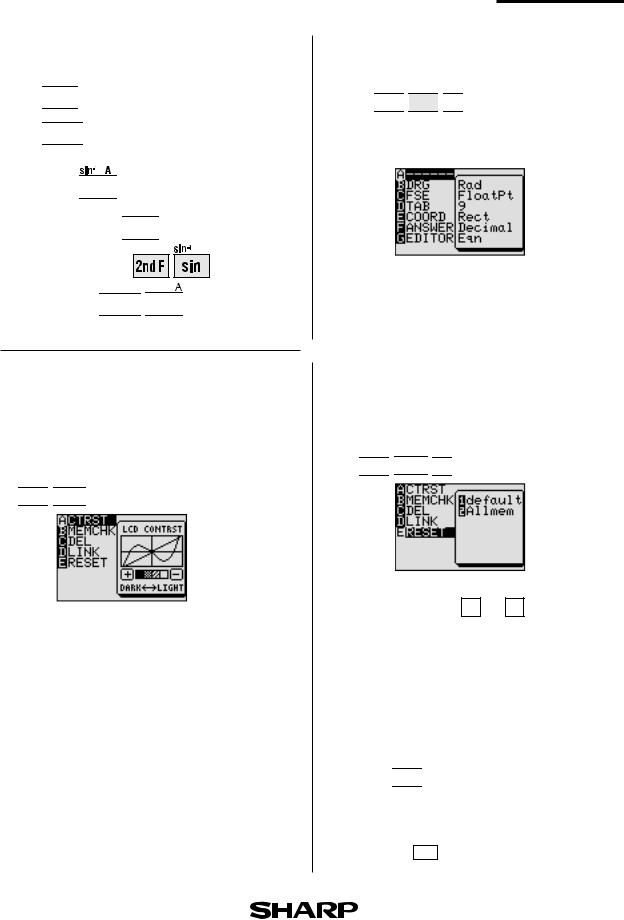
Guide to key use
Press 


 to use secondary functions (in yellow).
Press 

 to use the alphabet keys (in blue).
Example: 


To select “sin”: 


To select “sin-1”:
To select A: 


SET UP menu
Press 


 SET UP


 .
.
•Contents displayed on the right side of the screen are the current settings.
|
There may be differences in the results |
] |
|
of calculations and graph plotting |
|
|
]depending on the SET UP settings. |
|
|
|
|
|
|
|
|
|
|
Adjusting screen contrast
•The contrast adjust screen will appear when pressing


 .
.
Press |
|
|
|
|
to lighten contrast. |
|
|
|
|
||
Press |
|
|
|
|
to darken contrast. |
|
|
|
|
||
|
|
|
|
||
|
|
|
|
|
|
Reset function
1) When trouble occurs
Press 


 to enter the reset mode.
•Use this function ( 1 or 2 ) to return all settings to the default value or to delete all data.
2) All RESET operation
•If trouble still occurs, proceed as follows:
1.Press the RESET switch on the back.
2.Press 

 .
.
•Returns to the initial display.
CAUTION
Do not press CL in step 2. It will delete all data stored in the calculator.
3
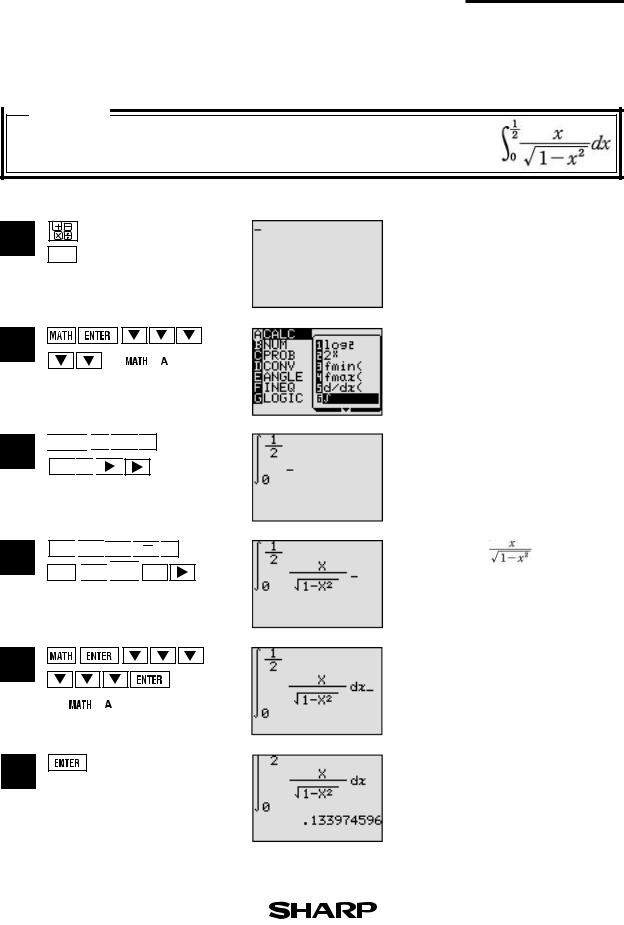
Equation editor
The equation editor allows equations to be viewed just as they are written in textbooks. This aids student comprehension and allows mistakes to be found quickly.
 Example
Input the equation and see how it can be easily viewed with the equation editor.
1
2
3
4
5
Key Operation |
Display |
Notes |
CL
(or |
|
|
|
|
6 |
) |


 0
0 


 1 a/b
1 a/b 
 2
2 


X/T 
 a/b
a/b 


 1
1 
 X/T
X/T 
 x2
x2 

Clear the display.
Select CALC and
 (Integral function)
Enter the range of the integral.
Enter
Complete equation input.
(or |
|
|
|
|
0 |
|
7 |
) |
6
]
Calculate the expression.
The blinking mark in the upper right ] side of the display indicates the expression is being calculated.
4
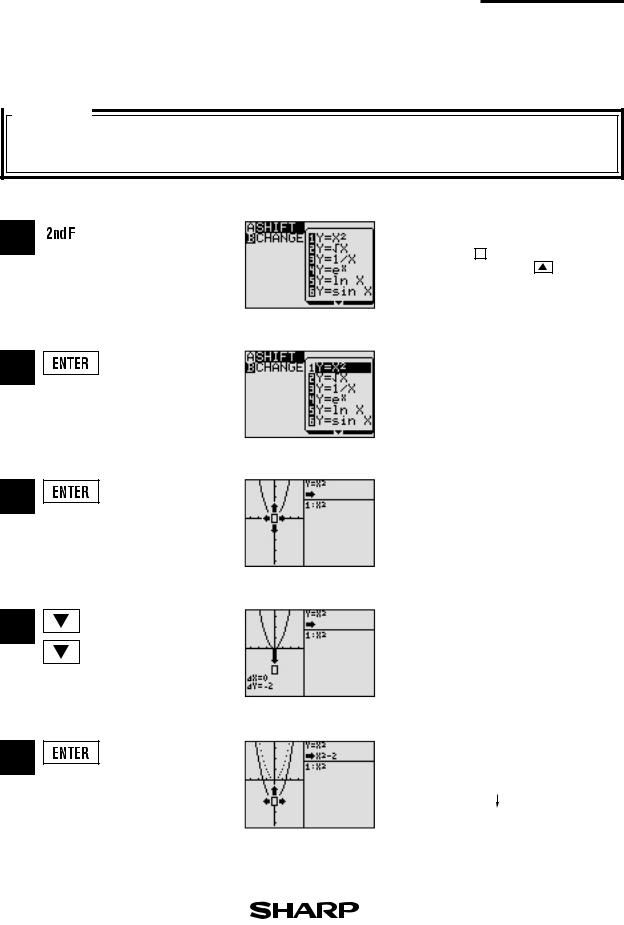
Shift(Change the location of graphs)
Graph shift function helps students grasp the relationship between an equation and its graph. Shift the graph’s location without changing its shape, and the change is immediately reflected in the equation on the right side of the display.
 Example
When the graph of y = x2 is shifted downward, how does this affect the equation?
1
2
3
4
5
Key Operation Display Notes
|
|
SHIFT/CHANGE |
Enter SHIFT/CHANGE mode. |
||
|
|
|
If |
|
SHIFT is not already |
|
|
|
|
||
] |
highlighted press |
. |
] |
Select shift. Cursor moves to the equation menu.
Select the equation: y = x2 and draw the graph.
Select the location of the shift: move cursor down twice.
View the result of the shift.
] |
y = x2 |
] |
y = x2-2 |
5
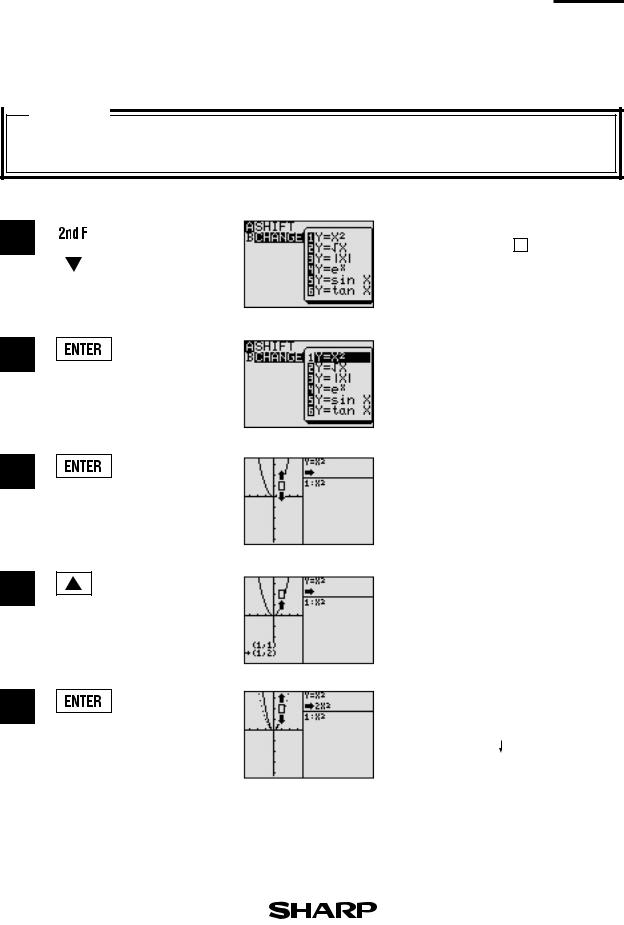
Change (Change the shape of the graphs)
Graph change function helps students grasp the relationship between an equation and its graph. Change the shape of the graph, and the change is immediately reflected in the equation on the right side of the display.
 Example
When the graph of y = x2 is changed, how does it affect the equation?
1
2
3
4
5
Key Operation |
Display |
Notes |
||||
|
|
|
|
Enter SHIFT/CHANGE mode |
||
|
|
SHIFT/CHANGE |
|
|||
|
|
|
and specified ( |
|
CHANGE ). |
|
|
|
|
|
|
||
|
|
|
|
|
|
|
|
|
|
|
|
|
|
Select change. Cursor will move to the equation menu.
Select the equation: y = x2 and draw the graph.
Select the location of the change: increase the value of y- coordinates.
View the result of the change.
] |
y = x2 |
] |
y = 2x2 |
6
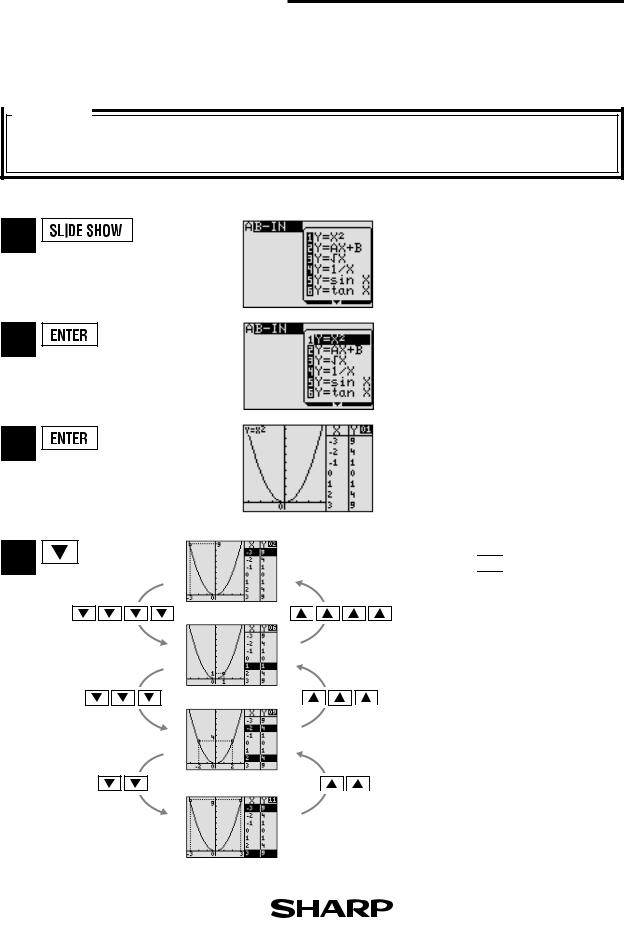
Slide show
Slide show assists with teacher preparation. By selecting from the built-in options or creating your own series of slides, you can demonstrate lessons with minimum preparation time.
 Example
Use the built-in slide show of y = x2 to show how the coordinates change as you move along the graph.
1
2
3
4
Key Operation |
Display |
Notes |
Specified SLIDE SHOW mode.
Select the built-in menu.
Select y = x2 and the first slide appears.
Begin the slide show by pressing the 

 cursor key.
Moving between the values you can follow the changes in the graph’s coordinates, making the nature of the graph easier to understand.
*View the selection of built-in slide shows on the following pages.
7
 Loading...