


 Loading...
Instruction Manual
Body Composition MONITOR
with Scale
Model HBF-500

TABLE OF CONTENTS |
|
Before Using the Monitor |
|
Introduction . . . . . . . . . . . . . . . . . . . . . . . . . . . . . . . . . . . . . . . . . . . . . . . . |
. .3 |
Safety Information . . . . . . . . . . . . . . . . . . . . . . . . . . . . . . . . . . . . . . . . . . . |
. .4 |
Useful Information . . . . . . . . . . . . . . . . . . . . . . . . . . . . . . . . . . . . . . . . . . . . |
.6 |
Body Mass Index and Ideal Weight . . . . . . . . . . . . . . . . . . . . . . . . . . . |
.6 |
Body Fat . . . . . . . . . . . . . . . . . . . . . . . . . . . . . . . . . . . . . . . . . . . . . . . . |
.7 |
Visceral Fat . . . . . . . . . . . . . . . . . . . . . . . . . . . . . . . . . . . . . . . . . . . . . . |
.8 |
Resting Metabolism & Skeletal Muscle . . . . . . . . . . . . . . . . . . . . . . . . |
.9 |
Long-term Planning for Successful Weight Loss . . . . . . . . . . . . . . . . . |
11 |
Principle of Body Composition Calculation . . . . . . . . . . . . . . . . . . . . . |
12 |
Recommended Measurement Times . . . . . . . . . . . . . . . . . . . . . . . . . . . |
13 |
Operating Instructions |
|
Know Your Unit . . . . . . . . . . . . . . . . . . . . . . . . . . . . . . . . . . . . . . . . . . . . . . |
15 |
Battery Installation . . . . . . . . . . . . . . . . . . . . . . . . . . . . . . . . . . . . . . . . . . . |
18 |
Setting the Date and Time . . . . . . . . . . . . . . . . . . . . . . . . . . . . . . . . . . . . . . |
20 |
Setting Personal Data . . . . . . . . . . . . . . . . . . . . . . . . . . . . . . . . . . . . . . . . . |
22 |
Changing Personal Data . . . . . . . . . . . . . . . . . . . . . . . . . . . . . . . . . . . . |
24 |
How to Take a Measurement . . . . . . . . . . . . . . . . . . . . . . . . . . . . . . . . . . . . |
26 |
How to Measure Weight Only . . . . . . . . . . . . . . . . . . . . . . . . . . . . . . . . . . . |
32 |
How to Use the Memory Function . . . . . . . . . . . . . . . . . . . . . . . . . . . . . . . |
33 |
Care and Maintenance
Error Indicators . . . . . . . . . . . . . . . . . . . . . . . . . . . . . . . . . . . . . . . . . . . . . .37
Troubleshooting Tips . . . . . . . . . . . . . . . . . . . . . . . . . . . . . . . . . . . . . . . . . .38
Care and Maintenance . . . . . . . . . . . . . . . . . . . . . . . . . . . . . . . . . . . . . . . . .39
FCC Statement . . . . . . . . . . . . . . . . . . . . . . . . . . . . . . . . . . . . . . . . . . . . . . .40
Warranty . . . . . . . . . . . . . . . . . . . . . . . . . . . . . . . . . . . . . . . . . . . . . . . . . . . .41
Specifications . . . . . . . . . . . . . . . . . . . . . . . . . . . . . . . . . . . . . . . . . . . . . . . .42
Notes . . . . . . . . . . . . . . . . . . . . . . . . . . . . . . . . . . . . . . . . . . . . . . . . . . . . . . .43
2

INTRODUCTION
Thank you for purchasing the OMRON® HBF-500 Body Composition MONITOR with Scale.
Fill in for future reference.
DATE PURCHASED:
SERIAL NUMBER:
Staple your purchase receipt here
The Body Composition MONITOR with Scale is easy to use. The monitor calculates the estimated values for body fat percentage with 12 levels, skeletal muscle percentage, resting metabolism and visceral fat level with two levels using the BI (Bioelectrical Impedance). The monitor also calculates the estimated BMI (Body Mass Index) in four ranges as well as weight. Push the power switch on, select your Personal Profile Number, and step onto the measurement platform. The personal memory function can be used to store data for up to four personal profiles. The memory function stores the measurement results for each personal profile from 1 day, 7 days, 30 days and 90 days ago.
Your HBF-500 comes with the following components:
•Main Unit
•Instruction Manual
•4 “AA” Batteries
 WARNING
Do not use, or allow others to use, this monitor if fitted with with a cardiac pacemaker or other implanted medical device.
 WARNING
Pregnant women should not use this device.
 CAUTION
Read all of the information in the instruction manual and any other literature in the box before operating the unit.
SAVE THESE INSTRUCTIONS
3
SAFETY INFORMATION
To assure the correct use of the product, basic safety measures should always be followed including the warnings and cautions listed in this instruction manual.
SAFETY SYMBOLS USED IN THIS INSTRUCTION MANUAL
WARNING |
Indicates a potentially hazardous situation which, if not avoided, could |
result in death or serious injury. |
Indicates a potentially hazardous situation which, if not avoided, may
CAUTION result in minor or moderate injury to the user or patient or damage to the equipment or other property.
OPERATING THE DEVICE
This monitor cannot be used with a cardiac pacemaker or other implanted medical devices. The Body Composition MONITOR with Scale passes an extremely weak electrical current of 50kHz and less than 500 A through your body when taking a measurement to determine the amount of fat tissue. This weak current is not felt while using the monitor. Do not use, or allow others to use, this monitor if fitted with a cardiac pacemaker or other medical device.
 Contact your physician or healthcare provider before beginning a weight reduction or exercise program.
 Keep the monitor out of the reach of young children. Cord can become entangled and cause strangulation. Persons with disabilities or persons that are physically frail should be assisted by another person when using this monitor or use a handrail, a walker, or other support device to prevent falling when stepping on and off the monitor.
Read all of the information in the instruction manual and any other literature in the box before operating the unit.
Do not use mobile telephones, microwave and other devices that generate strong electrical or electromagnetic fields near the monitor. This may result in an operational failure.
Do not step on the edge or the display area of the measurement platform. The monitor may tilt. The display unit may be damaged.
Do not step on the measurement platform when your body or feet are wet, for example after taking a bath or shower. You may slide and lose your balance.
Do not place the monitor on a cushioned floor surface such as a carpet or mat. A correct measurement may not be possible.
Do not use the unit on slippery surfaces such as tile floors or wet floors. A monitor may move. You may lose your balance and fall.
Do not jump on the measurement platform. You may lose your balance and fall. The monitor may be damaged.
Stand on the measurement platform with bare feet. Attempting to stand on the measurement platform when wearing socks may cause you to slip and lose your balance.
4

SAFETY INFORMATION
OPERATING THE DEVICE (continued)
 Should battery fluid leak and contact your eyes, skin or clothing immediately rinse with plenty of clean water. Immediately contact your physician in case of eye contact. (or skin, but not clothing.)
 Dispose of the device, batteries, components and optional accessories according to applicable local regulations. Unlawful disposal may cause environmental pollution.
 Operate the unit only as intended. Do not use for any other purpose.
 This unit is intended for home use only. It is not intended for professional use in hospitals or other medical facilities. This unit does not support the standards required for professional use.
CARE AND MAINTENANCE
 Do not disassemble or modify the unit. Changes or modifications not approved by Omron Healthcare will void the user warranty.
 Do not subject the monitor to strong shocks, such as dropping the unit on the floor.
 Do not submerge the device or any of the components in water.
5
USEFUL INFORMATION
 WARNING
Contact your physician or healthcare provider before beginning a weight reduction or exercise program.
BODY MASS INDEX AND IDEAL WEIGHT
Everybody is concerned about their weight. But what is the basis for determining your ideal weight? The key is Body Mass Index.
How to Calculate BMI
BMI is short for Body Mass Index. This index uses the following simple formula to indicate the ratio between weight and height of a person.
BMI = weight (lb) / height (inch) / height (inch) × 703
The OMRON HBF-500 uses the height information stored in your Personal Profile Number to calculate your BMI classification.
Let’s look at an example
|
|
|
|
|
WEIGHT |
|
|
|
|
|
|
|
|
|
|
|
|
||
|
|
|
|
|
|
|
|
||
|
|
|
|
|
|
BMI |
|
|
|
|
|
|
|
|
|
|
|
|
|
|
|
|
|
|
|
|
|
|
|
|
|
|
|
BMI CLASSIFICATION |
|
|
|
||
|
|
|
|
|
|||||
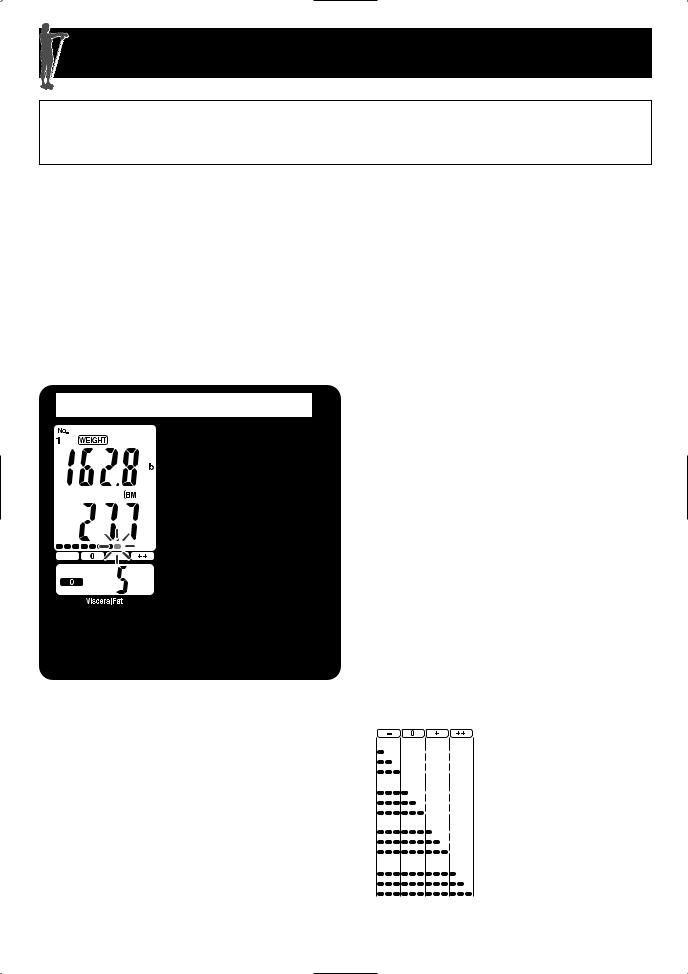
Example of display: |
|
|
|
|
|
||||
• Weight: |
|
162.8 lb |
|
|
|
||||
• BMI: |
27.7 |
|
|
|
|||||
• BMI Classification |
+ |
|
|
|
|||||
Interpreting the BMI Result |
|
|
|
||||||
|
|
|
|
|
|
|
|
|
|
|
|
BMI |
|
BMI (Designation by the WHO) |
BMI Classification Bar |
BMI Rating |
|||
|
|
|
|
||||||
|
|
|
|
|
|
|
|
|
|
|
|
Less than 18.5 |
|
- (Underweight) |
|
7.0 |
- 10.7 |
||
|
|
|
|
10.8 - 14.5 |
|||||
|
|
|
|
|
|
|
|
14.6 |
- 18.4 |
|
|
|
|
|
|
|
|
|
|
18.5 or more and less than 25 |
|
0 (Normal) |
|
18.5 |
- 20.5 |
||||
|
|
20.6 - 22.7 |
|||||||
|
|
|
|
|
|
|
|
22.8 |
- 24.9 |
|
|
|
|
|
|
|
|
|
|
25 or more and less than 30 |
|
+ (Overweight) |
|
25.0 |
- 26.5 |
||||
|
|
26.6 - 28.2 |
|||||||
|
|
|
|
|
|
|
|
28.3 |
- 29.9 |
|
|
|
|
|
|
|
|
|
|
|
|
30 or more |
|
++ (Obese) |
|
30.0 |
- 34.9 |
||
|
|
|
|
35.0 - 39.9 |
|||||
|
|
|
|
|
|
|
|
40.0 |
- 90.0 |
|
|
|
|
|
|
|
|
|
|
The above-mentioned indices refer to the values for obesity judgment proposed by WHO, the World Health Organization.
6
USEFUL INFORMATION
BODY FAT
Hidden Fat Not Revealed by BMI
Although BMI calculates a simple obesity level, there is also hidden fat that not revealed by a BMI designation.
Although both cases are for people of similar height and weight, and their BMI designation are normal, the body fat percentage for case B is high.
That is, although case B has normal body weight, the actual fat level is high, revealing the “hidden fat.” This hidden fat may lead to increased susceptibility to common diseases, even though the BMI designation is normal.
Examples of hidden fat
CaseA |
|
CaseB |
|
F |
Gender |
F |
|
34 |
Age |
34 |
|
5' 7 7/8" |
Height |
5' 7 1/2" |
|
144.0 lb |
Weight |
141.0 lb |
|
22.0 |
BMI |
21.8 |
|
(Normal) |
(Normal) |
||
|
|||
27.2% |
Body fat percentage |
34.5% |
|
Normal |
High |
||
|
Body fat percentage classification
Let’s look at an example
BODY FAT PERCENTAGE
BODY FAT PERCENTAGE
CLASSIFICATION
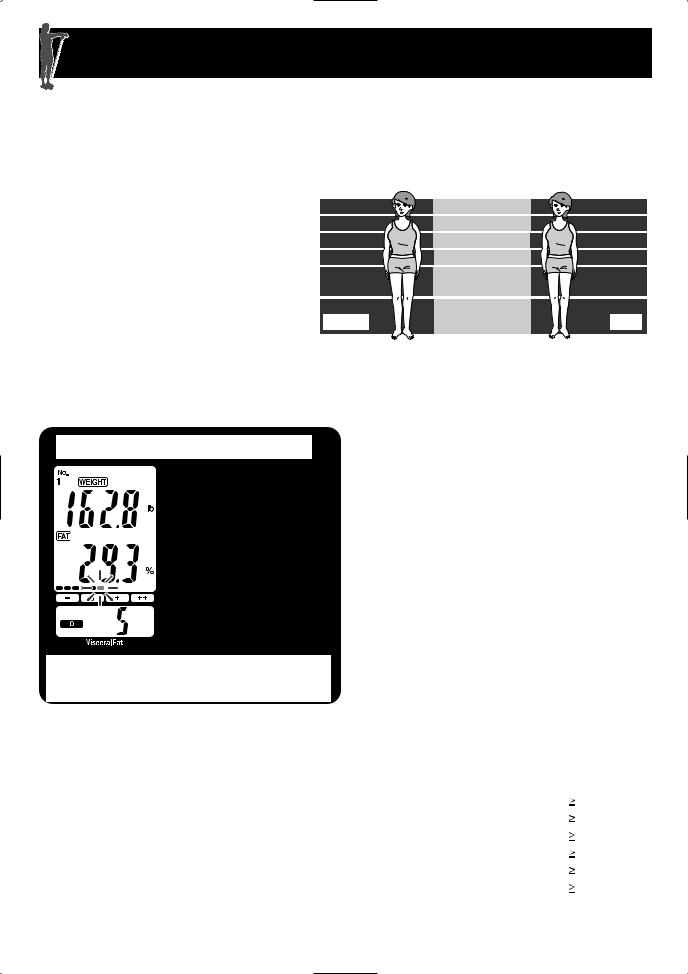
Example of display:
• Body Fat Percentage: 29.3 %
• Body Fat Percentage Classification: 0
When most people think of body fat, they have a negative image of it. However, body fat serves a vital role in storing energy, protecting internal organs, etc. While too much body fat may be unhealthy, having too little may also be unhealthy. The distribution of body fat in men and women is different, so the basis of classifying the body fat percentage for males is different than for females.
Interpreting the Body Fat Percentage Result
Gender |
Age |
Low (–) |
Normal (0) |
High (+) |
Very High (++) |
|||
|
|
|
|
|
|
|
|
|
Female |
20-39 |
< 21.0 |
21.0 |
- 32.9 |
33.0 - 38.9 |
|
|
39.0 |
|
||||||||
|
|
|
|
|
|
|
|
|
40-59 |
< 23.0 |
23.0 |
- 33.9 |
34.0 - 39.9 |
|
|
40.0 |
|
|
||||||||
|
|
|
|
|
|
|
|
|
|
60-79 |
< 24.0 |
24.0 |
- 35.9 |
36.0 - 41.9 |
|
|
42.0 |
|
|
|||||||
|
|
|
|
|
|
|
|
|
Male |
20-39 |
< 8.0 |
8.0 |
- 19.9 |
20.0 - 24.9 |
|
|
25.0 |
|
||||||||
|
|
|
|
|
|
|
|
|
40-59 |
< 11.0 |
11.0 |
- 21.9 |
22.0 - 27.9 |
|
|
28.0 |
|
|
||||||||
|
|
|
|
|
|
|
|
|
|
60-79 |
< 13.0 |
13.0 |
- 24.9 |
25.0 - 29.9 |
|
|
30.0 |
|
|
|||||||
|
|
|
|
|
|
|
|
|
Based on NIH/WHO guidelines for BMI
Based on Gallagher et al., American Journal of Clinical Nutrition, Vol. 72, Sept. 2000
7
USEFUL INFORMATION
VISCERAL FAT
Body fat is classified as subcutaneous fat or visceral fat, depending on where it is located in the body.
Visceral fat = fat surrounding the internal organs
Too much visceral fat is thought to be closely linked to increased levels of fat in the bloodstream, which can lead to common conditions such as high cholesterol, cardiovascular disease and diabetes. In order to prevent or improve conditions of these common diseases, it is important to try and reduce the visceral fat levels to an acceptable level.
Subcutaneous fat = fat below the skin
Subcutaneous fat not only accumulates around the stomach but also around the upper arms, hips and thighs, and can cause a distortion of the body’s proportions. Although not directly linked to increased risk of disease, it is thought to increase pressure on the heart and may be associated with other complications. Subcutaneous fat is not displayed separately in this unit, but is included in the body fat percentage.
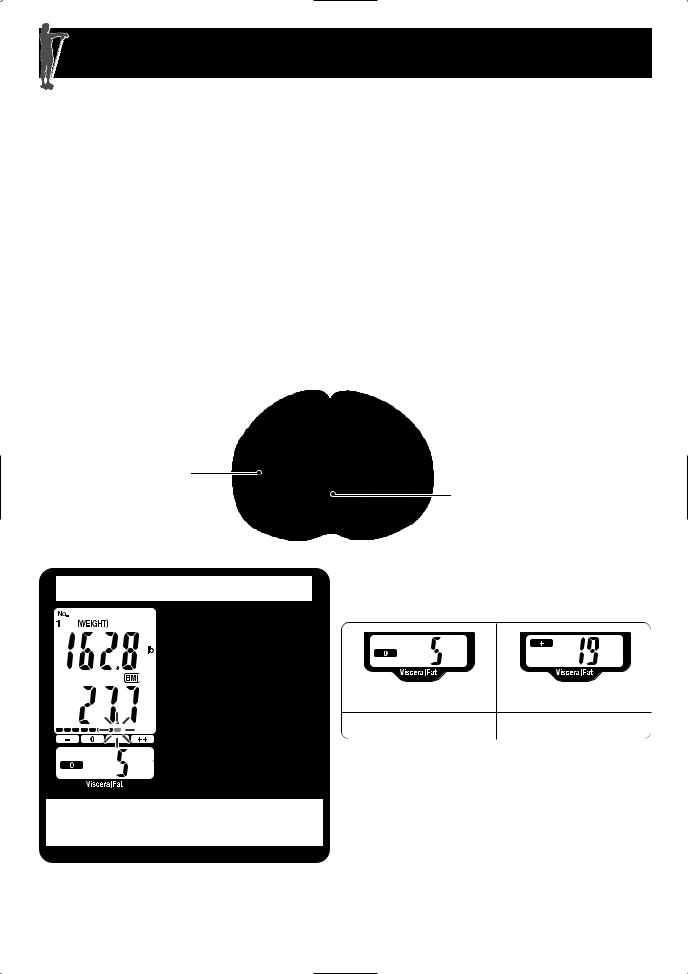
MRI Cross Section of at the Navel Level
Subcutaneous Fat 
Visceral Fat
Spine
Let’s look at an example
Interpreting the Visceral Fat Level Result
VISCERAL FAT LEVEL/ |
|
VISCERAL FAT |
|
CLASSIFICATION |
|
Example of display: |
0 |
• Visceral Fat Classification: |
|
• Visceral Fat: |
5 |
Visceral Fat Level |
9 Visceral Fat Level |
10 |
0 (Normal) |
+ (High) |
|
Visceral fat area (0 - Approx. 300 cm2, 1 inch=2.54 cm) distribution with 30 levels.
Level Classification 0: 1 - 9 level
+: 10 - 30 level
* The data referenced by Omron Healthcare.
NOTE: Visceral fat levels are relative and not absolute values.
8
USEFUL INFORMATION
RESTING METABOLISM & SKELETAL MUSCLE
Skeletal muscle is muscle that is connected to bone and used to move parts of the body.
The maintenance and increase of this skeletal muscle is closely linked to resting metabolism.
What is resting metabolism?
Regardless of your activity level, a minimum level of energy is required to sustain the body's everyday functions. Resting metabolism, the amount of calories needed to supply the body with the minimum level of energy, differs between individuals depending on variables such as age, weight, body composition, and energy expenditure.
Let’s look at an example


 RESTING METABOLISM
Example of display: |
|
• Resting Metabolism: |
1186 kcal |
SKELETAL MUSCLE
PERCENTAGE
Example of display: |
|
• Skeletal Muscle Percentage: |
28.1% |
60-70% of daily energy use is for resting metabolism
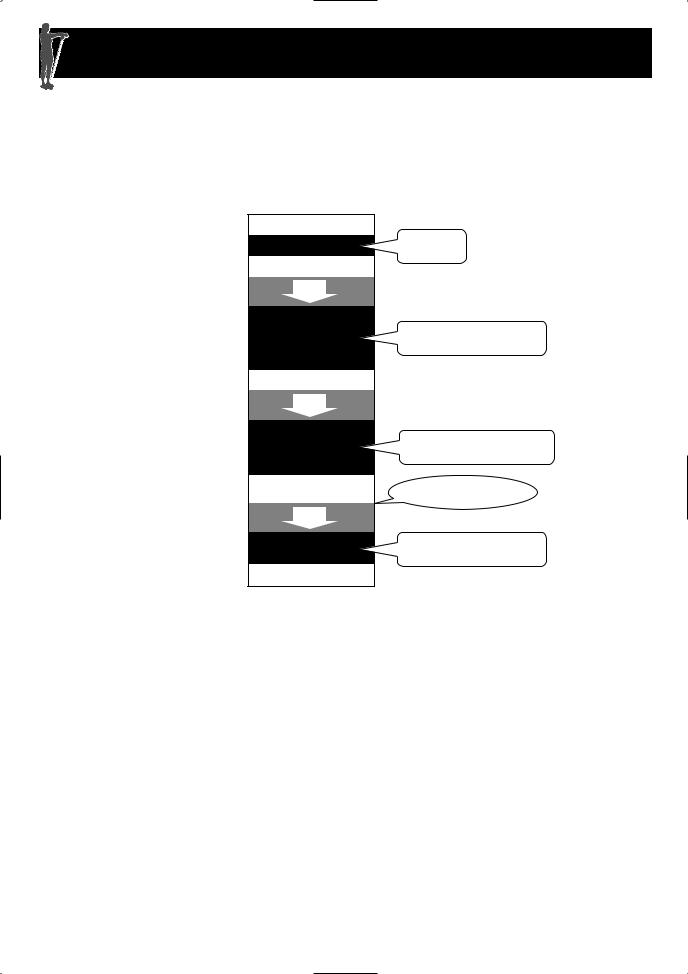
The total amount of energy burned by the body in a typical day is as follows.
Resting metabolism |
Energy required to |
|
maintain vital functions. |
||
|
||
|
Energy used for daily |
|
|
activities such as |
|
Daily activity metabolism |
commuting to work, |
|
|
household chores, |
|
|
hobbies, etc. |
|
Diet-induced |
Energy emitted after |
|
thermogenesis |
eating a meal. |
The ratio of these is 60%-70% for resting metabolism, 20%-30% for daily activity, and 10% for diet induced thermogenesis. This means that resting metabolism accounts for most of our daily energy consumption.
If our daily food intake exceeds the amount of energy required for these activities, the additional
energy is stored as fat.
Calories
Calories
|
Diet-induced thermogenesis |
|
Daily activity metabolism |
Food |
|
|
Resting metabolism |
9

USEFUL INFORMATION
What is skeletal muscle?
Muscle is divided into two types, muscle in internal organs, such as the heart, and muscle attached to bones that is used to move the body. Skeletal muscle can be increased through exercise and other activity.
Resting metabolism reduces as we get older
Resting metabolism level peaks in the late teenage years and then gradually reduces over the years. This leads to reductions in the body’s functions as we get older and in particular, it is one of the main causes for muscle reduction as we get older.
Even when not being used to move parts of the body, muscles burn energy throughout the day to generate heat for the body which is part of the resting metabolism. As the amount of muscle decreases, so does the amount of energy burned. If people continue to eat the same amount of food as when they are younger, then they develop “middle-age spread.”
In order to avoid this, it is important to know your resting metabolism and maintain muscles through exercise.
10
USEFUL INFORMATION
LONG-TERM PLANNING FOR SUCCESSFUL WEIGHT LOSS
Ignoring a balanced diet and simply reducing food intake to lose weight can lead to a decline in muscle and bone. So even though your weight goes down, your resting metabolism is reduced making the body more prone to putting on fat.
Example comparing the same loss of 20 lb:
Weight |
|
|
|
|
|
|
Months |
(lb) |
1 |
2 |
3 |
4 |
5 |
6 |
7 |
|
|||||||
170 |
|
|
|
|
|
|
|
160 |
|
|
|
|
|
|
|
A starvation diet produces rapid weight loss of 20 lb, but disrupts body mass...
 Fat reduction:
 Lean body mass reduction (muscle, bone, etc.): 14 lb
Change in body fat percentage
|
Body fat percentage |
Before diet: |
36.0% |
After diet: |
9% |
A healthy diet
with weight loss of 20 lb...
Fat reduction: 18 lb
Lean body mass reduction (muscle, bone, etc.): 2 lb
Change in body fat percentage
|
Body fat percentage |
Before diet: |
36.0% |
After diet: |
3% |
Lean body mass (muscle, bone, etc.) greatly reduced, while the body fat percentage has not changed.
Body fat percentage reduced to a normal level.
*This is an extreme case of the effect.
Repeated dieting and regaining weight leads to increased visceral fat levels
It is easy to regain weight after sudden diets. This regained weight tends to appear as visceral fat rather then subcutaneous fat. Increased visceral fat levels are thought to increase the likelihood of common diseases. Repeated dieting and subsequent regaining of weight may lead to increased visceral fat levels.
11

USEFUL INFORMATION
PRINCIPLE OF BODY COMPOSITION CALCULATION
What is the Bioelectrical Impedance Method?
The HBF-500 estimates the body fat percentage by the Bioelectrical Impedance (BI) method. Muscles, blood vessels and bones are body tissues with high water content that conduct electricity easily. Body fat is tissue that has little electric conductivity. The HBF-500 sends an extremely weak electrical current of 50 kHz and less than 500 µA through your body to determine the amount of each tissue. This weak electrical current is not felt while operating the HBF-500.
How to Calculate the Body Composition
The following methods have been the established method for accurate evaluation of body composition.
Body Fat Percentage: This is based on the DXA (Dual Energy X-Ray Absorptiometry) method, which uses two different x-rays to make a quantitative assessment of the amount of fat in the body.
Resting Metabolism: This is based on exhalation analysis, where the composition of exhaled air is analyzed. This makes it possible to calculate the resting metabolism by measuring the consumption of oxygen in exhaled air.
Visceral Fat Level: This is based on MRI (Magnetic Resonance Imaging) analysis, which uses nuclear magnetic resonance to make non-intrusive images of the body. This makes it possible to calculate the area of visceral fat at cross section of abdomen.
Skeletal Muscle Percentage: This is based on MRI (Magnetic Resonance Imaging) analysis, which uses nuclear magnetic resonance to make non-intrusive images of the body. This makes it possible to calculate the amount of skeletal muscle in the body.
Omron has developed a formula referring to the above methods. The body composition is calculated by a formula that includes five factors: electrical resistance, height, weight, age and gender.
Measures the whole body to avoid the influence of fluctuations
The ratios of the water in your upper body and lower body may change through the day. This means that the electrical impedance of the body also varies. Since the HBF-500 uses electrodes for both the hands and feet to take measurements, it can reduce the influence of water movement on measurement results.
12
USEFUL INFORMATION
RECOMMENDED MEASUREMENT TIMES
Understanding the normal changes in your body fat percentage can help you in preventing or reducing obesity. Being aware of the times when the body fat percentages shift within your own daily schedule will assist you in obtaining an accurate trending of your body fat. It is recommended to use this unit in the same environment and daily circumstances. Reference the chart below:
Daily activities
Waking up Recommended time
Breakfast
2 hours
Recommended time
Lunch
2 hours
Recommended time
Taking a bath or eating dinner
2 hours
Recommended time
Going to bed
After waking up
Before lunch and about 2 hours or more after breakfast
In the afternoon about 2 hours or more after lunch and before taking a bath or eating dinner
Avoid measurement immediately after eating or bathing.
Before going to bed and about 2 hours or more after dinner or bath
Avoid Taking Measurements Under the Following Conditions
If a measurement is taken under the following physical conditions, the calculated body composition may differ significantly from the actual one because the water content in the body is changing: Immediately after vigorous exercise, after a bath or sauna, after drinking alcohol, after drinking a large amount of water or after a meal (1 to 2 hours).
13

USEFUL INFORMATION
The reason calculated results may differ from actual body fat percentage
There are certain conditions when significant differences may occur between the estimated and the actual body fat values. These differences may be related to changing ratios of body fluid and/or body composition.
The body fat percentage measured by this monitor may significantly differ from the actual body fat percentage in the following situations:
•Elderly people
•People with a fever
•Body builders or highly trained athletes
•Persons undergoing dialysis
•Persons with osteoporosis who have very low bone density
•Pregnant women
•Post-menopausal women
•Persons with edema (Swelling in the body)
•Children in growth stage
14
Loading...