


 Loading...
User Guide - English
Fujitsu Software ServerView Suite
ServerView Event Manager
ServerView Operations Manager V6.20
Edition June 2013
Comments… Suggestions… Corrections…
The User Documentation Department would like to know your opinion of this manual. Your feedback helps us optimize our documentation to suit your individual needs.
Feel free to send us your comments by e-mail to manuals@ts.fujitsu.com.
Certified documentation according to DIN EN ISO 9001:2008
To ensure a consistently high quality standard and user-friendliness, this documentation was created to meet the regulations of a quality management system which complies with the requirements of the standard DIN EN ISO 9001:2008.
cognitas. Gesellschaft für Technik-Dokumentation mbH www.cognitas.de
Copyright and Trademarks
Copyright © 2013 Fujitsu Technology Solutions GmbH.
All rights reserved.
Delivery subject to availability; right of technical modifications reserved.
All hardware and software names used are trademarks of their respective manufacturers.

Contents
1 |
Introduction . . . . . . . . . . . . . . . . . . . . . . . . . . . . 7 |
1.1Changes from the previous version . . . . . . . . . . . . . . . 8
1.2ServerView Suite link collection . . . . . . . . . . . . . . . . . 9
1.3Documentation for ServerView Suite . . . . . . . . . . . . . 10
1.4 |
Notational conventions . . . . . . . . . . . . . . . . . . . . |
11 |
2 |
Event Manager . . . . . . . . . . . . . . . . . . . . . . . . . |
13 |
2.1First-time startup . . . . . . . . . . . . . . . . . . . . . . . . 14
2.2 |
Starting the Event Manager . . . . . . . . . . . . . . . . . . |
15 |
2.3 |
Icons . . . . . . . . . . . . . . . . . . . . . . . . . . . . . . |
16 |
3 |
Alarm Monitor . . . . . . . . . . . . . . . . . . . . . . . . . |
19 |
3.1Viewing alarms . . . . . . . . . . . . . . . . . . . . . . . . . 19
3.2 |
Viewing alarms for a server . . . . . . . . . . . . . . . . . . |
24 |
3.3 |
Filtering alarm entries . . . . . . . . . . . . . . . . . . . . . |
24 |
3.4 |
Processing alarm entries . . . . . . . . . . . . . . . . . . . |
25 |
3.4.1Acknowledging alarms . . . . . . . . . . . . . . . . . . . . . . 25
3.4.2Suppressing alarms . . . . . . . . . . . . . . . . . . . . . . . 25
3.4.3 |
Resetting alarm suppression . . . . . . . . . . . . . . . . . . |
26 |
3.4.4 |
Deleting alarms . . . . . . . . . . . . . . . . . . . . . . . . . |
26 |
3.5Testing the connection . . . . . . . . . . . . . . . . . . . . . 27
3.6 |
Other settings . . . . . . . . . . . . . . . . . . . . . . . . . |
28 |
3.6.1 |
Editing an alarm note . . . . . . . . . . . . . . . . . . . . . . |
28 |
3.7 |
iRMC S2/S3 SEL entries relayed as SC2 MIB traps . . . . . |
29 |
ServerView Event Manager

Contents
4 |
Alarm configuration . . . . . . . . . . . . . . . . . . . . . . . 37 |
4.1Alarm rules . . . . . . . . . . . . . . . . . . . . . . . . . . . . 39
4.1.1Managing alarm rules . . . . . . . . . . . . . . . . . . . . . . . 40
4.1.2Assigning servers . . . . . . . . . . . . . . . . . . . . . . . . . 43
4.1.2.1Displaying server information . . . . . . . . . . . . . . . . . 45
4.1.3 |
Assigning alarms |
. . . . . . . . . . . . . . . . . . . . . . . . . 47 |
|||||
4.1.4 |
Forwarding alarms |
|
. . . . . . . . . . . . . . . . . . . . . . . . 51 |
||||
4.2 |
Filter rules . . . |
. |
. . . . . . . . . . . . . . . . . . . . |
. |
. . |
. |
55 |
4.2.1 |
Server filters . . |
. |
. . . . . . . . . . . . . . . . . . . . |
. |
. . |
. |
55 |
4.2.2Filtering alarms . . . . . . . . . . . . . . . . . . . . . . . . . . 56
4.3 |
Making settings . . . . . |
. . . . |
. . . |
. . . . |
. . |
. . . . . . |
. 58 |
4.4 |
Mail forwarding in general |
. . . |
. . . |
. . . . |
. . |
. . . . . . |
. 59 |
4.5Mail and Execute forwarding to the service provider . . . . . 63
4.6Making pop-up settings . . . . . . . . . . . . . . . . . . . . . 67
4.7Making pager settings
(COM port and modem) . . . . . . . . . . . . . . . . . . . . . 69
4.8 |
Making execute settings . . . . . . . . . . . . . . . . . . . . 72 |
I |
. . . . . . . . . . . . . . . . . . . . . . . . . . . . . . . . . . 74 |
4.9 |
Making broadcast settings . . . . . . . . . . . . . . . . . . . 74 |
4.10Making trap settings . . . . . . . . . . . . . . . . . . . . . . . 77
4.11Macros . . . . . . . . . . . . . . . . . . . . . . . . . . . . . . 79
4.12Alarm configuration example . . . . . . . . . . . . . . . . . . 80
5 Traps . . . . . . . . . . . . . . . . . . . . . . . . . . . . . . . 83
5.1Displaying trap information . . . . . . . . . . . . . . . . . . . 83
5.2 |
Displaying traps in the Windows event log |
. . . . . . . . . . 86 |
5.3 |
Trap overview . . . . . . . . . . . . . . . |
. . . . . . . . . . . 86 |
5.3.1 |
Adaptec traps (Duralink.mib) . . . . . . . . |
. . . . . . . . . . . 92 |
5.3.2 |
APC traps (Powernet.mib) . . . . . . . . . |
. . . . . . . . . . . 92 |
5.3.3 |
Blade System traps (s31.mib) . . . . . . . |
. . . . . . . . . . . 95 |
5.3.4Cluster traps (NTCluster.mib) . . . . . . . . . . . . . . . . . . 100
5.3.5DPT traps (dptscsi.mib) . . . . . . . . . . . . . . . . . . . . . 103
5.3.6 |
DuplexDataManager traps (Ddm.mib) . . . . . . . . . . . . . 105 |
ServerView Event Manager

Contents
5.3.7DuplexWrite traps (DW.mib) . . . . . . . . . . . . . . . . . . . 109
5.3.8Hard disk (S.M.A.R.T.) traps (Hd.mib) . . . . . . . . . . . . . . 111
5.3.9 |
Generic traps . . . . . . . . . . . . . . . . . . . . . . . . . . 112 |
5.3.10MultiPath traps (mp.mib) . . . . . . . . . . . . . . . . . . . . . 113
5.3.11 |
Mylex traps (Mylex.mib) . . . . . |
. . . . . . . . . . . . . . . . 114 |
5.3.12 |
PCI HotPlug traps (pcihotplug.mib) |
. . . . . . . . . . . . . . . 118 |
5.3.13 |
PRIMEPOWER traps . . . . . . |
. . . . . . . . . . . . . . . . 119 |
5.3.14 |
PXRE traps (dec.mib) . . . . . . |
. . . . . . . . . . . . . . . . 125 |
5.3.15RAID Adapter traps (Megaraid.mib) . . . . . . . . . . . . . . . 129
5.3.16RomPilot traps (Rompilot.mib) . . . . . . . . . . . . . . . . . . 132
5.3.17 |
ServerControl traps (SC.mib) . . . |
. . . . . . . . . . . . . . . 133 |
5.3.18 |
ServerControl traps (SC2.mib) . . |
. . . . . . . . . . . . . . . 139 |
5.3.19 |
ServerView traps (ServerView.mib) |
. . . . . . . . . . . . . . . 145 |
5.3.20 |
ServerView status traps (Status.mib) |
. . . . . . . . . . . . . . 146 |
5.3.21Tape drive traps (tapealrt.mib) . . . . . . . . . . . . . . . . . . 147
5.3.22 |
Team Server traps (Fujitsu) . . . . . . . . . . . . . . . . . . . 160 |
5.3.23Threshold traps (Trap.mib) . . . . . . . . . . . . . . . . . . . . 163
5.3.24 |
UPS traps (Upsman.mib) |
. . . . . . . . . . . . . . . . . . |
. |
. 168 |
6 |
MIB integration . . . . |
. . . . . . . . . . . . . . . . . . . |
. |
. 171 |
ServerView Event Manager

Contents
ServerView Event Manager

1 Introduction
The ServerView Event Manager (called simply Event Manager below) is a component of the Event Management of the ServerView Suite. After installation, this component is available both via the Windows Start Menu and via ServerView Operations Manager (called simply Operations Manager below).
The Event Manager function has a user-friendly Web-based graphical user interface (GUI) where you can obtain reliable, secure information about system faults quickly.
You can define the results and operating states about which you want to receive alarm messages. The availability of a server in a network is a critical factor and it therefore makes sense to configure the Event Manager so that you are informed about all the operating states that could endanger server availability.
On blade systems, the Event Manager can receive and display alarm messages from the blade system itself and also from individual server blades. Alarms are assigned to the entire blade system by default. This setting can be changed in the configuration.
The Event Manager works like this. An agent sends an alarm (trap) over the SNMP to the Event Manager informing the management station that an unexpected event has occurred. An unexpected event can be an error report or a status change caused by tripping of a threshold value.
Traps are assigned the severity levels: critical, major, minor and informational. Different actions, triggered by traps, can be assigned to each severity level and to each server. Events at the alarm severity level critical are always recorded in the alarm log of the log file.
IWhen you are installing the agents you can also specify that alarm messages are to be sent to the Windows event log.
ServerView Event Manager |
7 |

Changes from the previous version
1.1Changes from the previous version
This edition is valid for the Event Manager of ServerView V6.20 and replaces the online manual: “Event Manager“ as of ServerView V6.12 Edition February 2013.
The manual has been updated to reflect the latest software status and includes the following additions:.
–The Edit Automatic Service Mail Configuration window now also includes the Exec Settings tab.
–The MAPI is no longer supported.
8 |
ServerView Event Manager |

ServerView Suite link collection
1.2ServerView Suite link collection
Via the link collection, Fujitsu Technology Solutions provides you with numerous downloads and further information on the ServerView Suite and PRIMERGY servers.
For ServerView Suite, links are offered on the following topics:
●Forum
●Service Desk
●Manuals
●Product information
●Security information
●Software downloads
●Training
IThe downloads include the following:
–Current software versions for the ServerView Suite as well as additional Readme files.
–Information files and update sets for system software components (BIOS, firmware, drivers, ServerView agents and ServerView update agents) for updating the PRIMERGY servers via ServerView Update Manager or for locally updating individual servers via ServerView Update Manager Express.
–The current versions of all documentation on the ServerView Suite.
You can retrieve the downloads free of charge from the Fujitsu Technology Solutions Web server.
For PRIMERGY servers, links are offered on the following topics:
●Service Desk
●Manuals
●Product information
●Spare parts catalogue
ServerView Event Manager |
9 |

Documentation for ServerView Suite
Access to the link collection
You can reach the link collection of the ServerView Suite in various ways:
1.Via ServerView Operations Manager.
Ê Select Help – Links on the start page or on the menu bar. This opens the start page of the ServerView link collection.
2.Via the start page of the online documentation for the ServerView Suite on the Fujitsu Technology Solutions manual server.
IYou access the start page of the online documentation via the following link:
http://manuals.ts.fujitsu.com
ÊIn the selection list on the left, select Industry standard servers.
ÊClick the menu item PRIMERGY ServerView Links.
This opens the start page of the ServerView link collection.
3.Via the ServerView Suite DVD.
ÊIn the start window of the ServerView Suite DVD, select the option Select ServerView Software Products.
ÊClick Start. This takes you to the page with the software products of the ServerView Suite.
ÊOn the menu bar select Links.
This opens the start page of the ServerView link collection.
1.3Documentation for ServerView Suite
The documentation can be downloaded free of charge from the Internet. You will find the online documentation at http://manuals.ts.fujitsu.com under the link
Industry standard servers.
For an overview of the documentation to be found under ServerView Suite as well as the filing structure, see the ServerView Suite sitemap (ServerViewSuite – Site Overview).
10 |
ServerView Event Manager |
Notational conventions
1.4Notational conventions
The following notational conventions are used in this manual:
VCaution This symbol points out hazards that can lead to personal injury, loss of data or damage to equipment.
IThis symbol highlights important information and tips.
Ê |
This symbol refers to a step that you must carry out in |
|
order to continue with the procedure. |
|
|
italic |
Commands, menu items, names of buttons, options, |
|
variables, file names and path names are shown in italics |
|
in descriptive text. |
|
|
fixed font |
System outputs are indicated using a fixed font. |
|
|
semi-bold |
Commands to be entered via the keyboard are written in a |
fixed font |
semi-bold fixed font. |
|
|
[Key symbols] |
Keys are shown according to their representation on the |
|
keyboard. If uppercase letters are to be entered explicitly, |
|
then the Shift key is shown, e.g. [SHIFT] - [A] for A. |
|
If two keys need to be pressed at the same time, this is |
|
shown by placing a hyphen between the two key symbols. |
|
|
Table 1: Notational conventions
References to text or sections of text in this manual are shown with the chapter or section heading and the page on which that chapter or section begins.
Screen outputs
Please note that the screen output is dependent in part on the system used and therefore some details may not correspond exactly to the output you will see on your system. You may also see system-dependent differences in the menu items available.
ServerView Event Manager |
11 |

Notational conventions
12 |
ServerView Event Manager |

2 Event Manager
The Event Manager allows you to filter and forward alarm messages and specify the display.
For monitoring, ServerView agents must be installed on the managed servers and for servers with VMware vSphere ESXi 5 ServerView ESXi 5 CIM Provider must be installed. If an unusual operating status occurs, the ServerView agents automatically send an alarm (trap) to a management station. Which management stations are to receive traps is defined during installation of the ServerView agents or ServerView ESXi 5 CIM Provider. While setting up the SNMP service on the management station, you define the managed servers from which traps are to be received.
After installing the ServerView Operations Manager you must first configure the alarm display and alarm handling. You do this by defining alarm rules and filter rules in the Alarm Configuration component. Using alarm rules, you specify which alarms are to be forwarded from which servers to which destinations. You can also specify, via filter rules, which alarms from which servers are to be filtered out. For a detailed description of this alarm configuration see the chapter "Alarm configuration" on page 37.
The Alarm Monitor component displays the received alarms, depending on the configuration set. The Alarm Monitor offers you further functions for editing the alarm list as well as for additional filtering of the alarm display. You can, for example, specify which alarms from which servers are not to be shown in the alarm list. For a detailed description of the Alarm Monitor see the chapter "Alarm Monitor" on page 19.
ServerView comes with a series of MIBs, which are integrated in the Event Manager. Traps from these MIBs can be received and processed in the Event Manager. To supplement the existing MIBs, additional third-party MIBs can be integrated into the Event Manager. Traps from these MIBs are also displayed in the Event Manager, once the MIB has been checked.
You integrate the MIBs using the MIB Manager, which is additionally provided when the Event Manager is installed under Windows or Linux. For more information on this tool, see the chapter "MIB integration" on page 171.
ServerView Event Manager |
13 |

First-time startup
CIM-Indications for VMware vSphere ESXi 5
Events of servers with VMware vSphere ESXi 5 are provided as CIM indications. The CIM indications are analyzed by the ServerView Event Manager, which can manage and forward them as usual.
Via Test Connectivity you can test the connection to the VMware vSphere ESXi 5 server (see User Guide „ServerView Operations Manager“ manual).
IThe CIM indication provider is provided for the following operating system:
– VMware vSphere ESXi 5
For more information on ServerView ESXi CIM provider, see the "Monitoring VMware based PRIMERGY servers with ServerView" manual.
2.1First-time startup
The ServerView Base Configuration Wizard includes a step for configuring the Event Manager (see the Base Configuration Wizard User Guide).
14 |
ServerView Event Manager |

Starting the Event Manager
2.2Starting the Event Manager
You start the Event Manager either via the ServerView Operations Manager start screen or via the ServerList main window.
1.Start ServerView Operations Manager.
How to do this is described in the documentation for ServerView Operations Manager.
2.Click the menu item Event Manager either in the ServerView Operations Manager start screen or in the ServerList main window.
3.Start the individual components of the Event Manager (Alarm Monitor and Alarm Configuration) by clicking the corresponding link (Alarm Monitor or
Alarm Configuration).
ITo start / operate the Event Manager, you need the appropriate permissions. As the RBAC (Role-based access control) based user management of the ServerView Suite controls the assignment of permissions to users by means of user roles, please ensure that your user role is equipped with the required privileges. For details see the "User Management in ServerView" user guide.
ServerView Event Manager |
15 |
Icons
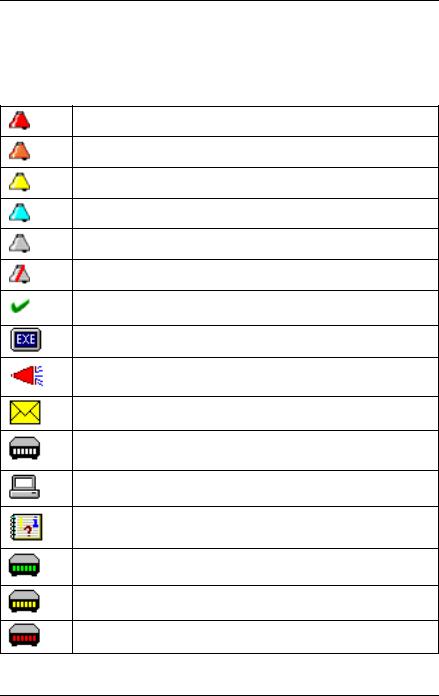
2.3Icons
You will find a list of the icons in the Alarm Monitor and Alarm Configuration windows and their meanings in the following.
Red alarm: critical
Orange alarm: major
Yellow alarm: minor
Blue alarm: informational
Gray alarm: unknown
Alarm is ignored
The alarm was confirmed by a user entry.
Some other executable program was triggered by this alarm.
A broadcast message was sent for this alarm.
A mail was sent for this alarm.
This alarm triggered a pager call.
This alarm will be passed on to a management station.
This alarm will be passed on to the local system event log.
Green: Pager confirmed
Yellow: Pager completed
Red: Pager present (still active)
Table 2: Icons in the Alarm Monitor and Alarm Configuration
16 |
ServerView Event Manager |

Icons
Yellow: Forwarding completed
Red: Forwarding present (still active)
Table columns can be filtered according to different criteria.
Table 2: Icons in the Alarm Monitor and Alarm Configuration
ServerView Event Manager |
17 |

Icons
18 |
ServerView Event Manager |

3 Alarm Monitor
The Alarm Monitor component displays all received alarms relating to the selected servers and server groups in the Operations Manager main window.
3.1Viewing alarms
You start the Alarm Monitor via the Operations Manager start window by clicking the Alarm Monitor link under Event Management (see section "Starting the Event Manager" on page 15). How to start Operations Manager is described in the ServerView Operations Manager documentation.
Figure 1: Alarm Monitor
ServerView Event Manager |
19 |

Viewing alarms
The window is divided into four sections:
●The menu bar below the title bar allows you to navigate between the Operations Manager functions:
–Serverlist
–Administration
–Asset Management
–Event Management
–Monitoring
–Update Management
–Security (only if OpenDS is used as directory service)
In the line below the menu bar, the individual menu items are listed, depending on which menu is selected.
For more information on the menus in the menu bar, see the ServerView Operations Manager User Guide.
IThe menus excepting the Event Management menu are only available if Operations Manager is also installed on the management station.
●The left section shows a file tree structure containing the servers and server groups. This is where you make your selection for the display in the alarm or server list.
IIf you move the mouse pointer over a server in the file tree, a tooltip appears. The content of the tooltip depends on the length of the server name. If the server name is truncated in the file tree, the tooltip shows first the complete server name and below it the server type. If the server name is not truncated, the tooltip only shows the server type.
●The top right section of the window contains the alarm entries for the servers selected in the file tree. The alarm list is structured in pages.
The icons in the header of the right-hand section indicate how many alarm entries per severity level there are on a page of the alarm list.
You can use these icons to control the alarm list display. Click to select the alarm levels for which you want to display alarm messages.
The display update in the Alarm Manager can be enabled or disabled via automatic refresh. If automatic refresh is selected, the display is reloaded automatically when an alarm is logged. Otherwise, only the display of logged alarms for Total number of alarms changes.
20 |
ServerView Event Manager |
Viewing alarms
Below the status bar the alarm entries are displayed with the following information:
Receive Time
Time when the alarm was received.
Alarm Type
Brief description of the alarm.
Alarm icon (see table below)
Indicates the severity of the alarm.
Server
Server name. If you click the server name, the ServerView [servername] window opens, in which you can request detailed information about the selected server. For more information see the ServerView Operations Manager manual.
IThe ServerView [servername] window only opens if Operations Manager is also installed on the management station.
Forwarding icons (see table below)
Indicates the type of alarm forwarding.
Ack
Indicates whether the alarm was acknowledged.
Note
Indicates a note entered by the user.
ServerView Event Manager |
21 |
Viewing alarms
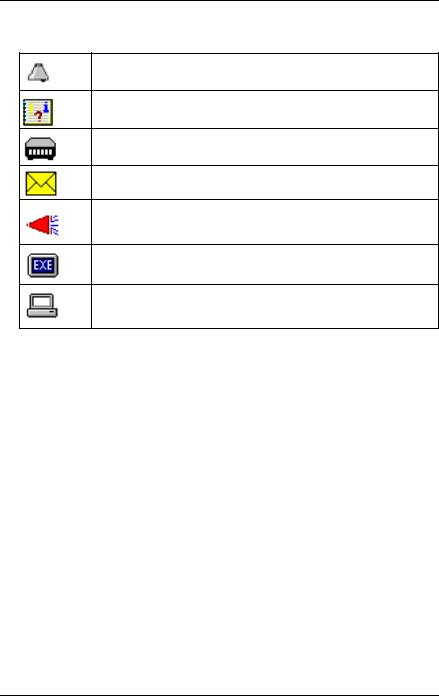
The icons have the following meanings:
Indicates the alarm level.
The alarm was written to the local event log.
This alarm triggered a pager call.
A mail was sent for this alarm.
A broadcast message was sent for this alarm.
An executable program was triggered by this alarm.
This alarm was forwarded to the management station.
Table 3: Icons in the Alarm Monitor
●In the bottom right section of the window you can find out information on the selected alarm entry in the alarm list via the two or three tabs provided:
–Alarm Details tab - contains a brief description of the selected alarm entry in the alarm list.
–Alarm Information tab - contains detailed information on the selected alarm entry as stored in the MIB.
–Server Information tab - provides information on the server from which the selected alarm entry originates. Under General Information you will see general information about the server (e.g. system name, IP address, community name) and under Additional Information you will see additional information as stored in the Server Properties (e.g. administrator, location, model).
On this tab you will also find a link, depending on whether the server in question is entered in the ServerView server list or not.
22 |
ServerView Event Manager |

Viewing alarms
If the server is in the server list, you can use the Edit Server Settings link to open the Server Properties window for this server, via which you can change the configured values for the server.
If the server is not in the ServerView server list, you can use the Add Server link to start the Server Browser and add the server to the list. For more information on the Server Properties and the Server Browser, see the ServerView Operations Manager User Guide.
IThe Server Information tab is only available if both the event manager and the Operations Manager are installed on the management station.
ServerView Event Manager |
23 |

Viewing alarms for a server
3.2Viewing alarms for a server
If several alarm messages have been received for a server, the one with the highest severity level is displayed in the server list. In the bottom display area you will only see information on the last alarm message received with this severity.
To get an overview of all alarm messages for this server, you can switch to the Alarm Monitor function for this server only.
One way of doing this is to select the server in the file tree and start the Alarm Monitor function via the menu bar in the Operations Manager main window.
A much quicker way is via the alarm icon (the alarm bell) in the server list. If you click the alarm icon, you switch to the Alarm Monitor function for this server only. This means that only the alarm messages for this particular server will be visible in the list section of the Operations Manager main window. Through appropriate selection of an alarm message in the alarm list, you can retrieve further information on every alarm message received in the display area.
3.3Filtering alarm entries
You can filter the alarm entries by clicking the corresponding filter icons in the header of the alarm list.
Filter icon in the header of the alarm list.
When you click the filter icon, the associated dialog Filtering for Column <column_name> opens in each case. Make your selection and confirm it with OK. Then, only the filtered entries will be displayed, depending on what you have selected. In the standard filter (Standard), all selection elements are selected via checkboxes. In the customized filter (Customize), you either enter your selection directly or using an asterisk as a placeholder. An active filter is indicated by a blue filter icon.
24 |
ServerView Event Manager |

Processing alarm entries
3.4Processing alarm entries
The following functions are available for processing the alarm entries:
–Acknowledge alarms
–Suppress alarms
–Reset alarm suppression
–Delete alarms
3.4.1Acknowledging alarms
You can acknowledge alarms that have been received.
Proceed as follows:
ÊSelect the alarm entries in the list.
ÊSelect Ack Alarm from the context menu.
The acknowledgment is indicated in the Ack column with the following icon:
3.4.2Suppressing alarms
You can suppress individual alarms of a server. This is useful if the management station is being bombarded with messages from a server that is not running correctly.
Proceed as follows:
ÊSelect the alarm entries in the list.
ÊSelect Suppress from the context menu.
You must confirm the alarm suppression. Once you have done this, all alarm entries will be deleted from the alarm list and no further alarms of this type for the server in question will be added to the list.
You can reset this setting via Filter Settings, see section "Resetting alarm suppression" on page 26.
ServerView Event Manager |
25 |

Processing alarm entries
IWhen the server starts up, a RAID manager or Ethernet card, etc. may issue an alarm (SNMP trap) as a startup notification (e.g. RFC1157LinkUP). To suppress this kind of alarm, you can configure alarm suppression. This function must be specified for each server. If multiple servers are monitored, configure this setting for each server using the alarm function.
3.4.3Resetting alarm suppression
You can reset an alarm suppression that has already been set. Proceed as follows:
Ê Select Filter Settings from the context menu.
The Reset suppressings window opens, in which all previously set alarm suppressions are listed. To reset a suppression, proceed as follows:
ÊSelect the relevant suppression in the list.
ÊClick the Delete button.
ÊTo close the window, click the Close button.
The entry is removed from the list and the alarm setting is active again.
3.4.4Deleting alarms
To delete alarm entries, proceed as follows:
ÊSelect the alarm entries in the list.
ÊSelect Delete from the context menu.
IAlarms with the severity critical cannot be deleted until they have been acknowledged.
26 |
ServerView Event Manager |

Testing the connection
3.5Testing the connection
To test the connection to a specific server, you can send a trap. Proceed as follows:
ÊSelect Test Trap from the context menu. The Test Trap window opens:
ÊEither select the server from the list under Serverlist, or
ÊEnter the IP address of the server. If you wish you can specify the server name.
ÊEither accept the default values for Community and Timeout or enter the relevant values in these fields.
ÊTo test the connection, click the Test trap button.
A window informs you of the connection status. To close this window, click the Close button.
INote for Linux
If you perform a connection test for the local host (127.0.0.1/localhost), the test trap times out. This is because the system is waiting for a response from the IP address of the local host to which ServerView Operations Manager made the request, whereas the actual response received by the trap comes from the real IP address of the server specified in the SNMP master agent.
ServerView Event Manager |
27 |

Other settings
3.6Other settings
3.6.1Editing an alarm note
You can edit the note displayed for an alarm entry:
ÊClick the relevant alarm entry.
ÊSelect Edit Note from the context menu. The Edit Note window opens:
ÊEnter your text.
ÊConfirm your input with OK.
28 |
ServerView Event Manager |

iRMC S2/S3 SEL Entries and SC2 MIB Traps
3.7iRMC S2/S3 SEL entries relayed as SC2 MIB traps
IThe following table applies to PRIMERGY systems manufactured in 2009 or later.
If the iRMC S2/S3 writes an event to the System Event Log (SEL), in some cases an SNMP trap is triggered. The following table shows the correlation between the iRMC S2/S3 entries in the SEL and the traps they trigger.
INot all iRMC S2/S3 entries made in the SEL trigger an SNMP trap. Some trigger the same trap.
Error |
iRMC S2/S3 SEL |
Trap text |
Trap |
Trap name |
code |
entry |
|
no. |
|
|
|
|
|
|
000011 |
System event log |
The System Event |
2101 |
sc2TrapMessa |
|
(SEL) warning |
Log for cabinet XY at |
|
geLogWarning |
|
threshold exceeded |
server XY has |
|
|
|
|
exceeded XY |
|
|
|
|
percent of its |
|
|
|
|
capacity. |
|
|
|
|
|
|
|
040000 |
’FAN XY’: Fan failed |
Fan ’FAN XY’ failed |
2014 |
sc2TrapFan |
|
|
in cabinet XY of |
|
Failed |
|
|
server XY. |
|
|
|
|
|
|
|
040001 |
’FAN XY’: Fan is |
Fan ’FAN XY’ was |
2010 |
sc2TrapFan |
|
working |
added into cabinet |
|
Added |
|
|
XY of server XY. |
|
|
|
|
|
|
|
|
|
Fan ’FAN XY’ in |
2012 |
sc2TrapFanOk |
|
|
cabinet XY of server |
|
|
|
|
XY is working again. |
|
|
|
|
|
|
|
040002 |
’FAN XY’: Fan |
Fan ’FAN XY’ will fail |
2013 |
sc2TrapFan |
|
prefailure |
in near future in |
|
Critical |
|
|
cabinet XY of server |
|
|
|
|
XY. |
|
|
|
|
|
|
|
Table 4: iRMC S2/S3 SEL entry - SC2 MIB trap
ServerView Event Manager |
29 |

iRMC S2/S3 SEL Entries and SC2 MIB Traps
Error |
iRMC S2/S3 SEL |
Trap text |
Trap |
Trap name |
code |
entry |
|
no. |
|
|
|
|
|
|
040003 |
’FAN XY’: Redundant |
The redundant fan |
2015 |
sc2Trap |
|
fan failed |
’FAN XY’ failed in |
|
RedundantFan |
|
|
cabinet XY of server |
|
Failed |
|
|
XY. System can |
|
|
|
|
become critical if |
|
|
|
|
another fan in this |
|
|
|
|
group fails. |
|
|
|
|
|
|
|
040004 |
’FAN XY’: Fan |
Fan ’FAN XY’ was |
2011 |
sc2TrapFan |
|
removed |
removed from |
|
Removed |
|
|
cabinet XY of server |
|
|
|
|
XY. |
|
|
|
|
|
|
|
050001 |
’Temp XY’: |
Temperature at |
2020 |
sc2TrapTemp |
|
Temperature OK |
sensor ’Temp XY’ in |
|
Ok |
|
|
cabinet XY of server |
|
|
|
|
XY is within normal |
|
|
|
|
range. |
|
|
|
|
|
|
|
050016 |
’Temp XY’: |
Temperature at |
2021 |
sc2TrapTemp |
|
Temperature warning |
sensor ’Temp XY’ in |
|
Warning |
|
|
cabinet XY of server |
|
|
|
|
XY has reached the |
|
|
|
|
warning level. |
|
|
|
|
|
|
|
050017 |
’Temp XY’: |
Temperature at |
2022 |
sc2TrapTemp |
|
Temperature critical |
sensor ’Temp XY’ in |
|
Critical |
|
|
cabinet XY of server |
|
|
|
|
XY has reached the |
|
|
|
|
critical level. |
|
|
|
|
|
|
|
070000 |
’PSU XY’: Power |
Power supply ’PSU |
2031 |
sc2TrapPower |
|
supply removed |
XY’ in cabinet XY at |
|
Supply |
|
|
server XY was |
|
Removed |
|
|
removed. |
|
|
|
|
|
|
|
Table 4: iRMC S2/S3 SEL entry - SC2 MIB trap
30 |
ServerView Event Manager |
Loading...