


NH SeriesTM
NHTC / NHPC
ELECTRODE STEAM HUMIDIFIER
Engineering Manual
2538144-B

PROPRIETARY NOTICE
This document and the information disclosed herein are proprietary data of WALTER MEIER LTD. Neither this document nor the information contained herein shall be reproduced used, or disclosed to others without the written authorization of WALTER MEIER LTD., except to the extent required for installation or maintenance of recipient’s equipment. All references to the NORTEC name should be taken as referring to WALTER MEIER LTD.
LIABILITY NOTICE
NORTEC does not accept any liability for installations of humidity equipment installed by unqualified personnel or the use of parts/components/equipment that are not authorized or approved by NORTEC.
COPYRIGHT NOTICE
Copyright 2008, WALTER MEIER LTD. All rights reserved.
SPECIFICATION LABEL LOCATION
The Specification Label for your NH Series humidifier is located on the bottom of the unit. You will find it attached to the skirt that separates the electrical and plumbing compartments on the electrical compartment side.
RECORD OF REVISIONS
For each revision, put the revised pages in your manual and discard the superseded pages. Write the revision number and revision date, date put in manual, and the incorporator’s initials in the applicable columns on the Record of Revisions.
Revision |
Revision |
Date Put |
|
|
Revision |
Revision |
Date Put |
|
Number |
Date |
In Manual |
By |
|
Number |
Date |
In Manual |
By |
|
|
|
|
|
|
|
|
|
|
|
|
|
|
|
|
|
|
|
|
|
|
|
|
|
|
|
|
|
|
|
|
|
|
|
|
|
|
|
|
|
|
|
|
|
|
|
|
|
|
|
|
|
|
2008-10-01

TABLE OF CONTENTS
Subject |
Page |
10-00 ELECTRODE STEAM ENGINEERING
1. INTRODUCTION WHY ELECTRODE STEAM. . . . . . . . . . . . . . . . . . . . . . . . . . . . . . . . . 3
A.PROPORTIONAL + INTEGRAL AUTO-ADAPTIVE CONTROL SYSTEM FOR
THE NHTC/NHPC . . . . . . . . . . . . . . . . . . . . . . . . . . . . . . . . . . . . . . . . . . . . . . . . . . . 3 B. NH CAPACITY ADJUSTMENT . . . . . . . . . . . . . . . . . . . . . . . . . . . . . . . . . . . . . . . . . 6 C. DRAIN CYCLE AND CYLINDER LIFE . . . . . . . . . . . . . . . . . . . . . . . . . . . . . . . . . . . . 6
2. PRE-INSTALLATION EQUIPMENT VERIFICATION . . . . . . . . . . . . . . . . . . . . . . . . . . . . 9 A. GENERAL . . . . . . . . . . . . . . . . . . . . . . . . . . . . . . . . . . . . . . . . . . . . . . . . . . . . . . . . . . 9
10-10 HUMIDITY, STEAM ABSORPTION AND DISTRIBUTION
1. HUMIDITY . . . . . . . . . . . . . . . . . . . . . . . . . . . . . . . . . . . . . . . . . . . . . . . . . . . . . . . . . . 13 A. ESTIMATING THE HUMIDIFICATION LOAD . . . . . . . . . . . . . . . . . . . . . . . . . . . . 13 B. LOAD CALCULATION SUMMARY . . . . . . . . . . . . . . . . . . . . . . . . . . . . . . . . . . . . 13 C. TEMPERATURE AND HUMIDITY REQUIRED . . . . . . . . . . . . . . . . . . . . . . . . . . . 13 D. TEMPERATURE AND HUMIDITY AVAILABLE . . . . . . . . . . . . . . . . . . . . . . . . . . . 13 E. INCOMING AIR VOLUME . . . . . . . . . . . . . . . . . . . . . . . . . . . . . . . . . . . . . . . . . . . 15
2. STEAM ABSORPTION AND DISTRIBUTION . . . . . . . . . . . . . . . . . . . . . . . . . . . . . . . . 28 A. VARIABLES THAT AFFECT ABSORPTION DISTANCES. . . . . . . . . . . . . . . . . . . . 28 B. CALCULATING THE DOWN STREAM HUMIDITY LEVEL . . . . . . . . . . . . . . . . . . . 30 C. CONTROL OF DUCT OR PLENUM SATURATION . . . . . . . . . . . . . . . . . . . . . . . . . 31
3. STEAM RUNS AND CONDESNATE RETURNS . . . . . . . . . . . . . . . . . . . . . . . . . . . . . . 32 A. STEAM RUNS. . . . . . . . . . . . . . . . . . . . . . . . . . . . . . . . . . . . . . . . . . . . . . . . . . . . . . 32 B. CONDENSATE RETURN . . . . . . . . . . . . . . . . . . . . . . . . . . . . . . . . . . . . . . . . . . . . . 34
4. STEAM DISTRIBUTORS (ASD, BSD, CSD) . . . . . . . . . . . . . . . . . . . . . . . . . . . . . . . . . 37 A. STEAM DISTRIBUTORS . . . . . . . . . . . . . . . . . . . . . . . . . . . . . . . . . . . . . . . . . . . . . 37 B. DISTRIBUTOR CHARACTERISTICS . . . . . . . . . . . . . . . . . . . . . . . . . . . . . . . . . . . 37 C. DISTRIBUTOR LOCATIONS AND MOUNTING . . . . . . . . . . . . . . . . . . . . . . . . . . . 38 D. MULTIPLE DISTRIBUTOR APPLICATIONS . . . . . . . . . . . . . . . . . . . . . . . . . . . . . . 38 E. LOCATION OF STEAM DISTRIBUTORS WITHIN AN AIR HANDLER . . . . . . . . . . 40 F. DISTRIBUTOR ABSORPTION DISTANCE . . . . . . . . . . . . . . . . . . . . . . . . . . . . . . . 40 G. TYPICAL APPLICATIONS . . . . . . . . . . . . . . . . . . . . . . . . . . . . . . . . . . . . . . . . . . . . 41 H. DISTRIBUTOR DIMENSIONS . . . . . . . . . . . . . . . . . . . . . . . . . . . . . . . . . . . . . . . . . 41
5. SHORT ABSORPTION MANIFOLD (SAM-e) . . . . . . . . . . . . . . . . . . . . . . . . . . . . . . . . 42 A. GENERAL . . . . . . . . . . . . . . . . . . . . . . . . . . . . . . . . . . . . . . . . . . . . . . . . . . . . . . . . 42 B. DETERMINING THE STEAM ABSORPTION DISTANCE . . . . . . . . . . . . . . . . . . . . 43 C. STATIC AIR PRESSURE . . . . . . . . . . . . . . . . . . . . . . . . . . . . . . . . . . . . . . . . . . . . . 44 D. CONDENSATE LOSSES . . . . . . . . . . . . . . . . . . . . . . . . . . . . . . . . . . . . . . . . . . . . . 44 E. CORRECT CHOICE OF PRODUCT APPLICATIONS (WITHIN SAM-e) . . . . . . . . 46 F. SAM-e DIMENSIONS . . . . . . . . . . . . . . . . . . . . . . . . . . . . . . . . . . . . . . . . . . . . . . . . 46 G. SAM-e HEADER SELECTION . . . . . . . . . . . . . . . . . . . . . . . . . . . . . . . . . . . . . . . . . 46 H. SAM-e STEAM TUBE SELECTION . . . . . . . . . . . . . . . . . . . . . . . . . . . . . . . . . . . . . 46 I. SAM-e STEAM INLET CONFIGURATION SELECTION . . . . . . . . . . . . . . . . . . . . . 48 J. MINI SAM-e . . . . . . . . . . . . . . . . . . . . . . . . . . . . . . . . . . . . . . . . . . . . . . . . . . . . . . . 48
6. BLOWER PACKS (BOBP, RMBP) . . . . . . . . . . . . . . . . . . . . . . . . . . . . . . . . . . . . . . . . . 51 A. BLOWER PACKS . . . . . . . . . . . . . . . . . . . . . . . . . . . . . . . . . . . . . . . . . . . . . . . . . . . 51
2008-10-01

Subject |
Page |
7. CONTROLS . . . . . . . . . . . . . . . . . . . . . . . . . . . . . . . . . . . . . . . . . . . . . . . . . . . . . . . . . . 53 A. GENERAL . . . . . . . . . . . . . . . . . . . . . . . . . . . . . . . . . . . . . . . . . . . . . . . . . . . . . . . . 53 B. ON/OFF CONTROLS . . . . . . . . . . . . . . . . . . . . . . . . . . . . . . . . . . . . . . . . . . . . . . . . 53 C. MODULATING CONTROLS . . . . . . . . . . . . . . . . . . . . . . . . . . . . . . . . . . . . . . . . . . 53 D. OUTDOOR TEMPERATURE SETBACK . . . . . . . . . . . . . . . . . . . . . . . . . . . . . . . . . 54 E. TRANSDUCER SENSORS . . . . . . . . . . . . . . . . . . . . . . . . . . . . . . . . . . . . . . . . . . . 54 F. POSITIONING CONTROLS AND SENSORS . . . . . . . . . . . . . . . . . . . . . . . . . . . . . 55 G. NORTEC ONLINE . . . . . . . . . . . . . . . . . . . . . . . . . . . . . . . . . . . . . . . . . . . . . . . . . . 55 H. NORTEC LINKS . . . . . . . . . . . . . . . . . . . . . . . . . . . . . . . . . . . . . . . . . . . . . . . . . . . . 57 I. TYPICAL INSTALLATION LAYOUT FOR NHTC/NHPC . . . . . . . . . . . . . . . . . . . . . 58 J. NORTEC CONTROLLER DIMENSIONS . . . . . . . . . . . . . . . . . . . . . . . . . . . . . . . . . 58
10-20 SPECIFICATIONS
1. HUMIDIFIERS . . . . . . . . . . . . . . . . . . . . . . . . . . . . . . . . . . . . . . . . . . . . . . . . . . . . . . . 64 A. GENERAL . . . . . . . . . . . . . . . . . . . . . . . . . . . . . . . . . . . . . . . . . . . . . . . . . . . . . . . 64 B. PRODUCTS . . . . . . . . . . . . . . . . . . . . . . . . . . . . . . . . . . . . . . . . . . . . . . . . . . . . . . 64 C. EXECUTION . . . . . . . . . . . . . . . . . . . . . . . . . . . . . . . . . . . . . . . . . . . . . . . . . . . . . 70
10-30 SUBMITTALS
1. SUBMITTAL DESCRIPTIONS . . . . . . . . . . . . . . . . . . . . . . . . . . . . . . . . . . . . . . . . . . . . 74 A. INTRODUCTION . . . . . . . . . . . . . . . . . . . . . . . . . . . . . . . . . . . . . . . . . . . . . . . . . . 74 B. NH UNIT . . . . . . . . . . . . . . . . . . . . . . . . . . . . . . . . . . . . . . . . . . . . . . . . . . . . . . . . 74 C. DISTRIBUTORS . . . . . . . . . . . . . . . . . . . . . . . . . . . . . . . . . . . . . . . . . . . . . . . . . . 74 D. SAM-e . . . . . . . . . . . . . . . . . . . . . . . . . . . . . . . . . . . . . . . . . . . . . . . . . . . . . . . . . . 74 E. BLOWER PACK . . . . . . . . . . . . . . . . . . . . . . . . . . . . . . . . . . . . . . . . . . . . . . . . . . . 74 F. CONTROLS . . . . . . . . . . . . . . . . . . . . . . . . . . . . . . . . . . . . . . . . . . . . . . . . . . . . . . 75
WARRANTY
2008-10-01

LIST OF FIGURES
Figure |
Page |
10-00 ELECTRODE STEAM ENGINEERING
Figure 1. NHTC . . . . . . . . . . . . . . . . . . . . . . . . . . . . . . . . . . . . . . . . . . . . . . . . . . . . . . . . . . 2 Figure 2. Optimum Boiling Time . . . . . . . . . . . . . . . . . . . . . . . . . . . . . . . . . . . . . . . . . . . . . 5 Figure 3. Conductivity . . . . . . . . . . . . . . . . . . . . . . . . . . . . . . . . . . . . . . . . . . . . . . . . . . . . . 5 Figure 4. Typical Auto-Adaptive Operation . . . . . . . . . . . . . . . . . . . . . . . . . . . . . . . . . . . . . 7 Figure 5. Capacity Setting & Cylinder Life . . . . . . . . . . . . . . . . . . . . . . . . . . . . . . . . . . . . . . 8 Figure 6. Output vs Service Life . . . . . . . . . . . . . . . . . . . . . . . . . . . . . . . . . . . . . . . . . . . . . 8 Figure 7. Typical NHRS Installation . . . . . . . . . . . . . . . . . . . . . . . . . . . . . . . . . . . . . . . . . . 10
10-10 HUMIDITY, STEAM ABSORPTION AND DISTRIBUTION
Figure 1. |
Schematic of a Typical Print Shop HVAC System . . . . . . . . . . . . . . . . . . . . . . |
19 |
Figure 2. |
Psychrometric Chart . . . . . . . . . . . . . . . . . . . . . . . . . . . . . . . . . . . . . . . . . . . . . . |
27 |
Figure 3. |
Steam Distributor Location . . . . . . . . . . . . . . . . . . . . . . . . . . . . . . . . . . . . . . . . . |
29 |
Figure 4. |
Condensate Drain Pan . . . . . . . . . . . . . . . . . . . . . . . . . . . . . . . . . . . . . . . . . . . . |
31 |
Figure 5. |
Proper Slope . . . . . . . . . . . . . . . . . . . . . . . . . . . . . . . . . . . . . . . . . . . . . . . . . . . |
32 |
Figure 6. |
Drain Tee . . . . . . . . . . . . . . . . . . . . . . . . . . . . . . . . . . . . . . . . . . . . . . . . . . . . . . |
32 |
Figure 7. |
Steam Line Connection . . . . . . . . . . . . . . . . . . . . . . . . . . . . . . . . . . . . . . . . . . . |
35 |
Figure 8. |
Condensate Tee At Any Low Point In Steam Line . . . . . . . . . . . . . . . . . . . . . . . |
35 |
Figure 9. |
Trap To Prevent Steam In Condensate Line . . . . . . . . . . . . . . . . . . . . . . . . . . . |
35 |
Figure 10. |
Levelling the Distributor . . . . . . . . . . . . . . . . . . . . . . . . . . . . . . . . . . . . . . . . . . . |
37 |
Figure 11. |
Single Steam Distributor Installation – Minimum Clearance . . . . . . . . . . . . . . . |
38 |
Figure 12. |
Cutting Duct For Mounting . . . . . . . . . . . . . . . . . . . . . . . . . . . . . . . . . . . . . . . . . |
39 |
Figure 13. |
Humidification Distance Nomogram . . . . . . . . . . . . . . . . . . . . . . . . . . . . . . . . . . |
39 |
Figure 14. |
Best Location for Multiple Steam Distributors . . . . . . . . . . . . . . . . . . . . . . . . . . |
40 |
Figure 15. |
Roof Top Units 2-20 Tons – Typical Location . . . . . . . . . . . . . . . . . . . . . . . . . . |
41 |
Figure 16. |
Small Units On Residential Furnaces . . . . . . . . . . . . . . . . . . . . . . . . . . . . . . . . . |
41 |
Figure 17. |
SAM-e Tubes . . . . . . . . . . . . . . . . . . . . . . . . . . . . . . . . . . . . . . . . . . . . . . . . . . . |
42 |
Figure 18. |
Cross-Section of Distributor Pipe . . . . . . . . . . . . . . . . . . . . . . . . . . . . . . . . . . . . |
42 |
Figure 19. |
Absorption Distance – 3" Centers . . . . . . . . . . . . . . . . . . . . . . . . . . . . . . . . . . . |
45 |
Figure 20. |
Absorption Distance – 6" Centers . . . . . . . . . . . . . . . . . . . . . . . . . . . . . . . . . . . |
45 |
Figure 21. |
Absorption Distance – 9" Centers . . . . . . . . . . . . . . . . . . . . . . . . . . . . . . . . . . . |
45 |
Figure 22. |
Absorption Distance – 12" Centers . . . . . . . . . . . . . . . . . . . . . . . . . . . . . . . . . . |
45 |
Figure 23. |
SAM-e Header . . . . . . . . . . . . . . . . . . . . . . . . . . . . . . . . . . . . . . . . . . . . . . . . . . |
23 |
Figure 24. |
SAM-e Tubes . . . . . . . . . . . . . . . . . . . . . . . . . . . . . . . . . . . . . . . . . . . . . . . . . . . |
23 |
Figure 25. |
Steam Inlet . . . . . . . . . . . . . . . . . . . . . . . . . . . . . . . . . . . . . . . . . . . . . . . . . . . . . |
47 |
Figure 26. |
Typical SAM-e Installation for Atmospheric Steam Applications . . . . . . . . . . . . |
50 |
Figure 27. |
NH Series Humidifier With Built-On Blower Pack . . . . . . . . . . . . . . . . . . . . . . . . |
51 |
Figure 28. |
NH Series Remote Mounted Blower Pack . . . . . . . . . . . . . . . . . . . . . . . . . . . . . |
51 |
Figure 29. |
Set Point Versus Outdoor Temperature . . . . . . . . . . . . . . . . . . . . . . . . . . . . . . . |
54 |
Figure 30. |
NORTEC OnLine Monitoring . . . . . . . . . . . . . . . . . . . . . . . . . . . . . . . . . . . . . . . |
56 |
Figure 31. |
NORTEC Online Configuration Form . . . . . . . . . . . . . . . . . . . . . . . . . . . . . . . . . |
59 |
Figure 32. |
NORTEC Links Form . . . . . . . . . . . . . . . . . . . . . . . . . . . . . . . . . . . . . . . . . . . . . |
60 |
2008-10-01

Figure |
Page |
Figure 33. Humidifier Controlled by Air Proving, On/Off Duct Mounted High Limit and Modulating Wall Mounted Space Controller . . . . . . . . . . . . . . . . . . . . . . . . . . . . 61
Figure 34. Humidifier Controlled by Air Proving, Modulating Duct Mounted High Limit
and Modulating Wall Mounted Space Controller . . . . . . . . . . . . . . . . . . . . . . . . 61 Figure 35. Humidifier Controlled by Air Proving, Modulating Duct Mounted High Limit
and Modulating Wall Mounted Return Air Sensor with Wall Mounted
Controller . . . . . . . . . . . . . . . . . . . . . . . . . . . . . . . . . . . . . . . . . . . . . . . . . . . . . . 62 Figure 36. Humidifier Controlled by Air Proving, Duct Mounted High Limit Sensor
and Modulating Duct Mounted Return Air Sensor with Networking Option . . . . 62
10-30 SUBMITTALS
Figure 1. |
Low Voltage Control Terminal Strip . . . . . . . . . . . . . . . . . . . . . . . . . . . . . . . . . . |
77 |
Figure 2. |
Primary (Line) Voltage Wiring to Unit . . . . . . . . . . . . . . . . . . . . . . . . . . . . . . . . . |
78 |
Figure 3. |
Physical Data - NHTC/NHPC 005-030 . . . . . . . . . . . . . . . . . . . . . . . . . . . . . . . . |
79 |
Figure 4. |
Physical Data - NHTC/NHPC 050-100 . . . . . . . . . . . . . . . . . . . . . . . . . . . . . . . . |
80 |
Figure 5. |
Physical Data - NHTC/NHPC 150-200 . . . . . . . . . . . . . . . . . . . . . . . . . . . . . . . . |
81 |
Figure 6. |
Distributor Dimensions (3 Sheets) . . . . . . . . . . . . . . . . . . . . . . . . . . . . . . . . . . . |
82 |
Figure 7. |
SAM-e General Dimensions . . . . . . . . . . . . . . . . . . . . . . . . . . . . . . . . . . . . . . . . |
85 |
Figure 8. |
General Mini SAM-e Dimensions . . . . . . . . . . . . . . . . . . . . . . . . . . . . . . . . . . . . |
86 |
Figure 9. |
In-Duct/AHU Installation Without Mounting Frame Installation . . . . . . . . . . . . . |
87 |
Figure 10. |
In-Duct/AHU Installation With Mounting Frame Installation . . . . . . . . . . . . . . . . |
88 |
Figure 11. |
Outside Duct Installation Without Mounting Frame Installation . . . . . . . . . . . . . |
89 |
Figure 12. |
Outside Duct Installation With Mounting Frame Installation . . . . . . . . . . . . . . . . |
90 |
Figure 13. |
Vertical Duct Installation . . . . . . . . . . . . . . . . . . . . . . . . . . . . . . . . . . . . . . . . . . . |
91 |
Figure 14. |
Outside Duct Mounting Cover Plates . . . . . . . . . . . . . . . . . . . . . . . . . . . . . . . . . |
91 |
Figure 15. |
Atmospheric SAM-e Adapter Dimensions . . . . . . . . . . . . . . . . . . . . . . . . . . . . . |
92 |
Figure 16. |
Atmospheric Steam Header and Adapter Configuration . . . . . . . . . . . . . . . . . . |
93 |
Figure 17. |
Physical Data for Remote Mounted Blower Pack . . . . . . . . . . . . . . . . . . . . . . . |
94 |
Figure 18. |
Physical Data Units With Optional Built-On Blower Packs . . . . . . . . . . . . . . . . . |
95 |
Figure 19. |
Wall Digital Humidistat . . . . . . . . . . . . . . . . . . . . . . . . . . . . . . . . . . . . . . . . . . . . |
97 |
Figure 20. |
Duct Sensor . . . . . . . . . . . . . . . . . . . . . . . . . . . . . . . . . . . . . . . . . . . . . . . . . . . . |
98 |
2008-10-01

|
LIST OF TABLES |
|
Table |
|
Page |
10-00 ELECTRODE STEAM ENGINEERING |
|
|
Table 1. |
Features Comparison . . . . . . . . . . . . . . . . . . . . . . . . . . . . . . . . . . . . . . . . . . |
. . . 7 |
Table 2. |
NHTC/NHPC Characteristics . . . . . . . . . . . . . . . . . . . . . . . . . . . . . . . . . . . . |
. . . 9 |
10-10 HUMIDITY, STEAM ABSORPTION AND DISTRIBUTION |
|
|
Table 1. |
Outdoor/Indoor Relative Humidity Conversion Chart . . . . . . . . . . . . . . . . . . |
. . 14 |
Table 2. |
Load Calculation Summary Sheet . . . . . . . . . . . . . . . . . . . . . . . . . . . . . . . . |
. . . 14 |
Table 3. |
Grains of Water Per Cubic Foot – Saturated Air (100% rh) . . . . . . . . . . . . . |
. . 15 |
Table 4. |
Design Outdoor Conditions . . . . . . . . . . . . . . . . . . . . . . . . . . . . . . . . . . . . . |
. . 16 |
Table 5. |
Inside Relative Humidities At Which Moisture Will Condense On Windows |
. . 21 |
Table 6. |
Regain of Hygroscopic Materials . . . . . . . . . . . . . . . . . . . . . . . . . . . . . . . . . |
. . . 22 |
Table 7. |
Design Indoor Conditions For Various Places, Products and Processes . . . |
. . . 23 |
Table 8. |
Variables That Affect Absorption Distances . . . . . . . . . . . . . . . . . . . . . . . . . |
. . . 28 |
Table 9. |
Typical Absorption Distances, Single Distributor, 100 lbs/hr Humidifier . . . . |
. . . 29 |
Table 10. |
Water (lbs/hr) Contained in 1000 CFM of Air . . . . . . . . . . . . . . . . . . . . . . . . |
. . . 30 |
Table 11. |
Steam Line Material . . . . . . . . . . . . . . . . . . . . . . . . . . . . . . . . . . . . . . . . . . . |
. . . 33 |
Table 12. |
Recommended Material and Size for Steam Run . . . . . . . . . . . . . . . . . . . . . |
. . 33 |
Table 13. |
Recommended Condensate Line at Distributor(s) . . . . . . . . . . . . . . . . . . . . . |
. . 33 |
Table 14. |
Maximum Recommended Length of Steam Runs . . . . . . . . . . . . . . . . . . . . . |
. . 34 |
Table 15. |
Air Pressure Loss in AHU/Duct . . . . . . . . . . . . . . . . . . . . . . . . . . . . . . . . . . . |
. . 44 |
Table 16. |
Condensate Loss . . . . . . . . . . . . . . . . . . . . . . . . . . . . . . . . . . . . . . . . . . . . . . |
. . 46 |
Table 17. |
SAM-e Tube Matrix . . . . . . . . . . . . . . . . . . . . . . . . . . . . . . . . . . . . . . . . . . . . |
. . 48 |
Table 18. |
Mini SAM-e Headers – 3" . . . . . . . . . . . . . . . . . . . . . . . . . . . . . . . . . . . . . . . . |
. . 49 |
Table 19. |
Mini SAM-e Headers – 6" . . . . . . . . . . . . . . . . . . . . . . . . . . . . . . . . . . . . . . . . |
. . 49 |
Table 20. |
Mini SAM-e Tubes . . . . . . . . . . . . . . . . . . . . . . . . . . . . . . . . . . . . . . . . . . . . . |
. . 49 |
Table 21. |
Mini Inlet Configurations – For Atmospheric Steam Unit . . . . . . . . . . . . . . . . |
. . 49 |
Table 22. |
Ceiling and Frontal Clearances for Blower Packs . . . . . . . . . . . . . . . . . . . . . |
. . 52 |
10-30 SUBMITTALS |
|
|
Table 1. |
NH Series Unit Options . . . . . . . . . . . . . . . . . . . . . . . . . . . . . . . . . . . . . . . . . |
. . 99 |
Table 2. |
Common Accessories Universal . . . . . . . . . . . . . . . . . . . . . . . . . . . . . . . . . . |
. 100 |
Table 3. |
Steam Distributors . . . . . . . . . . . . . . . . . . . . . . . . . . . . . . . . . . . . . . . . . . . . . |
. 100 |
Table 4. |
Steam Distributor Accessories . . . . . . . . . . . . . . . . . . . . . . . . . . . . . . . . . . . . |
. 101 |
Table 5. |
SAM-e Header . . . . . . . . . . . . . . . . . . . . . . . . . . . . . . . . . . . . . . . . . . . . . . . . |
. 103 |
Table 6. |
Adjustable Mounting Frame for SAM-e . . . . . . . . . . . . . . . . . . . . . . . . . . . . . |
. 106 |
Table 7. |
SAM-e Tube Matrix . . . . . . . . . . . . . . . . . . . . . . . . . . . . . . . . . . . . . . . . . . . . |
. 106 |
Table 8. |
SAM-e Inlet and Adapter Configurations . . . . . . . . . . . . . . . . . . . . . . . . . . . . |
. 110 |
Table 9. |
Remote Blower Pack . . . . . . . . . . . . . . . . . . . . . . . . . . . . . . . . . . . . . . . . . . . |
. 111 |
Table 10. |
Built-On Blower Pack . . . . . . . . . . . . . . . . . . . . . . . . . . . . . . . . . . . . . . . . . . . |
. 111 |
Table 11. |
Controls – ON/OFF . . . . . . . . . . . . . . . . . . . . . . . . . . . . . . . . . . . . . . . . . . . . |
. 112 |
Table 12. |
Modulating Control By NORTEC . . . . . . . . . . . . . . . . . . . . . . . . . . . . . . . . . . |
. 112 |
2008-10-01

Table |
Page |
Table 13. Modulating Demand Signal By Others Single Channel. . . . . . . . . . . . . . . . . . . 113 Table 14. Modulating Demand Signal By Others Dual Channel . . . . . . . . . . . . . . . . . . . . 113 Table 15. Modulating By Other Transducer Signal . . . . . . . . . . . . . . . . . . . . . . . . . . . . . 113 Table 16. NORTEC OnLine Options . . . . . . . . . . . . . . . . . . . . . . . . . . . . . . . . . . . . . . . . 114 Table 17. NORTEC Links Options . . . . . . . . . . . . . . . . . . . . . . . . . . . . . . . . . . . . . . . . . . 114 Table 18. NH Series Fusing Options. . . . . . . . . . . . . . . . . . . . . . . . . . . . . . . . . . . . . . . . . 114
2008-10-01

10-00 INTRODUCTION
10-00
Page 1 2008-10-01
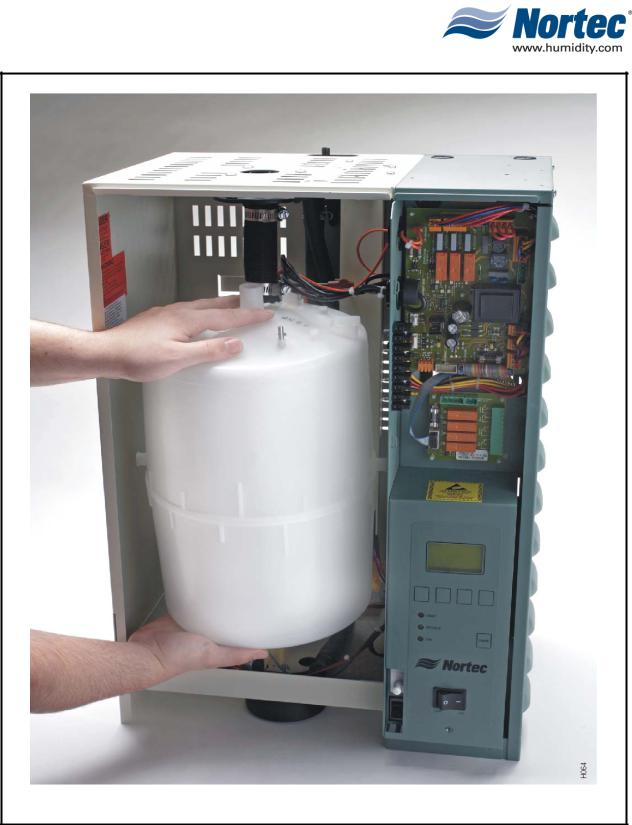
Figure 1. NHTC
10-00
Page 2 2008-10-01
1. INTRODUCTION
The NHTC humidifier is controlled by Nortec’s Patented Auto adaptive Water Management Control System. This system allows the humidifiers to adapt to basically any potable incoming water and changes that occur to the water supply. This eliminates the need to readjust drain timers, changes complete cylinders or time consuming adjustment of electrode spacing’s. The system also adjusts the drain rate of the humidifier to reduce the amount of drain water exiting the humidifier as water conditions change. This reduces energy loss due to excessive draining of hot water and extends cylinder life since less water and minerals enter the humidifier.
The following is a brief description of how the Auto-Adaptive water Management System works.
The electrode steam system produces pure uncontaminated steam with variable output through electronic power control of the electrodes. Water borne minerals remain in the cylinder and are periodically flushed out through the automatic cylinder drain. On NHTC and NHPC models the drain automatically empties the steam cylinder if it is not operated for three days. Solid mineral scale sinks to the bottom of the cylinder which, when filled with residue, is easily removed and replaced.
A.PROPORTIONAL + INTEGRAL AUTO-ADAPTIVE CONTROL SYSTEM FOR THE NHTC/ NHPC
(1)NORTEC’s patented P+I Auto-Adaptive control system allows the unit to operate at an optimal low water level using the same fixed electrode spacing regardless of the incoming water conditions. Boiling of the water allows the minerals in the water to remain behind in the cylinder. This raises the contained water conductivity to a value higher than the incoming water. The P+I Auto-Adaptive control system monitors and adjusts the contained water conductivity as these changes occur.
(2)The humidifiers are designed to produce full steam output at the lowest possible electrode coverage to obtain maximum cylinder life.
(3)The units operate between A and D of the main steam output demand. Accordingly, the current flow between the electrodes in the cylinder is maintained between these pre-established limits programmed into the P+I Auto-Adaptive control system.
(4)As the water boils away and the electrode coverage is reduced, the steam output is also reduced slightly. A pre-determined design parameter of every NORTEC cylinder is the known time (To) (time optimum) that it takes to boil down from A to D of output (also referenced to as amp trigger points) at a pre-designed contained water conductivity. (See Figure 2.)
(5)Whenever the conductivity in the cylinder water is lower than the designed conductivity, the (Ta) (time actual) to boil down from A to D will be longer than the To. (See Figure 3.)
10-00
Page 3 2008-10-01

(6)As the water is boiled away, the minerals left behind increase the conductivity of the water in the cylinder. As soon as the conductivity is greater than design, the Ta to boil from A to D will be shorter than To and a drain cycle is initiated.
(7)The fill valve always opens during timer drains, adding cold water to mix with the hot water from the cylinder during automatic drain cycles. This tempering process is required to meet plumbing codes.
(8)As can be seen from a typical sequence depicted in Figure 4, the P+I AutoAdaptive system allows the unit to be self-regulating. It drains only when necessary and only the amount of water to maintain optimum operating conditions.
(9)Relying on the proportional (P) feedback only to decide how much to drain is like guessing what is happening based on a ‘snapshot’ only. By taking into consideration a series of “snapshots”: (one from each of the past ten cycles for example), the control system has more data on which to base its decision to drain. The integral (I) part of the P+I Auto-Adaptive system provides this added feedback.
(10)The proportional (P) and integral (I) factors have been weighted as to the relative influence each will have when the NHTC/NHPC calculates a drain. The preprogrammed weighing was derived through extensive field and laboratory tests. When supply water conductivity is extremely high (requiring substantially more drains), the NHTC/NHPC will see the pattern developing in cycles stored in memory. It will then initiate additional drains to adjust the contained water conductivity.
(11)If low conductive water conditions occur, the P+I control will reduce the drains necessary to maintain optimum operating conditions within the cylinder. If extreme water conditions are encountered, the NHTC/NHPC can be reprogrammed with factory instructions to compensate.
(12)NORTEC’s P+I Auto-Adaptive control system has been designed to benefit users who demand very tight control of the relative humidity. It maintains steam output above the B level, even during auto drains. (See Figure 4.)
(13)The P+I Auto-Adaptive control system allows the humidifier to maintain tighter humidity control without the problem of rh depression during drain cycles that occur with other humidifiers. This results in more consistent space rh levels, even with a simple on/off control system.
10-00
Page 4 2008-10-01
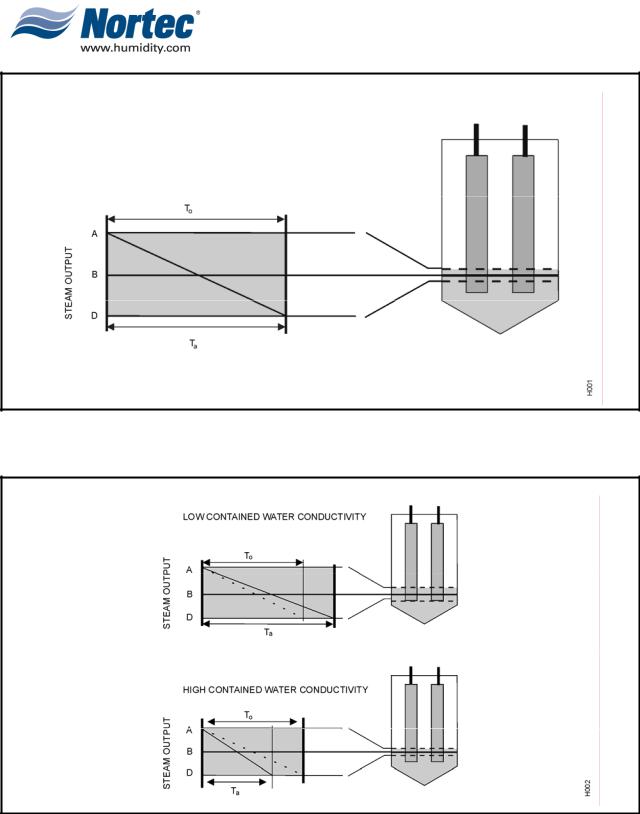
Figure 2. Optimum Boiling Time
Figure 3. Conductivity
10-00
Page 5 2008-10-01

B.NH CAPACITY ADJUSTMENT
(1)Each NORTEC NH Series humidifier is rated at its maximum output capacity. By means of the alphanumeric display and keypad on the NHTC/NHPC, the humidifiers can be adjusted to obtain an output between 20% and 100% of its rated capacity.
C.DRAIN CYCLE AND CYLINDER LIFE
(1)Water Type Used (Potable or Softened)
(a)The electrode steam product line is one of the most efficient humidifier systems since it uses the minerals in the water to conduct electricity. If no minerals are present no current can pass from one electrode to another, thus no steam production can occur.
(b)Although the electrode steam humidifier is ideal for potable water, it should not be used with pure reverse osmosis or deionized water since the conductivity is too low.
(2)Water Conditions vs Cylinder Life
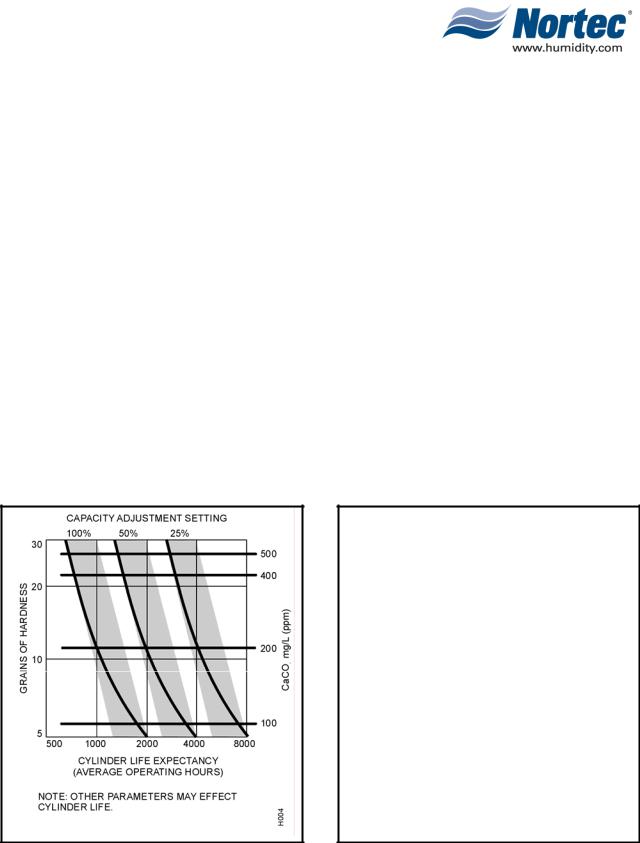
(a)The NH Series is designed to adapt to most potable or softened water supplies. Since the output of all NH Series humidifiers is pure, clean steam,
minerals originally in the incoming water are left behind in the steam cylinder. Many of these minerals will be removed during short flush cycles within the cylinder. Therefore, the water chemistry, the unit running time, and output capacity setting ultimately determines the cylinder life. (See Figure .)
(3)Output vs Cylinder Life
(a)As minerals build-up on the electrodes in the cylinder of the NORTEC NH Series humidifier, the patented P+I Auto-Adaptive control system automatically raises the water level slightly in the cylinder. This exposes fresh electrode surface to the water and maintains peak output and efficiency from the humidifier. Once the
(b)electrode surface is completely encrusted by the minerals, the user is alerted
to change the cylinder. Other humidifiers’ performance degrades gradually as the minerals build-up. The NH Series maintains maximum efficiency then the cylinder is replaced. (See Figure .)
(4)Water Conditions vs Drain Rate
(a)The P+I Auto-Adaptive control system automatically adjusts the drain rate to maintain the design water conductivity required for proper operation. This ensures regular flushing of minerals which become concentrated in the water, and minimizing wastage of hot water. The humidifier automatically adjusts it’s drain rate with changes in incoming water conductivity through the Autoadaptive water management system.
10-00
Page 6 2008-10-01
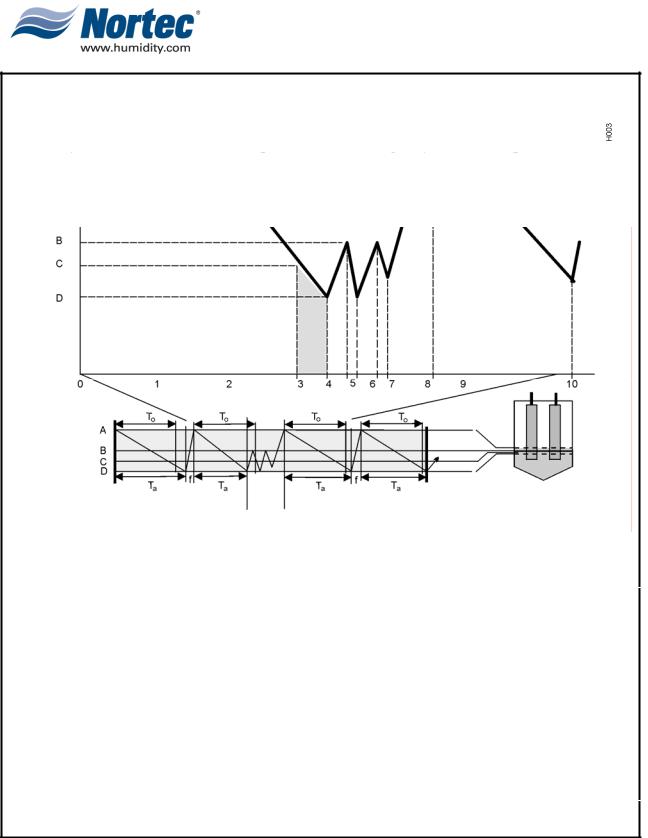
0.Store previous cycle’s drain decision in integral (l) memory.
1.Fill to A trigger (use all places below 1-10).
2.Boil to C trigger without timing to allow previous fill water to mix thoroughly during boiling.
3.Boil from C to D while monitoring time (T actual).
4.Decide how long (how much) to drain, then fill to B.
5.Drain according to the P+I calculated drain time, fill on to control outlet temperature.
6.At D, stop draining and postpone remaining drain, fill to B.
7.Continue remaining drain.
8.With drain finished, fill to A.
9.Boil to D, timing from C to D.
10.Decide how long to drain (in this case zero) based on present and past cycles.
Figure 4. Typical Auto-Adaptive Operation
10-00
Page 7 2008-10-01
It is important to note that the drain rate shown includes the make-up water, mixed with the drain water, which tempers the drain water to 140°F (60°C) or less.
NOTE
The electrode steam process provides optimum efficiency because all resistance to current passage is converted to usable energy. Unlike cal-rod or infrared humidifiers which convert some of their capacities into unusable heat.
Figure 5. Capacity Setting & Cylinder Life |
Figure 6. Output vs Service Life |
10-00
Page 8 2008-10-01

3.PRE-INSTALLATION EQUIPMENT VERIFICATION
A.GENERAL
(1)Ensure the available voltage and phase correspond with humidifier voltage and phase as indicated on the humidifier’s specification label.
(2)Ensure that the external fuse disconnect is sufficient size to handle the rated amperage as indicated on the humidifier’s specifications label. Refer to local building codes.
(3)Report any discrepancy immediately to the site engineer.
(4)Location and mounting is described in Chapter 10-10.
(5)For typical installation see Figures 6 & 7.
10-00
Page 9 2008-10-01

Figure 6. Typical NHRS Installation (Sheet 1 of 2)
10-00
Page 10 2008-10-01
Figure 7. Typical NHRS Installation (Sheet 2 of 2)
10-00
Page 11 2008-10-01

10-10
HUMIDITY,
STEAM ABSORPTION
AND
DISTRIBUTION
10-10
Page 12 2008-10-01
HUMIDITY, STEAM ABSORPTION AND DISTRIBUTION
1. HUMIDITY
A. ESTIMATING THE HUMIDIFICATION LOAD
Note: The humidification load can easily be calculated by using Nortec’s Humidification Engineering and Load-sizing Program (HELP). The softward can be downloaded at www.humidity.com
(1)Relative humidity is the percentage of moisture in the volume of air at a given temperature, compared to the maximum amount of moisture that the volume of air can hold at the same temperature and atmospheric pressure. As air becomes warmer, it can absorb more moisture per unit volume. Therefore a quantity of air containing a specific amount of moisture will have different values of relative humidity as the temperature changes.
(2)It is this process that causes dry air in building. As cold incoming air is heated, its relative humidity value drops. Therefore moisture must be added to attain an acceptable level of humidity within the building. Determining how much moisture must be added is the object of this brochure. Table 2 simplifies the calculations which are described here in detail.
B.LOAD CALCULATION SUMMARY
(1)In order to determine the humidification load three basic values need to be known:
(a)The design conditions of the humidified space, i.e., the temperature and humidity required.
(b)The conditions of the incoming air, i.e., the temperature and humidity available.
(c)Incoming air volume and secondary conditions that can affect the humidification load.
(2)Data and calculations required to estimate humidification load are described in Tables 1, 2 and 3.
C.TEMPERATURE AND HUMIDITY REQUIRED
(1)The design temperature and humidity of a space depends mostly upon the job being
performed. Once the design temperature and humidity have been established, the required moisture can be found in gr/ft3 from Table 3. Remember always to take the worst case (highest temperature, highest humidity).
(2)Formula 1
For example:
The press room of a printing plant should be kept at 76 - 80°F with 43% - 47% rh
Therefore, the worst case is 80°F, 47% rh.
From Table 3 the required moisture is 11.04 gr/ft3 x 47% = 5.19 gr/ft3
D.TEMPERATURE AND HUMIDITY AVAILABLE
(1)The outdoor conditions tell us the moisture available in the incoming air. Approximate values can be obtained from Table 4 and combined with Table 3 to find moisture available. Once again we must take the worst case (here, it is lowest temperature, lowest humidity). As can be seen, the contribution of moisture from the outside air is almost zero.
10-10
Page 13 2008-10-01

Table 1. Outdoor/Indoor Relative Humidity Conversion Chart
Outdoor relative humidity
100% |
2 |
4 |
5 |
6 |
7 |
9 |
12 |
17 |
19 |
23 |
29 |
36 |
43 |
52 |
95% |
2 |
3 |
4 |
6 |
7 |
9 |
12 |
16 |
17 |
22 |
28 |
34 |
41 |
50 |
90% |
2 |
3 |
4 |
5 |
6 |
8 |
11 |
15 |
16 |
21 |
26 |
31 |
39 |
48 |
85% |
2 |
3 |
4 |
5 |
6 |
8 |
11 |
14 |
15 |
20 |
24 |
29 |
37 |
45 |
80% |
2 |
3 |
4 |
5 |
6 |
7 |
10 |
13 |
15 |
19 |
23 |
27 |
35 |
42 |
75% |
2 |
3 |
4 |
4 |
5 |
7 |
10 |
12 |
14 |
18 |
22 |
26 |
33 |
39 |
70% |
1 |
2 |
3 |
4 |
5 |
6 |
9 |
11 |
13 |
17 |
20 |
24 |
31 |
36 |
65% |
1 |
2 |
3 |
4 |
4 |
5 |
8 |
10 |
12 |
15 |
19 |
23 |
29 |
34 |
60% |
1 |
2 |
3 |
3 |
4 |
5 |
7 |
9 |
11 |
14 |
17 |
21 |
26 |
31 |
55% |
1 |
1 |
3 |
3 |
4 |
4 |
7 |
8 |
10 |
13 |
16 |
19 |
24 |
29 |
50% |
1 |
1 |
2 |
3 |
3 |
4 |
6 |
8 |
9 |
12 |
14 |
18 |
22 |
26 |
45% |
1 |
1 |
2 |
3 |
3 |
4 |
6 |
7 |
8 |
11 |
13 |
16 |
20 |
24 |
40% |
1 |
1 |
2 |
2 |
3 |
4 |
5 |
7 |
7 |
10 |
12 |
14 |
18 |
21 |
35% |
1 |
1 |
2 |
2 |
2 |
4 |
5 |
6 |
6 |
9 |
10 |
12 |
15 |
18 |
30% |
0 |
1 |
2 |
2 |
2 |
3 |
4 |
5 |
6 |
7 |
9 |
11 |
13 |
15 |
25% |
0 |
1 |
1 |
1 |
2 |
3 |
3 |
4 |
5 |
5 |
7 |
9 |
11 |
13 |
20% |
0 |
1 |
1 |
1 |
2 |
2 |
3 |
3 |
4 |
5 |
5 |
7 |
9 |
10 |
15% |
0 |
0 |
1 |
1 |
1 |
1 |
2 |
3 |
3 |
4 |
4 |
5 |
6 |
8 |
10% |
0 |
0 |
0 |
1 |
1 |
1 |
2 |
2 |
2 |
3 |
3 |
3 |
4 |
6 |
5% |
0 |
0 |
0 |
0 |
0 |
0 |
1 |
1 |
1 |
2 |
2 |
2 |
3 |
3 |
0% |
0 |
0 |
0 |
0 |
0 |
0 |
0 |
0 |
0 |
0 |
0 |
0 |
0 |
0 |
|
|
|
|
|
|
|
|
|
|
|
|
|
|
|
|
-20° |
-10° |
-5° |
0° |
+5° |
+10° |
+15° |
+20° |
+25° |
+30° |
+35° |
+40° |
+45° |
+50° |
Outdoor temperature
Chart shows what the residual indoor RH would be at 70°F under varying outdoor conditions if a proper humidification system were not installed in the building. Studies indicate that the recommended RH should be between 40% and 60% for optimum benefits to the occupants.
Table 2. Load Calculation Summary Sheet
Determine the moisture required in the space (Table 3) |
|
|
|||
|
Grains from Table 3 at space temp. ______ x Indoor RH |
= A ______ gr/ft3 |
|
||
Determine the moisture level of incoming air (Table 4) |
|
|
|||
|
Grains from Table 4 at space temp. ______ x Outdoor RH |
= B ______ gr/ft3 |
|
||
Therefore: moisture to be added: (moisture) M - A - B ______ gr/ft3 |
|
→M ______ gr/ft3 |
|||
Determine the volume of air to be humidified. Choose the largest |
|
|
|||
value. |
|
|
|||
1. |
Natural ventilation: Volume x number of air changes. |
______ ft3/hr |
|
||
2. |
Exhaust air: CFM x 60 min/hr |
______ ft3/hr |
|
||
3. |
Make-up air: CFM x 60 min/hr |
______ ft3/hr |
→C ______ ft3/hr |
||
Therefore: Gross humidification load = L (load) = MxC = ______ lbs/hr |
→L ______ lbs/hr |
||||
|
|
7,000 |
|
|
|
NOTES: 1. 7,000 grains = 1 pound
2. If HVAC system uses economizer cycle, check load using formula 6.
10-10
Page 14 2008-10-01

Table 3. Grains of Water Per Cubic Foot – Saturated Air (100% rh)
°C |
°F |
Grains |
|
°C |
°F |
Grains |
|
°C |
°F |
Grains |
|
°C |
°F |
Grains |
|
°C |
°F |
Grains |
|
°C |
°F |
Grains |
|
|
|
|
|
|
|
|
|
|
|
|
|
|
|
|
|
|
|
|
|
|
|
-23 |
-10 |
.29 |
|
4 |
40 |
2.86 |
|
|
58 |
5.41 |
|
|
76 |
9.75 |
|
35 |
95 |
17.28 |
|
|
114 |
29.34 |
|
|
|
|
|
|
|
|
|
|
|
|
|
|
|
|
|
|
|
|
|
|
|
|
-5 |
.35 |
|
|
41 |
2.97 |
|
|
59 |
5.60 |
|
|
77 |
10.06 |
|
|
96 |
17.80 |
|
|
115 |
30.13 |
|
|
|
|
|
|
|
|
|
|
|
|
|
|
|
|
|
|
|
|
|
|
|
-18 |
0 |
.48 |
|
|
42 |
3.08 |
|
16 |
60 |
5.80 |
|
|
78 |
10.40 |
|
|
97 |
18.31 |
|
49 |
120 |
34.38 |
|
|
|
|
|
|
|
|
|
|
|
|
|
|
|
|
|
|
|
|
|
|
|
|
8 |
.61 |
|
|
43 |
3.20 |
|
|
61 |
6.00 |
|
|
79 |
10.80 |
|
|
98 |
18.85 |
|
|
125 |
39.13 |
|
|
|
|
|
|
|
|
|
|
|
|
|
|
|
|
|
|
|
|
|
|
|
-12 |
10 |
.78 |
|
|
44 |
3.32 |
|
|
62 |
6.20 |
|
27 |
80 |
11.04 |
|
|
99 |
19.39 |
|
54 |
130 |
44.41 |
|
|
|
|
|
|
|
|
|
|
|
|
|
|
|
|
|
|
|
|
|
|
|
-9 |
15 |
.99 |
|
7 |
45 |
3.44 |
|
|
63 |
6.41 |
|
|
81 |
11.40 |
|
38 |
100 |
19.95 |
|
|
135 |
50.30 |
|
|
|
|
|
|
|
|
|
|
|
|
|
|
|
|
|
|
|
|
|
|
|
-7 |
20 |
1.24 |
|
|
46 |
3.56 |
|
|
64 |
6.62 |
|
|
82 |
11.75 |
|
|
101 |
20.52 |
|
60 |
140 |
56.81 |
|
|
|
|
|
|
|
|
|
|
|
|
|
|
|
|
|
|
|
|
|
|
|
-4 |
25 |
1.56 |
|
|
47 |
3.69 |
|
18 |
65 |
6.85 |
|
|
83 |
12.11 |
|
|
102 |
21.11 |
|
|
145 |
64.04 |
|
|
|
|
|
|
|
|
|
|
|
|
|
|
|
|
|
|
|
|
|
|
|
-1 |
30 |
1.95 |
|
|
48 |
3.83 |
|
|
66 |
7.07 |
|
|
84 |
12.49 |
|
|
103 |
21.71 |
|
66 |
150 |
72.00 |
|
|
|
|
|
|
|
|
|
|
|
|
|
|
|
|
|
|
|
|
|
|
|
|
31 |
2.04 |
|
|
49 |
3.97 |
|
|
67 |
7.31 |
|
29 |
85 |
12.87 |
|
|
104 |
22.32 |
|
|
155 |
80.77 |
|
|
|
|
|
|
|
|
|
|
|
|
|
|
|
|
|
|
|
|
|
|
|
|
32 |
2.13 |
|
10 |
50 |
4.11 |
|
|
68 |
7.57 |
|
|
86 |
13.27 |
|
41 |
105 |
22.95 |
|
71 |
160 |
90.43 |
|
|
|
|
|
|
|
|
|
|
|
|
|
|
|
|
|
|
|
|
|
|
|
|
33 |
2.21 |
|
|
51 |
4.26 |
|
|
69 |
7.80 |
|
|
87 |
13.67 |
|
|
106 |
23.60 |
|
|
165 |
101.00 |
|
|
|
|
|
|
|
|
|
|
|
|
|
|
|
|
|
|
|
|
|
|
|
|
34 |
2.29 |
|
|
52 |
4.41 |
|
21 |
70 |
8.10 |
|
|
88 |
14.08 |
|
|
107 |
24.26 |
|
77 |
170 |
112.60 |
|
|
|
|
|
|
|
|
|
|
|
|
|
|
|
|
|
|
|
|
|
|
|
2 |
35 |
2.38 |
|
|
53 |
4.56 |
|
|
71 |
8.32 |
|
|
89 |
14.51 |
|
|
108 |
24.93 |
|
|
175 |
125.40 |
|
|
|
|
|
|
|
|
|
|
|
|
|
|
|
|
|
|
|
|
|
|
|
|
36 |
2.47 |
|
|
54 |
4.72 |
|
|
72 |
8.59 |
|
32 |
90 |
14.94 |
|
|
109 |
25.62 |
|
82 |
180 |
139.20 |
|
|
|
|
|
|
|
|
|
|
|
|
|
|
|
|
|
|
|
|
|
|
|
|
37 |
2.56 |
|
13 |
55 |
4.89 |
|
|
73 |
8.87 |
|
|
91 |
15.39 |
|
43 |
110 |
26.34 |
|
|
185 |
154.30 |
|
|
|
|
|
|
|
|
|
|
|
|
|
|
|
|
|
|
|
|
|
|
|
|
38 |
2.66 |
|
|
56 |
5.06 |
|
|
74 |
9.15 |
|
|
92 |
15.84 |
|
|
111 |
27.07 |
|
88 |
190 |
170.70 |
|
|
|
|
|
|
|
|
|
|
|
|
|
|
|
|
|
|
|
|
|
|
|
|
39 |
2.76 |
|
|
57 |
5.23 |
|
24 |
75 |
9.45 |
|
|
93 |
16.31 |
|
|
112 |
27.81 |
|
|
195 |
188.60 |
|
|
|
|
|
|
|
|
|
|
|
|
|
|
|
|
|
|
|
|
|
|
|
|
|
|
|
|
|
|
|
|
|
|
|
|
94 |
16.79 |
|
|
113 |
28.57 |
|
|
|
|
|
|
|
|
|
|
|
|
|
|
|
|
|
|
|
|
|
|
|
|
|
|
|
(2) Formula 2
Assume our printing plant is located in Denver, Colorado. From Table 4, the worst case is -10°F with 37% rh
From Table 3:
0.29 gr/ft3 x 37% rh - 0.11 gr/ft3
Combining this result with that of Moisture Required (A) we see that we will need
5.19 - 0.11 = 5.08 grains of moisture for every cubic foot of outside air brought in.
E.INCOMING AIR VOLUME
(1)The following outlines the steps necessary to determine the amount of outside air being brought into the humidified space and the corresponding amount of moisture required. There are three basic means by which outside air is introduced into the humidified space. These are:
(a)Through natural ventilation, for example, opening and closing doors and windows, and by infiltration through cracks and openings in the building construction.
(b)Through mechanical ventilation, for example, the introduction of make-up air, or the exhausting of stale air by the building HVAC system.
(c)Through the economizer section of the HVAC system - if this feature is included in the system.
(2)For maximum accuracy, all three should be estimated and the largest chosen.
10-10
Page 15 2008-10-01

Table 4. Design Outdoor Conditions
|
|
|
|
|
JANUARY |
|
|
|
JULY |
|
|
||
|
|
|
|
Relative Humidity |
|
Relative Humidity |
|
||||||
|
|
|
|
|
|
(% RH) |
|
|
|
(% RH) |
|
|
|
|
|
|
Dry |
7:30 |
|
1:30 |
|
7:30 |
Dry |
7:30 |
1:30 |
7:30 |
|
State |
City |
°C |
Bulb |
|
|
Bulb |
°C |
||||||
A.M. |
|
P.M. |
|
P.M. |
A.M. |
P.M. |
P.M. |
||||||
|
|
|
°F |
|
|
°F |
|
||||||
|
|
|
|
|
|
|
|
|
|
|
|
||
Alabama |
Birmingham |
-12 |
10 |
81 |
|
61 |
|
66 |
95 |
84 |
56 |
68 |
35 |
|
Mobile |
-12 |
10 |
-- |
|
-- |
|
-- |
95 |
90 |
64 |
78 |
35 |
Arizona |
Flagstaff |
-23 |
-10 |
83 |
|
58 |
|
-- |
90 |
77 |
36 |
-- |
32 |
|
Phoenix |
-4 |
25 |
75 |
|
47 |
|
39 |
105 |
53 |
31 |
23 |
41 |
|
Yuma |
-1 |
30 |
56 |
|
37 |
|
27 |
110 |
51 |
31 |
23 |
44 |
Arkansas |
Little Rock |
-15 |
5 |
80 |
|
67 |
|
68 |
95 |
85 |
55 |
59 |
35 |
|
|
|
|
|
|
|
|
|
|
|
|
|
|
California |
Eureka |
-1 |
30 |
87 |
|
-- |
|
77 |
90 |
92 |
-- |
80 |
32 |
|
Fresno |
-4 |
25 |
93 |
|
80 |
|
66 |
105 |
61 |
36 |
20 |
41 |
|
Los Angeles |
2 |
35 |
63 |
|
46 |
|
51 |
90 |
85 |
50 |
54 |
32 |
|
Sacramento |
-1 |
30 |
90 |
|
82 |
|
70 |
100 |
76 |
46 |
28 |
38 |
|
San Diego |
2 |
35 |
76 |
|
58 |
|
60 |
85 |
86 |
68 |
65 |
29 |
|
San Francisco |
2 |
35 |
84 |
|
68 |
|
70 |
85 |
92 |
75 |
78 |
29 |
Colorado |
Denver |
-23 |
-10 |
54 |
|
37 |
|
41 |
95 |
55 |
27 |
30 |
35 |
|
Grand Junction |
-26 |
-15 |
77 |
|
64 |
|
64 |
95 |
48 |
27 |
22 |
35 |
|
Pueblo |
-29 |
-20 |
67 |
|
44 |
|
48 |
95 |
73 |
34 |
35 |
35 |
Connecticut |
New Haven |
-18 |
0 |
75 |
|
65 |
|
69 |
95 |
77 |
64 |
74 |
35 |
Delaware |
Wilmington |
-18 |
0 |
77 |
|
62 |
|
70 |
95 |
80 |
52 |
69 |
35 |
District of |
Washington |
-18 |
0 |
73 |
|
56 |
|
64 |
95 |
78 |
52 |
64 |
35 |
Columbia |
|
|
|
|
|
|
|
|
|
|
|
|
|
Florida |
Jacksonville |
-4 |
25 |
89 |
|
56 |
|
75 |
95 |
85 |
57 |
76 |
35 |
|
Miami |
2 |
35 |
87 |
|
59 |
|
75 |
91 |
83 |
64 |
76 |
33 |
Georgia |
Atlanta |
-12 |
10 |
80 |
|
64 |
|
69 |
95 |
83 |
57 |
68 |
35 |
|
Augusta |
-12 |
10 |
84 |
|
59 |
|
69 |
98 |
83 |
55 |
69 |
37 |
|
Savannah |
-7 |
20 |
83 |
|
58 |
|
72 |
95 |
85 |
61 |
80 |
35 |
Idaho |
Boise |
-23 |
-10 |
82 |
|
75 |
|
74 |
95 |
54 |
34 |
23 |
35 |
|
Lewiston |
-20 |
-5 |
79 |
|
73 |
|
71 |
95 |
64 |
37 |
25 |
35 |
Illinois |
Cairo |
-18 |
0 |
81 |
|
69 |
|
-- |
98 |
83 |
57 |
-- |
37 |
|
Chicago |
-23 |
-10 |
81 |
|
70 |
|
75 |
95 |
78 |
51 |
55 |
35 |
|
Peoria |
-23 |
-10 |
83 |
|
72 |
|
77 |
96 |
81 |
53 |
58 |
35 |
Indiana |
Fort Wayne |
-23 |
-10 |
84 |
|
75 |
|
81 |
95 |
84 |
53 |
58 |
35 |
|
Indianapolis |
-23 |
-10 |
83 |
|
72 |
|
78 |
95 |
84 |
54 |
60 |
35 |
|
Terre Haute |
-18 |
0 |
82 |
|
70 |
|
76 |
95 |
77 |
50 |
56 |
35 |
Iowa |
Davenport |
-26 |
-15 |
-- |
|
-- |
|
-- |
95 |
-- |
-- |
-- |
35 |
|
Sioux City |
-29 |
-20 |
78 |
|
67 |
|
72 |
95 |
86 |
55 |
54 |
35 |
Kansas |
Dodge City |
-23 |
-10 |
78 |
|
57 |
|
61 |
95 |
77 |
45 |
52 |
35 |
|
Topeka |
-23 |
-10 |
78 |
|
64 |
|
67 |
100 |
85 |
54 |
54 |
38 |
Kentucky |
Louisville |
-18 |
0 |
78 |
|
68 |
|
69 |
95 |
77 |
52 |
57 |
35 |
Louisiana |
New Orleans |
-7 |
20 |
85 |
|
67 |
|
73 |
95 |
84 |
64 |
72 |
35 |
|
Shreveport |
-7 |
20 |
83 |
|
67 |
|
66 |
100 |
86 |
56 |
62 |
38 |
Maine |
Portland |
-21 |
-5 |
81 |
|
65 |
|
74 |
90 |
78 |
58 |
76 |
32 |
Maryland |
Baltimore |
-18 |
0 |
72 |
|
68 |
|
56 |
95 |
71 |
52 |
65 |
35 |
|
|
|
|
|
|
|
|
|
|
|
|
|
|
Massachusetts |
Boston |
-18 |
0 |
72 |
|
59 |
|
67 |
92 |
72 |
55 |
70 |
33 |
Michigan |
Detroit |
-23 |
-10 |
82 |
|
71 |
|
77 |
95 |
74 |
50 |
56 |
35 |
|
Grand Rapids |
-23 |
-10 |
85 |
|
78 |
|
80 |
95 |
76 |
51 |
54 |
35 |
Minnesota |
Duluth |
-32 |
-25 |
78 |
|
74 |
|
74 |
93 |
87 |
61 |
66 |
33 |
|
Minneapolis |
-29 |
-20 |
82 |
|
72 |
|
75 |
95 |
82 |
54 |
54 |
35 |
Mississippi |
Vicksburg |
-12 |
10 |
82 |
|
65 |
|
67 |
95 |
87 |
61 |
70 |
35 |
|
Kansas City |
-23 |
-10 |
78 |
|
64 |
|
66 |
100 |
76 |
48 |
47 |
38 |
Missouri |
St. Louis |
-18 |
0 |
77 |
|
65 |
|
68 |
95 |
73 |
50 |
55 |
35 |
Montana |
Billings |
-32 |
-25 |
67 |
|
73 |
|
60 |
90 |
65 |
40 |
33 |
32 |
|
Butte |
-29 |
-20 |
76 |
|
70 |
|
71 |
95 |
82 |
36 |
33 |
35 |
Nebraska |
North Platte |
-29 |
-20 |
80 |
|
62 |
|
66 |
85 |
84 |
50 |
46 |
29 |
|
Omaha |
-23 |
-10 |
82 |
|
68 |
|
73 |
95 |
80 |
51 |
51 |
35 |
Nevada |
Reno |
-21 |
-5 |
82 |
|
67 |
|
54 |
95 |
72 |
25 |
20 |
35 |
New Hampshire |
Concord |
-26 |
-15 |
78 |
|
60 |
|
69 |
90 |
80 |
49 |
69 |
32 |
10-10
Page 16 2008-10-01

Table 4. Design Outdoor Conditions (cont)
|
|
|
|
|
JANUARY |
|
|
|
JULY |
|
|
||
|
|
|
|
Relative Humidity |
|
Relative Humidity |
|
||||||
|
|
|
|
|
|
(% RH) |
|
|
|
(% RH) |
|
|
|
|
|
|
Dry |
7:30 |
|
1:30 |
|
7:30 |
Dry |
7:30 |
1:30 |
7:30 |
|
State |
City |
°C |
Bulb |
|
|
Bulb |
°C |
||||||
A.M. |
|
P.M. |
|
P.M. |
A.M. |
P.M. |
P.M. |
||||||
|
|
|
°F |
|
|
°F |
|
||||||
|
|
|
|
|
|
|
|
|
|
|
|
||
New Jersey |
Atlantic City |
-15 |
5 |
79 |
|
68 |
|
74 |
95 |
81 |
72 |
82 |
35 |
|
Newark |
-18 |
0 |
72 |
|
79 |
|
65 |
95 |
75 |
51 |
65 |
35 |
|
Trenton |
-18 |
0 |
73 |
|
62 |
|
68 |
95 |
77 |
55 |
68 |
35 |
New Mexico |
Albuquerque |
-18 |
0 |
68 |
|
51 |
|
46 |
95 |
59 |
33 |
28 |
35 |
New York |
Albany |
-23 |
-10 |
75 |
|
63 |
|
71 |
93 |
79 |
52 |
64 |
34 |
|
Buffalo |
-21 |
-5 |
79 |
|
72 |
|
78 |
93 |
78 |
53 |
63 |
34 |
|
New York |
-18 |
0 |
72 |
|
61 |
|
66 |
95 |
75 |
58 |
68 |
35 |
|
Rochester |
-21 |
-5 |
81 |
|
73 |
|
79 |
95 |
80 |
50 |
60 |
35 |
North Carolina |
Asheville |
-18 |
0 |
82 |
|
59 |
|
69 |
93 |
88 |
56 |
73 |
34 |
|
Raleigh |
-12 |
10 |
82 |
|
57 |
|
69 |
95 |
86 |
55 |
72 |
35 |
North Dakota |
Bismarck |
-34 |
-30 |
77 |
|
71 |
|
75 |
95 |
85 |
52 |
49 |
35 |
Ohio |
Cincinnati |
-18 |
0 |
82 |
|
70 |
|
74 |
95 |
84 |
52 |
60 |
35 |
|
Cleveland |
-18 |
0 |
81 |
|
72 |
|
79 |
95 |
79 |
52 |
58 |
35 |
|
Columbus |
-23 |
-10 |
83 |
|
71 |
|
76 |
95 |
78 |
52 |
60 |
35 |
|
Toledo |
-23 |
-10 |
79 |
|
72 |
|
75 |
95 |
76 |
52 |
59 |
35 |
Oklahoma |
Oklahoma City |
-18 |
0 |
79 |
|
62 |
|
65 |
101 |
80 |
49 |
51 |
38 |
Oregon |
Baker |
-21 |
-5 |
83 |
|
81 |
|
78 |
90 |
69 |
68 |
36 |
32 |
|
Portland |
12 |
10 |
87 |
|
82 |
|
78 |
90 |
86 |
63 |
48 |
32 |
Pennsylvania |
Harrisburg |
-18 |
0 |
72 |
|
49 |
|
65 |
95 |
78 |
51 |
62 |
35 |
|
Philadelphia |
-18 |
0 |
74 |
|
65 |
|
68 |
95 |
78 |
52 |
64 |
35 |
|
Pittsburgh |
-18 |
0 |
77 |
|
67 |
|
63 |
95 |
80 |
52 |
63 |
35 |
|
Scranton |
-21 |
-5 |
80 |
|
67 |
|
-- |
95 |
77 |
50 |
-- |
35 |
Rhode Island |
Providence |
-18 |
0 |
73 |
|
60 |
|
67 |
93 |
79 |
57 |
73 |
34 |
South Carolina |
Charleston |
-9 |
15 |
87 |
|
55 |
|
76 |
95 |
88 |
64 |
82 |
35 |
|
Columbia |
-12 |
10 |
81 |
|
57 |
|
65 |
95 |
83 |
56 |
68 |
35 |
South Dakota |
Huron |
-29 |
-20 |
79 |
|
72 |
|
76 |
95 |
86 |
52 |
49 |
35 |
|
Rapid City |
-29 |
-20 |
71 |
|
69 |
|
67 |
95 |
71 |
42 |
40 |
35 |
Tennessee |
Knoxville |
-18 |
0 |
83 |
|
65 |
|
69 |
95 |
83 |
55 |
66 |
35 |
|
Memphis |
-18 |
0 |
82 |
|
67 |
|
73 |
95 |
85 |
55 |
59 |
35 |
Texas |
Amarillo |
-23 |
-10 |
71 |
|
51 |
|
52 |
100 |
77 |
43 |
42 |
38 |
|
Corpus Christi |
-7 |
20 |
88 |
|
66 |
|
75 |
95 |
93 |
58 |
68 |
35 |
|
Dallas |
-12 |
10 |
81 |
|
62 |
|
62 |
100 |
79 |
50 |
47 |
38 |
|
El Paso |
-12 |
10 |
63 |
|
45 |
|
39 |
100 |
60 |
37 |
30 |
38 |
|
Houston |
-7 |
20 |
85 |
|
66 |
|
73 |
95 |
90 |
58 |
66 |
35 |
|
San Antonio |
-7 |
20 |
82 |
|
60 |
|
59 |
100 |
88 |
49 |
45 |
38 |
Utah |
Salt Lake City |
-23 |
-10 |
80 |
|
71 |
|
72 |
95 |
56 |
27 |
23 |
35 |
Vermont |
Burlington |
-23 |
-10 |
81 |
|
69 |
|
78 |
90 |
76 |
54 |
67 |
32 |
Virginia |
Richmond |
-9 |
15 |
84 |
|
60 |
|
68 |
95 |
81 |
57 |
72 |
35 |
Washington |
Seattle |
-9 |
15 |
86 |
|
80 |
|
74 |
85 |
86 |
63 |
47 |
29 |
|
Walla Walla |
-21 |
-5 |
80 |
|
74 |
|
78 |
95 |
50 |
33 |
22 |
35 |
West Virginia |
Charleston |
-18 |
0 |
79 |
|
64 |
|
70 |
95 |
88 |
53 |
67 |
35 |
|
Parkersburg |
-23 |
-10 |
82 |
|
66 |
|
74 |
95 |
80 |
52 |
65 |
35 |
Wisconsin |
Green Bay |
-26 |
-15 |
75 |
|
68 |
|
73 |
95 |
85 |
58 |
64 |
35 |
|
Milwaukee |
-26 |
-15 |
76 |
|
70 |
|
73 |
95 |
81 |
58 |
64 |
35 |
Wyoming |
Cheyenne |
-26 |
-15 |
59 |
|
48 |
|
55 |
95 |
73 |
36 |
40 |
35 |
Province |
City |
|
|
|
|
|
|
|
|
|
|
|
|
Alberta |
Calgary |
-34 |
-29 |
|
71 |
|
|
87 |
|
34 |
|
31 |
|
|
Edmonton |
-34 |
-29 |
|
75 |
|
|
86 |
|
42 |
|
30 |
|
|
Grande Prairie |
-42 |
-43 |
|
80 |
|
|
84 |
|
38 |
|
29 |
|
|
Lethbridge |
-36 |
-32 |
|
66 |
|
|
91 |
|
30 |
|
33 |
|
|
Medicine Hat |
-34 |
-30 |
|
73 |
|
|
96 |
|
31 |
|
36 |
|
British Columbia |
Estevan Point |
-8 |
17 |
|
84 |
|
|
87 |
|
32 |
|
31 |
|
|
Fort Nelson |
-40 |
-40 |
|
79 |
|
|
94 |
|
32 |
|
34 |
|
|
Penticton |
-18 |
0 |
|
81 |
|
|
85 |
|
44 |
|
29 |
|
|
Prince George |
-38 |
-37 |
|
82 |
|
|
73 |
|
53 |
|
23 |
|
|
Prince Rupert |
-12 |
11 |
|
87 |
|
|
80 |
|
54 |
|
27 |
|
|
Vancouver |
-9 |
15 |
|
87 |
|
|
80 |
|
41 |
|
27 |
|
10-10
Page 17 2008-10-01

Table 4. Design Outdoor Conditions (cont)
|
|
|
|
|
JANUARY |
|
|
|
JULY |
|
|
||
|
|
|
|
Relative Humidity |
|
Relative Humidity |
|
||||||
|
|
|
|
|
|
(% RH) |
|
|
|
(% RH) |
|
|
|
|
|
|
Dry |
7:30 |
|
1:30 |
|
7:30 |
Dry |
7:30 |
1:30 |
7:30 |
|
Province |
City |
°C |
Bulb |
|
|
Bulb |
°C |
||||||
A.M. |
|
P.M. |
|
P.M. |
A.M. |
P.M. |
P.M. |
||||||
|
|
|
°F |
|
|
°F |
|
||||||
|
|
|
|
|
|
|
|
|
|
|
|
||
Manitoba |
Brandon |
-34 |
-29 |
|
|
73 |
|
|
90 |
|
50 |
|
32 |
|
Churchill |
-40 |
-40 |
|
76 |
|
|
79 |
|
57 |
|
26 |
|
|
The Pas |
-37 |
-35 |
|
77 |
|
|
85 |
|
54 |
|
29 |
|
|
Winnipeg |
-34 |
-29 |
|
78 |
|
|
90 |
|
50 |
|
32 |
|
New Brunswick |
Campbellton |
-28 |
-18 |
|
77 |
|
|
87 |
|
54 |
|
31 |
|
|
Fredericton |
-27 |
-16 |
|
72 |
|
|
89 |
|
47 |
|
32 |
|
|
Moncton |
-24 |
-12 |
|
82 |
|
|
88 |
|
52 |
|
31 |
|
|
Saint John |
-24 |
-12 |
|
82 |
|
|
81 |
|
62 |
|
27 |
|
Newfoundland |
Corner Brook |
-23 |
-10 |
|
84 |
|
|
84 |
|
47 |
|
29 |
|
|
Gander |
-21 |
-5 |
|
76 |
|
|
85 |
|
45 |
|
29 |
|
|
Goose Bay |
-32 |
-26 |
|
85 |
|
|
86 |
|
42 |
|
30 |
|
|
St. John’s |
-17 |
1 |
|
|
|
|
|
79 |
|
60 |
|
26 |
N.W.T. |
Frobisher |
-43 |
-45 |
|
77 |
|
|
63 |
|
67 |
|
17 |
|
|
Resolute |
-45 |
-49 |
|
71 |
|
|
54 |
|
81 |
|
12 |
|
|
Yellowknife |
-45 |
-49 |
|
82 |
|
|
78 |
|
50 |
|
26 |
|
Nova Scotia |
Halifax |
-18 |
0 |
|
83 |
|
|
83 |
|
50 |
|
28 |
|
|
Sydney |
-17 |
1 |
|
84 |
|
|
84 |
|
56 |
|
29 |
|
|
Yarmouth |
-15 |
5 |
|
83 |
|
|
76 |
|
70 |
|
24 |
|
Ontario |
Thunder Bay |
-33 |
-27 |
|
80 |
|
|
86 |
|
52 |
|
30 |
|
|
Hamilton |
-18 |
0 |
|
75 |
|
|
91 |
|
52 |
|
33 |
|
|
Kaspuskasing |
-34 |
-30 |
|
79 |
|
|
87 |
|
52 |
|
31 |
|
|
Kingston |
-24 |
-11 |
|
|
|
|
|
85 |
|
69 |
|
29 |
|
Kitchener |
-19 |
-3 |
|
84 |
|
|
88 |
|
58 |
|
31 |
|
|
London |
-18 |
0 |
|
80 |
|
|
90 |
|
53 |
|
32 |
|
|
North Bay |
-29 |
-20 |
|
77 |
|
|
87 |
|
46 |
|
31 |
|
|
Ottawa |
-27 |
-17 |
|
|
|
|
|
90 |
|
50 |
|
32 |
|
Peterborough |
-25 |
-13 |
|
77 |
|
|
90 |
|
53 |
|
32 |
|
|
Sioux Lookout |
-36 |
-33 |
|
78 |
|
|
65 |
|
69 |
|
18 |
|
|
Sudbury |
-29 |
-20 |
|
81 |
|
|
89 |
|
44 |
|
32 |
|
|
Timmins |
-36 |
-33 |
|
79 |
|
|
90 |
|
45 |
|
32 |
|
|
Toronto |
-19 |
-3 |
|
82 |
|
|
90 |
|
56 |
|
32 |
|
|
Windsor |
-16 |
-3 |
|
|
|
|
|
92 |
|
51 |
|
31 |
|
Sault St. Marie |
-29 |
-20 |
|
|
|
|
|
88 |
|
48 |
|
29 |
P.E.I. |
Charlottetown |
-21 |
-6 |
|
86 |
|
|
84 |
|
57 |
|
29 |
|
Quebec |
Knob Lake |
-40 |
-40 |
|
79 |
|
|
55 |
|
70 |
|
13 |
|
|
Mont Joli |
-24 |
-11 |
|
75 |
|
|
62 |
|
71 |
|
17 |
|
|
Montreal |
-27 |
-16 |
|
76 |
|
|
88 |
|
58 |
|
31 |
|
|
Port Harrison |
-39 |
-39 |
|
|
|
86 |
|
60 |
|
30 |
||
|
Quebec City |
-28 |
-19 |
|
81 |
|
|
|
|
||||
|
Sept-Iles |
-33 |
-27 |
|
|
|
|
|
80 |
|
47 |
|
27 |
|
Sherbrooke |
-28 |
-18 |
|
|
|
|
|
87 |
|
58 |
|
31 |
|
Trois Rivieres |
-28 |
-18 |
|
|
|
|
|
88 |
|
58 |
|
31 |
Saskatchewan |
Prince Albert |
-41 |
-41 |
|
77 |
|
|
88 |
|
|
|
31 |
|
|
Regina |
-37 |
-34 |
|
81 |
|
|
92 |
|
|
|
33 |
|
|
Saskatoon |
-37 |
-34 |
|
76 |
|
|
90 |
|
|
|
32 |
|
|
Swift Current |
-34 |
-29 |
|
79 |
|
|
93 |
|
|
|
34 |
|
Yukon Territory |
Dawson |
-49 |
-56 |
|
76 |
|
|
57 |
|
60 |
|
14 |
|
|
Whitehorse |
-43 |
-45 |
|
80 |
|
|
78 |
|
40 |
|
26 |
|
10-10
Page 18 2008-10-01

(3)Using the natural ventilation method requires knowing the volume of the humidified space and the type of construction. A tightly constructed building will have a least one air change per hour. A loosely constructed building will have at least one and one half changes per hour, and this same building with a large a amount of incoming or exiting traffic will have at least two air changes per hour.
(a)Formula 3
Assume our print shop has a floor area of 100' x 100' with a 20' ceiling with a large amount of traffic. This requires
100' x 100' x 20' x 2 = 400,000 ft3/hr.
Using our example, the moisture required is
400,000 x 5.08
_______________ = 290 lbs/hr
7000 grains/lb
(4)Using make-up air:
(a)Formula 4
Assume our print shop has a 15,000 CFM HVAC system and uses 10% make-up air during winter. The amount of outside make-up air entering the HVAC system will, therefore, be 10% of 15,000 CFM = 1,500 CFM. The moisture required will be
1,500 x 5.08 x 60 min/hr
_________________________ = 65 lbs/hr
7,000 grains/lb (Refer to Figure 1.)
Figure 1. Schematic of a Typical Print Shop HVAC System
10-10
Page 19 2008-10-01

(5)Using an exhaust air fan:
(a)Formula 5
Assume the print shop has a 1,000 CFM fan to exhaust a drying room. The moisture required to humidify the drying room only is
1,000 x 5.08 x 60 min/hr
_________________________ = 44 lbs/hr
7,000 grains/lb (Refer to Figure 1.)
(6)Using an economizer cycle:
(a)Care should be taken in sizing humidification load when an economizer cycle is incorporated into a building HVAC system. The purpose of an economizer cycle is to provide building cooling using outside air, rather then the building refrigeration system when outside air conditions permit.
(b)The economizer cycle senses and compares outdoor air temperature and return air temperature during the cooling season.
(c)When the HVAC system calls for cooling and the outdoor air temperature is low enough – typically 55°F or lower – the outside air and exhaust air dampers are positioned to provide the required supply air temperature to maintain cooling, and the recirculated air damper is positioned to maintain the required supply air volume. When the outdoor air temperature is higher than the supply air temperature required to maintain cooling but is lower than the return air temperature, the make-up air and exhaust air dampers are 100% open. The recirculation air damper closes, and the building refrigeration system provides the portion of cooling load that cannot be provided by outside air intake.
(d)From this it can be seen that it is possible to introduce 100% outside air into a building during the cooling season.
(e)Formula 6
For example, if out print shop were using 100% outdoor air at 55°F and 40% rh, then the moisture required is
5.19 - (4.89 x 40% rh) = 3.23 gr/ft3
Therefore, on a 15,000 CFM system, the humidification load will be
15,000 x 3.23 x 60 min/hr
__________________________= 415 lbs/hr
7,000 grains/lb
(f)In the above examples, the largest humidification load was due to the economizer cycle at 415 lbs/hr.
(7)Using cooling or refrigeration loads:
(a)As air is cooled, it loses it’s ability to hold moisture. If it is cooled enough, some of the moisture will condense out. This is known as cooling load. Cooling load calculations can be important for process applications or refrigeration applications to product dehydration.
10-10
Page 20 2008-10-01

(b) Formula 7
Assume that during the summer the HVAC system is in the cooling mode. The air leaving the cooling coil is at 55°F and 90% rh. In order to maintain the desired 47% rh in the space, moisture must be added using the following formula:
Desired space 80°F 47% rh= 5.19 gr/ft3 (Formula 1)
55°F 90% = 4.89 x 0.90 |
3 |
|
= 4.40 gr/ft |
||
Grains to add |
= 0.79 gr/ft3 |
|
15,000 x 0.79 x 60 min/hr |
= 101.57 lbs/hr |
|
7,000 grains/lb |
||
|
(8)In considering Process and Environment, in Tables 5 through 7 you will find conditions and processes that may affect your calculation and should be addressed.
(a)Table 5 shows the outdoor temperature at which the rh would cause condensation on the windows to the outside. Should your outdoor conditions make this a possibility, an outdoor setback sensor may be a solution.
(b)Table 6 describes the moisture gain of various material and if your process or environment includes a great amount of these materials that are constantly introduced to the area, its affects must be considered.
(c)Table 7 identifies many recommended indoor conditions for various locations and processes, these can be of use when deciding what conditions would be most beneficial in your application.
(d)In Figure 2, you will find the ASHRAE physchrometric chart describing the enthalpy of dry air and the effects to and from rh in the air.
Table 5. Inside Relative Humidities At Which Moisture Will Condense On Windows
Outside |
|
Inside Temperature (°F/°C) |
|
|
Outside |
|
Inside Temperature (°F/°C) |
|
||||||||||
Temperature |
|
|
|
Temperature |
|
|
||||||||||||
|
|
|
|
|
|
|
|
|
|
|
|
|
|
|
||||
|
|
|
|
|
|
|
|
|
|
|
|
|
|
|
|
|
|
|
°F |
°C |
60/ |
|
65/ |
70/ |
75/ |
|
80/ |
|
°F |
°C |
60/ |
|
65/ |
70/ |
75/ |
|
80/ |
15.5 |
|
18.3 |
21 |
23.8 |
|
26.6 |
|
15.5 |
|
18.3 |
21 |
23.8 |
|
26.6 |
||||
|
|
|
|
|
|
|
|
|
||||||||||
Single Windows, Still Air |
|
|
|
|
|
Single Windows, Wind |
|
|
|
|
|
|
||||||
|
|
|
|
|
|
|
|
|
|
|
|
|
|
|
|
|
|
|
-50 |
-45 |
9 |
|
9 |
9 |
8 |
|
8 |
|
-50 |
-45 |
4 |
|
3 |
3 |
3 |
|
2 |
|
|
|
|
|
|
|
|
|
|
|
|
|
|
|
|
|
|
|
-40 |
-40 |
12 |
|
12 |
11 |
10 |
|
10 |
|
-40 |
-40 |
5 |
|
4 |
4 |
4 |
|
3 |
|
|
|
|
|
|
|
|
|
|
|
|
|
|
|
|
|
|
|
-30 |
-34 |
16 |
|
14 |
14 |
13 |
|
13 |
|
-30 |
-34 |
7 |
|
6 |
6 |
6 |
|
5 |
|
|
|
|
|
|
|
|
|
|
|
|
|
|
|
|
|
|
|
-20 |
-29 |
20 |
|
18 |
18 |
17 |
|
16 |
|
-20 |
-29 |
10 |
|
9 |
9 |
8 |
|
7 |
|
|
|
|
|
|
|
|
|
|
|
|
|
|
|
|
|
|
|
-10 |
-23 |
25 |
|
23 |
22 |
21 |
|
20 |
|
-10 |
-23 |
14 |
|
13 |
12 |
11 |
|
10 |
|
|
|
|
|
|
|
|
|
|
|
|
|
|
|
|
|
|
|
0 |
-18 |
32 |
|
29 |
27 |
25 |
|
24 |
|
0 |
-18 |
20 |
|
18 |
16 |
15 |
|
13 |
|
|
|
|
|
|
|
|
|
|
|
|
|
|
|
|
|
|
|
10 |
-12 |
39 |
|
36 |
33 |
31 |
|
29 |
|
10 |
-12 |
28 |
|
24 |
22 |
20 |
|
18 |
|
|
|
|
|
|
|
|
|
|
|
|
|
|
|
|
|
|
|
20 |
-7 |
47 |
|
43 |
40 |
37 |
|
35 |
|
20 |
-7 |
36 |
|
32 |
30 |
26 |
|
24 |
|
|
|
|
|
|
|
|
|
|
|
|
|
|
|
|
|
|
|
30 |
-1 |
57 |
|
52 |
50 |
45 |
|
42 |
|
30 |
-1 |
48 |
|
41 |
38 |
34 |
|
30 |
|
|
|
|
|
|
|
|
|
|
|
|
|
|
|
|
|
|
|
40 |
4 |
70 |
|
63 |
60 |
53 |
|
50 |
|
40 |
4 |
62 |
|
54 |
49 |
43 |
|
40 |
|
|
|
|
|
|
|
|
|
|
|
|
|
|
|
|
|
|
|
NOTE: Bold areas indicate that moisture will be in the form of frost on windows.
10-10
Page 21 2008-10-01

Table 5. Inside Relative Humidities At Which Moisture Will Condense On Windows (cont)
Outside |
|
Inside Temperature (°F/°C) |
|
|
Outside |
|
Inside Temperature (°F/°C) |
|
||||||||||
Temperature |
|
|
|
Temperature |
|
|
||||||||||||
|
|
|
|
|
|
|
|
|
|
|
|
|
|
|
||||
|
|
|
|
|
|
|
|
|
|
|
|
|
|
|
|
|
|
|
°F |
°C |
60/ |
|
65/ |
70/ |
75/ |
|
80/ |
|
°F |
°C |
60/ |
|
65/ |
70/ |
75/ |
|
80/ |
15.5 |
|
18.3 |
21 |
23.8 |
|
26.6 |
|
15.5 |
|
18.3 |
21 |
23.8 |
|
26.6 |
||||
|
|
|
|
|
|
|
|
|
||||||||||
Double |
Windows, |
Still Air |
|
|
|
|
|
Double Windows, Wind |
|
|
|
|
||||||
|
|
|
|
|
|
|
|
|
|
|
|
|
|
|
|
|
|
|
-50 |
-45 |
34 |
|
34 |
34 |
33 |
|
32 |
|
-50 |
-45 |
23 |
|
26 |
26 |
26 |
|
25 |
|
|
|
|
|
|
|
|
|
|
|
|
|
|
|
|
|
|
|
-40 |
-40 |
38 |
|
38 |
36 |
36 |
|
35 |
|
-40 |
-40 |
32 |
|
30 |
30 |
29 |
|
28 |
|
|
|
|
|
|
|
|
|
|
|
|
|
|
|
|
|
|
|
-30 |
-34 |
42 |
|
42 |
41 |
40 |
|
38 |
|
-30 |
-34 |
36 |
|
34 |
34 |
32 |
|
31 |
|
|
|
|
|
|
|
|
|
|
|
|
|
|
|
|
|
|
|
-20 |
-29 |
47 |
|
46 |
46 |
44 |
|
42 |
|
-20 |
-29 |
41 |
|
39 |
38 |
35 |
|
35 |
|
|
|
|
|
|
|
|
|
|
|
|
|
|
|
|
|
|
|
-10 |
-23 |
52 |
|
50 |
49 |
48 |
|
46 |
|
-10 |
-23 |
46 |
|
45 |
42 |
42 |
|
39 |
|
|
|
|
|
|
|
|
|
|
|
|
|
|
|
|
|
|
|
0 |
-18 |
57 |
|
55 |
55 |
52 |
|
50 |
|
0 |
-18 |
52 |
|
49 |
47 |
46 |
|
44 |
|
|
|
|
|
|
|
|
|
|
|
|
|
|
|
|
|
|
|
10 |
-12 |
62 |
|
60 |
59 |
57 |
|
54 |
|
10 |
-12 |
58 |
|
56 |
53 |
52 |
|
49 |
|
|
|
|
|
|
|
|
|
|
|
|
|
|
|
|
|
|
|
20 |
-7 |
69 |
|
66 |
63 |
62 |
|
59 |
|
20 |
-7 |
65 |
|
63 |
59 |
58 |
|
54 |
|
|
|
|
|
|
|
|
|
|
|
|
|
|
|
|
|
|
|
30 |
-1 |
76 |
|
73 |
71 |
68 |
|
65 |
|
30 |
-1 |
72 |
|
70 |
66 |
64 |
|
60 |
|
|
|
|
|
|
|
|
|
|
|
|
|
|
|
|
|
|
|
40 |
4 |
84 |
|
80 |
79 |
74 |
|
71 |
|
40 |
4 |
80 |
|
78 |
73 |
70 |
|
67 |
|
|
|
|
|
|
|
|
|
|
|
|
|
|
|
|
|
|
|
NOTE: Bold areas indicate that moisture will be in the form of frost on windows.
Table 6. Regain of Hygroscopic Materials
Industry |
Materials |
|
|
|
Relative Humidity - % |
|
|
|
||||
10 |
20 |
30 |
|
40 |
50 |
60 |
|
70 |
80 |
90 |
||
|
|
|
|
|||||||||
Baking |
Crackers |
2.1 |
2.8 |
3.3 |
|
3.9 |
5.0 |
6.5 |
|
8.3 |
10.9 |
14.9 |
|
Flour |
2.6 |
4.1 |
5.3 |
|
6.5 |
8.0 |
9.9 |
|
12.4 |
15.4 |
19.1 |
|
White Bread |
0.5 |
1.7 |
3.1 |
|
4.5 |
6.2 |
8.5 |
|
11.1 |
14.5 |
19.0 |
Leather |
Sole Oak, Tanned |
5.0 |
8.5 |
11.2 |
|
13.6 |
16.0 |
18.3 |
|
20.6 |
24.0 |
29.2 |
|
|
|
|
|
|
|
|
|
|
|
|
|
Printing |
Paper – Comm. Ledger – 75% Rag |
3.2 |
4.2 |
5.0 |
|
5.6 |
6.2 |
6.9 |
|
8.1 |
10.3 |
13.9 |
|
1% Ash |
|
|
|
|
|
|
|
|
|
|
|
|
Paper M.F. Newsprint – 24% Ash |
2.1 |
3.2 |
4.0 |
|
4.7 |
6.1 |
7.2 |
|
8.7 |
10.6 |
|
|
Paper White Bond Rag – 1% Ash |
2.4 |
3.7 |
4.7 |
|
5.5 |
6.5 |
7.5 |
|
8.8 |
10.8 |
13.2 |
|
Paper Writing – 3% Ash |
3.0 |
4.2 |
5.2 |
|
6.2 |
7.2 |
8.3 |
|
9.9 |
11.9 |
14.2 |
Textile |
Cotton – Absorbent |
4.8 |
9.0 |
12.5 |
|
15.7 |
18.5 |
20.8 |
|
22.8 |
24.3 |
25.8 |
|
Cotton – American-cloth |
2.6 |
3.7 |
4.4 |
|
5.2 |
5.9 |
6.8 |
|
8.1 |
10.0 |
14.3 |
|
Cotton – Sea Isle-roving |
2.5 |
3.7 |
4.6 |
|
5.6 |
6.6 |
7.9 |
|
9.5 |
11.5 |
14.1 |
|
Hemp – Manila and Sisal |
2.7 |
4.7 |
6.0 |
|
7.2 |
8.5 |
9.9 |
|
11.6 |
13.6 |
15.7 |
|
Jute – Average Grade |
3.1 |
5.2 |
6.9 |
|
8.5 |
10.2 |
12.2 |
|
14.4 |
17.1 |
20.2 |
|
Linen – Dried Spun – Yarn |
3.6 |
5.4 |
6.5 |
|
7.3 |
8.1 |
8.9 |
|
9.8 |
11.2 |
13.8 |
|
Rayon – Celulose – Acetate – Fibre |
0.8 |
1.1 |
1.4 |
|
1.9 |
2.4 |
3.0 |
|
3.6 |
4.3 |
5.3 |
|
Rayon – Cupramonium – Average |
4.0 |
5.7 |
6.8 |
|
7.9 |
9.2 |
10.8 |
|
12.4 |
14.2 |
10.0 |
|
Skein |
|
|
|
|
|
|
|
|
|
|
|
|
Rayon – Viscose Nitrocel |
4.0 |
5.7 |
6.8 |
|
7.9 |
9.2 |
10.8 |
|
12.4 |
14.2 |
16.0 |
|
Silk – Raw Chevennes-Skein |
3.2 |
5.5 |
6.9 |
|
8.0 |
8.9 |
10.2 |
|
11.9 |
14.3 |
18.8 |
|
Wool – Australian-Marino-Skein |
4.7 |
7.0 |
8.9 |
|
10.8 |
12.8 |
14.9 |
|
17.2 |
19.9 |
23.4 |
|
|
|
|
|
|
|
|
|
|
|
|
|
Tobacco |
Cigarette |
5.4 |
8.6 |
11.0 |
|
13.3 |
16.0 |
19.5 |
|
25.0 |
33.5 |
50.0 |
|
|
|
|
|
|
|
|
|
|
|
|
|
Wood |
Timber – Average |
3.0 |
4.4 |
5.9 |
|
7.6 |
9.3 |
11.3 |
|
14.0 |
17.5 |
22.0 |
|
Glue – Hide |
3.4 |
4.8 |
5.8 |
|
6.6 |
7.6 |
9.0 |
|
10.7 |
11.8 |
12.5 |
Miscellaneous |
Charcoal-Steam Activated |
7.1 |
14.3 |
22.8 |
|
26.2 |
28.3 |
29.2 |
|
30.0 |
31.1 |
32.7 |
|
Gelatin |
0.7 |
1.6 |
2.8 |
|
3.8 |
4.9 |
6.1 |
|
7.6 |
9.3 |
11.4 |
|
Silica Gel |
5.7 |
9.8 |
12.7 |
|
15.2 |
17.2 |
18.6 |
|
20.2 |
21.5 |
22.6 |
|
Soap |
1.9 |
3.8 |
5.7 |
|
7.6 |
10.0 |
12.9 |
|
16.1 |
19.8 |
23.8 |
|
Starch |
2.2 |
3.8 |
5.2 |
|
6.4 |
7.4 |
8.3 |
|
9.2 |
10.6 |
12.7 |
NOTE: Moisture content expressed in per cent of dry weight of the substance at various relative humidities – Temperature 75°F.
10-10
Page 22 2008-10-01
 Loading...