


CAPITALISM II

TM
User Manual
Contents
Chapter 1: Installation . . . . . . . . . . . . . . . . . . . . . . . . . . . . . . . . . .7
Minimum System Requirements . . . . . . . . . . . . . . . . . . . . . . . . . . . . . . . . . . . . . . . . . . . . .7
Recommended System Requirements . . . . . . . . . . . . . . . . . . . . . . . . . . . . . . . . . . . . . . . .7
Requirements for Multiplayer . . . . . . . . . . . . . . . . . . . . . . . . . . . . . . . . . . . . . . . . . . . . . . .7
Using the Mouse . . . . . . . . . . . . . . . . . . . . . . . . . . . . . . . . . . . . . . . . . . . . . . . . . . . . . . . . . .8
Chapter 2: Getting Started . . . . . . . . . . . . . . . . . . . . . . . . . . . . . . .9
Single Player Game . . . . . . . . . . . . . . . . . . . . . . . . . . . . . . . . . . . . . . . . . . . . . . . . . . . . . . .9
Click the ENVIRONMENT tab1 . . . . . . . . . . . . . . . . . . . . . . . . . . . . . . . . . . . . . . . . . . . . . . . . . . . . . . . .11
Click the COMPETITORS tab . . . . . . . . . . . . . . . . . . . . . . . . . . . . . . . . . . . . . . . . . . . . . . . . . . . . . . . . . .12
Click the IMPORTS tab . . . . . . . . . . . . . . . . . . . . . . . . . . . . . . . . . . . . . . . . . . . . . . . . . . . . . . . . . . . . . . .12
Click the GOALS tab . . . . . . . . . . . . . . . . . . . . . . . . . . . . . . . . . . . . . . . . . . . . . . . . . . . . . . . . . . . . . . . . .12
Multi-Player Game . . . . . . . . . . . . . . . . . . . . . . . . . . . . . . . . . . . . . . . . . . . . . . . . . . . . . . . .13
Step 1: Starting a Multi-player Game WITHOUT Ubi.com . . . . . . . . . . . . . . . . . . . . . . . . . . . . . . . . . .13
Step 1: Starting a Multi-player Game WITH Ubi.com . . . . . . . . . . . . . . . . . . . . . . . . . . . . . . . . . . . . . .14
Step 2: Setting Up the Multi-player Game . . . . . . . . . . . . . . . . . . . . . . . . . . . . . . . . . . . . . . . . . . . . . . .14
Chatting with Other Players . . . . . . . . . . . . . . . . . . . . . . . . . . . . . . . . . . . . . . . . . . . . . . . . . . . . . . . . . . .15
Winning or Losing . . . . . . . . . . . . . . . . . . . . . . . . . . . . . . . . . . . . . . . . . . . . . . . . . . . . . . . . .15
Single Player Game - Campaign Game . . . . . . . . . . . . . . . . . . . . . . . . . . . . . . . . . . . . . . . . . . . . . . . . .15
Single Player Game - Custom Game . . . . . . . . . . . . . . . . . . . . . . . . . . . . . . . . . . . . . . . . . . . . . . . . . . . .15
Multi-Player Game . . . . . . . . . . . . . . . . . . . . . . . . . . . . . . . . . . . . . . . . . . . . . . . . . . . . . . . . . . . . . . . . . .15
News Features of Capitalism II . . . . . . . . . . . . . . . . . . . . . . . . . . . . . . . . . . . . . . . . . . . . . .16

Chapter 3: Game View . . . . . . . . . . . . . . . . . . . . . . . . . . . . . . . . . .18
The Toolbar . . . . . . . . . . . . . . . . . . . . . . . . . . . . . . . . . . . . . . . . . . . . . . . . . . . . . . . . . . . . . .18
Game Tools . . . . . . . . . . . . . . . . . . . . . . . . . . . . . . . . . . . . . . . . . . . . . . . . . . . . . . . . . . . . . . . . . . . . . . . .18
Mini Map . . . . . . . . . . . . . . . . . . . . . . . . . . . . . . . . . . . . . . . . . . . . . . . . . . . . . . . . . . . . . . . . . . . . . . . . . .19
World Map . . . . . . . . . . . . . . . . . . . . . . . . . . . . . . . . . . . . . . . . . . . . . . . . . . . . . . . . . . . . . . . . . . . . . . . . .20
Information . . . . . . . . . . . . . . . . . . . . . . . . . . . . . . . . . . . . . . . . . . . . . . . . . . . . . . . . . . . . . . . . . . . . . . . .20
Back . . . . . . . . . . . . . . . . . . . . . . . . . . . . . . . . . . . . . . . . . . . . . . . . . . . . . . . . . . . . . . . . . . . . . . . . . . . . . .20
Cash & Profit . . . . . . . . . . . . . . . . . . . . . . . . . . . . . . . . . . . . . . . . . . . . . . . . . . . . . . . . . . . . . . . . . . . . . . .21
Profit/Loss . . . . . . . . . . . . . . . . . . . . . . . . . . . . . . . . . . . . . . . . . . . . . . . . . . . . . . . . . . . . . . . . . . . . . . . . .21
Date . . . . . . . . . . . . . . . . . . . . . . . . . . . . . . . . . . . . . . . . . . . . . . . . . . . . . . . . . . . . . . . . . . . . . . . . . . . . . .21
Understanding a Firm . . . . . . . . . . . . . . . . . . . . . . . . . . . . . . . . . . . . . . . . . . . . . . . .21
Layout Section . . . . . . . . . . . . . . . . . . . . . . . . . . . . . . . . . . . . . . . . . . . . . . . . . . . . . . . . . . . . . . . . . . . . . . . .22
Staff Training . . . . . . . . . . . . . . . . . . . . . . . . . . . . . . . . . . . . . . . . . . . . . . . . . . . . . . . . . . . . . . . . . . . . . . . . .23
Firm Financial Report . . . . . . . . . . . . . . . . . . . . . . . . . . . . . . . . . . . . . . . . . . . . . . . . . . . . . . . . . . . . . . . . . . .25
Complex City Economy . . . . . . . . . . . . . . . . . . . . . . . . . . . . . . . . . . . . . . . . . . . . . . .29
Chapter 4: Firms, Units and Buildings . . . . . . . . . . . . . . . . . . . . .31
Common units . . . . . . . . . . . . . . . . . . . . . . . . . . . . . . . . . . . . . . . . . . . . . . . . . . . . . . .31
Advertising Unit . . . . . . . . . . . . . . . . . . . . . . . . . . . . . . . . . . . . . . . . . . . . . . . . . . . . . . . . . . . . . . . . . . . . . . .31
Inventory Unit . . . . . . . . . . . . . . . . . . . . . . . . . . . . . . . . . . . . . . . . . . . . . . . . . . . . . . . . . . . . . . . . . . . . . . . . .33
Purchasing Unit . . . . . . . . . . . . . . . . . . . . . . . . . . . . . . . . . . . . . . . . . . . . . . . . . . . . . . . . . . . . . . . . . . . . . . .35
Sales Unit . . . . . . . . . . . . . . . . . . . . . . . . . . . . . . . . . . . . . . . . . . . . . . . . . . . . . . . . . . . . . . . . . . . . . . . . . . . .39
Firms . . . . . . . . . . . . . . . . . . . . . . . . . . . . . . . . . . . . . . . . . . . . . . . . . . . . . . . . . . . . . .42
Retail Store . . . . . . . . . . . . . . . . . . . . . . . . . . . . . . . . . . . . . . . . . . . . . . . . . . . . . . . . . . . . . . . . . . . . . . . .42
Private Labelling Unit . . . . . . . . . . . . . . . . . . . . . . . . . . . . . . . . . . . . . . . . . . . . . . . . . . . . . . . . . . . . . . . .44
Manufacturing Unit . . . . . . . . . . . . . . . . . . . . . . . . . . . . . . . . . . . . . . . . . . . . . . . . . . . . . . . . . . . . . . . . .47
Research & Development (R&D) . . . . . . . . . . . . . . . . . . . . . . . . . . . . . . . . . . . . . . . . . . . . .53
Starting an R&D project . . . . . . . . . . . . . . . . . . . . . . . . . . . . . . . . . . . . . . . . . . . . . . . . . . . . . . . . . . . . . .53
Technology Advancement . . . . . . . . . . . . . . . . . . . . . . . . . . . . . . . . . . . . . . . . . . . . . . . . . . . . . . . . . . . .54
Purchasing Technology from other corporations . . . . . . . . . . . . . . . . . . . . . . . . . . . . . . . . . . . . . . . . .57
Farm . . . . . . . . . . . . . . . . . . . . . . . . . . . . . . . . . . . . . . . . . . . . . . . . . . . . . . . . . . . . . . . . . . . .57
Crop Growing Unit . . . . . . . . . . . . . . . . . . . . . . . . . . . . . . . . . . . . . . . . . . . . . . . . . . . . . . . . . . . . . . . . . .58
Livestock Raising Unit . . . . . . . . . . . . . . . . . . . . . . . . . . . . . . . . . . . . . . . . . . . . . . . . . . . . . . . . . . . . . . .59
Livestock Processing Unit . . . . . . . . . . . . . . . . . . . . . . . . . . . . . . . . . . . . . . . . . . . . . . . . . . . . . . . . . . . .61
Mine, Oil Well and Logging Camps . . . . . . . . . . . . . . . . . . . . . . . . . . . . . . . . . . . . . . . . . .63
Selling & Buying Firms . . . . . . . . . . . . . . . . . . . . . . . . . . . . . . . . . . . . . . . . . . . . . . . . . . . . .65
Putting a firm on the market . . . . . . . . . . . . . . . . . . . . . . . . . . . . . . . . . . . . . . . . . . . . . . . . . . . . . . . . . .65
Receiving an Offer to Purchase . . . . . . . . . . . . . . . . . . . . . . . . . . . . . . . . . . . . . . . . . . . . . . . . . . . . . . .65
Placing an Offer to Buy a Firm . . . . . . . . . . . . . . . . . . . . . . . . . . . . . . . . . . . . . . . . . . . . . . . . . . . . . . . .66
Looking for Firms to Buy . . . . . . . . . . . . . . . . . . . . . . . . . . . . . . . . . . . . . . . . . . . . . . . . . . . . . . . . . . . . .66
Apartment Buildings . . . . . . . . . . . . . . . . . . . . . . . . . . . . . . . . . . . . . . . . . . . . . . . . . . . . . . .66
Commercial Buildings . . . . . . . . . . . . . . . . . . . . . . . . . . . . . . . . . . . . . . . . . . . . . . . . . . . . .6 7
Headquarters . . . . . . . . . . . . . . . . . . . . . . . . . . . . . . . . . . . . . . . . . . . . . . . . . . . . . . . . . . . . .67
HQ Unit Types . . . . . . . . . . . . . . . . . . . . . . . . . . . . . . . . . . . . . . . . . . . . . . . . . . . . . . . . . . . .68
Financial Department . . . . . . . . . . . . . . . . . . . . . . . . . . . . . . . . . . . . . . . . . . . . . . . . . . . . . . . . . . . . . . . .68
Human Resource Department . . . . . . . . . . . . . . . . . . . . . . . . . . . . . . . . . . . . . . . . . . . . . . . . . . . . . . . . .68
Public Relations Department . . . . . . . . . . . . . . . . . . . . . . . . . . . . . . . . . . . . . . . . . . . . . . . . . . . . . . . . . .68
Investor Relations Department . . . . . . . . . . . . . . . . . . . . . . . . . . . . . . . . . . . . . . . . . . . . . . . . . . . . . . . .69
Chief Executive Officer Office . . . . . . . . . . . . . . . . . . . . . . . . . . . . . . . . . . . . . . . . . . . . . . . . . . . . . . . . .69
Chief Operating Officer Office . . . . . . . . . . . . . . . . . . . . . . . . . . . . . . . . . . . . . . . . . . . . . . . . . . . . . . . . .69
Chief Marketing Officer Office . . . . . . . . . . . . . . . . . . . . . . . . . . . . . . . . . . . . . . . . . . . . . . . . . . . . . . . .70
Chief Technical Officer Office . . . . . . . . . . . . . . . . . . . . . . . . . . . . . . . . . . . . . . . . . . . . . . . . . . . . . . . . .70
Mansion . . . . . . . . . . . . . . . . . . . . . . . . . . . . . . . . . . . . . . . . . . . . . . . . . . . . . . . . . . . . . . . . .70
Radio Station, Television Station and
Newspaper Publisher . . . . . . . . . . . . . . . . . . . . . . . . . . . . . . . . . . . . . . . . . . . . . . . . . . . . . .71
Firm Details . . . . . . . . . . . . . . . . . . . . . . . . . . . . . . . . . . . . . . . . . . . . . . . . . . . . . . . . . . . . . . . . . . . . . . . .71
To purchase a media firm . . . . . . . . . . . . . . . . . . . . . . . . . . . . . . . . . . . . . . . . . . . . . . . . . . . . . . . . . . . .72
Buildings . . . . . . . . . . . . . . . . . . . . . . . . . . . . . . . . . . . . . . . . . . . . . . . . . . . . . . . . . . .73
Bank . . . . . . . . . . . . . . . . . . . . . . . . . . . . . . . . . . . . . . . . . . . . . . . . . . . . . . . . . . . . . . . . . . . .73
Information Center . . . . . . . . . . . . . . . . . . . . . . . . . . . . . . . . . . . . . . . . . . . . . . . . . . . . . . . .73
Investment Bank . . . . . . . . . . . . . . . . . . . . . . . . . . . . . . . . . . . . . . . . . . . . . . . . . . . . . . . . . .73
Stock Market . . . . . . . . . . . . . . . . . . . . . . . . . . . . . . . . . . . . . . . . . . . . . . . . . . . . . . . . . . . . .73
Chapter 5: Reports and Guides . . . . . . . . . . . . . . . . . . . . . . . . . . .74
Product Summary Report . . . . . . . . . . . . . . . . . . . . . . . . . . . . . . . . . . . . . . . . . . . . . . . . . . . . . . .74
Product Information . . . . . . . . . . . . . . . . . . . . . . . . . . . . . . . . . . . . . . . . . . . . . . . . . . . . . . . . . . . . . . . . .74
Display Filter . . . . . . . . . . . . . . . . . . . . . . . . . . . . . . . . . . . . . . . . . . . . . . . . . . . . . . . . . . . . . . . . . . . . . . .75
Product Detail Report . . . . . . . . . . . . . . . . . . . . . . . . . . . . . . . . . . . . . . . . . . . . . . . . . . . . . . . . . .76
Necessity Index . . . . . . . . . . . . . . . . . . . . . . . . . . . . . . . . . . . . . . . . . . . . . . . . . . . . . . . . . . . . . . . . . . . .77
Product Browser . . . . . . . . . . . . . . . . . . . . . . . . . . . . . . . . . . . . . . . . . . . . . . . . . . . . . . . . . . . . . . . . . . .77
Changing Selling Price . . . . . . . . . . . . . . . . . . . . . . . . . . . . . . . . . . . . . . . . . . . . . . . . . . . . . . . . . . . . . . .78
Prev and Next Button . . . . . . . . . . . . . . . . . . . . . . . . . . . . . . . . . . . . . . . . . . . . . . . . . . . . . . . . . . . . . . . .78
Go Button . . . . . . . . . . . . . . . . . . . . . . . . . . . . . . . . . . . . . . . . . . . . . . . . . . . . . . . . . . . . . . . . . . . . . . . . . .78
Firm Summary Report . . . . . . . . . . . . . . . . . . . . . . . . . . . . . . . . . . . . . . . . . . . . . . . .78
Corporate Summary Report . . . . . . . . . . . . . . . . . . . . . . . . . . . . . . . . . . . . . . . . . . . .80
Financial Overview . . . . . . . . . . . . . . . . . . . . . . . . . . . . . . . . . . . . . . . . . . . . . . . . . . . . . . . . . . . . . . . . . .80
Stock Overview . . . . . . . . . . . . . . . . . . . . . . . . . . . . . . . . . . . . . . . . . . . . . . . . . . . . . . . . . . . . . . . . . . . . .80
Firms Overview . . . . . . . . . . . . . . . . . . . . . . . . . . . . . . . . . . . . . . . . . . . . . . . . . . . . . . . . . . . . . . . . . . . . .81
Business Relations . . . . . . . . . . . . . . . . . . . . . . . . . . . . . . . . . . . . . . . . . . . . . . . . . . . . . . . . . . . . . . . . . .81
Corporate Detail Report . . . . . . . . . . . . . . . . . . . . . . . . . . . . . . . . . . . . . . . . . . . . . .81
Management Overview . . . . . . . . . . . . . . . . . . . . . . . . . . . . . . . . . . . . . . . . . . . . . . . . . . . . . . . . . . . . . .82
Financial Overview and Stock Overview . . . . . . . . . . . . . . . . . . . . . . . . . . . . . . . . . . . . . . . . . . . . . . . .83
Firms Overview . . . . . . . . . . . . . . . . . . . . . . . . . . . . . . . . . . . . . . . . . . . . . . . . . . . . . . . . . . . . . . . . . . . . .83
Firms . . . . . . . . . . . . . . . . . . . . . . . . . . . . . . . . . . . . . . . . . . . . . . . . . . . . . . . . . . . . . . . . . . . .83
Products . . . . . . . . . . . . . . . . . . . . . . . . . . . . . . . . . . . . . . . . . . . . . . . . . . . . . . . . . . . . . . . . .83
Graphs 1 . . . . . . . . . . . . . . . . . . . . . . . . . . . . . . . . . . . . . . . . . . . . . . . . . . . . . . . . . . . . . . . . .84
Graphs 2 . . . . . . . . . . . . . . . . . . . . . . . . . . . . . . . . . . . . . . . . . . . . . . . . . . . . . . . . . . . . . . . . .84
Stock . . . . . . . . . . . . . . . . . . . . . . . . . . . . . . . . . . . . . . . . . . . . . . . . . . . . . . . . . . . . . . . . . . . .85
Balance Sheet . . . . . . . . . . . . . . . . . . . . . . . . . . . . . . . . . . . . . . . . . . . . . . . . . . . . . . . . . . . .85
Income Statement . . . . . . . . . . . . . . . . . . . . . . . . . . . . . . . . . . . . . . . . . . . . . . . . . . . . . . . . .87
Technology . . . . . . . . . . . . . . . . . . . . . . . . . . . . . . . . . . . . . . . . . . . . . . . . . . . . . . . . . . . . . . .88
Advertising . . . . . . . . . . . . . . . . . . . . . . . . . . . . . . . . . . . . . . . . . . . . . . . . . . . . . . . . . . . . . . .89
Brand . . . . . . . . . . . . . . . . . . . . . . . . . . . . . . . . . . . . . . . . . . . . . . . . . . . . . . . . . . . . . . . . . . .89
Dominance . . . . . . . . . . . . . . . . . . . . . . . . . . . . . . . . . . . . . . . . . . . . . . . . . . . . . . . . . . . . . . .90
Statements . . . . . . . . . . . . . . . . . . . . . . . . . . . . . . . . . . . . . . . . . . . . . . . . . . . . . . . . . . . . . .91

Financial Report . . . . . . . . . . . . . . . . . . . . . . . . . . . . . . . . . . . . . . . . . . . . . . . . . . . .93
Person Report . . . . . . . . . . . . . . . . . . . . . . . . . . . . . . . . . . . . . . . . . . . . . . . . . . . . . . .93
Summary . . . . . . . . . . . . . . . . . . . . . . . . . . . . . . . . . . . . . . . . . . . . . . . . . . . . . . . . . . . . . . . . .93
Wealth . . . . . . . . . . . . . . . . . . . . . . . . . . . . . . . . . . . . . . . . . . . . . . . . . . . . . . . . . . . . . . . . . .93
Career . . . . . . . . . . . . . . . . . . . . . . . . . . . . . . . . . . . . . . . . . . . . . . . . . . . . . . . . . . . . . . . . . . .93
Personality . . . . . . . . . . . . . . . . . . . . . . . . . . . . . . . . . . . . . . . . . . . . . . . . . . . . . . . . . . . . . . .93
Expertise . . . . . . . . . . . . . . . . . . . . . . . . . . . . . . . . . . . . . . . . . . . . . . . . . . . . . . . . . . . . . . . .93
Score . . . . . . . . . . . . . . . . . . . . . . . . . . . . . . . . . . . . . . . . . . . . . . . . . . . . . . . . . . . . . . . . . . .93
Goal Report . . . . . . . . . . . . . . . . . . . . . . . . . . . . . . . . . . . . . . . . . . . . . . . . . . . . . . . . .96
Normal Game . . . . . . . . . . . . . . . . . . . . . . . . . . . . . . . . . . . . . . . . . . . . . . . . . . . . . . . . . . . . .97
Campaign Game . . . . . . . . . . . . . . . . . . . . . . . . . . . . . . . . . . . . . . . . . . . . . . . . . . . . . . . . . .97
Score Report . . . . . . . . . . . . . . . . . . . . . . . . . . . . . . . . . . . . . . . . . . . . . . . . . . . . . . . .97
Billionaires 100 . . . . . . . . . . . . . . . . . . . . . . . . . . . . . . . . . . . . . . . . . . . . . . . . . . . . .98
Manufacturer’s Guide . . . . . . . . . . . . . . . . . . . . . . . . . . . . . . . . . . . . . . . . . . . . . . . .98
Farmer’s Guide . . . . . . . . . . . . . . . . . . . . . . . . . . . . . . . . . . . . . . . . . . . . . . . . . . . . . .99
Manager’s Guide . . . . . . . . . . . . . . . . . . . . . . . . . . . . . . . . . . . . . . . . . . . . . . . . . . . .100
Chapter 6: Stock and Finances . . . . . . . . . . . . . . . . . . . . . . . . . . .101
The Stock Market . . . . . . . . . . . . . . . . . . . . . . . . . . . . . . . . . . . . . . . . . . . . . . . . . . . .101
Buying and Selling to the Public . . . . . . . . . . . . . . . . . . . . . . . . . . . . . . . . . . . . . . . . . . . .104
Buying Back Shares . . . . . . . . . . . . . . . . . . . . . . . . . . . . . . . . . . . . . . . . . . . . . . . . . . . . . .104
Tender Offer . . . . . . . . . . . . . . . . . . . . . . . . . . . . . . . . . . . . . . . . . . . . . . . . . . . . . . . . . . . . . .105
Takeover . . . . . . . . . . . . . . . . . . . . . . . . . . . . . . . . . . . . . . . . . . . . . . . . . . . . . . . . . . . . . . . . .106
Merger . . . . . . . . . . . . . . . . . . . . . . . . . . . . . . . . . . . . . . . . . . . . . . . . . . . . . . . . . . . . . . . . . .106
Stock Trading Regulation . . . . . . . . . . . . . . . . . . . . . . . . . . . . . . . . . . . . . . . . . . . . . . . . . . .107
Issuing Shares and Paying Dividend . . . . . . . . . . . . . . . . . . . . . . . . . . . . . . . . . . . .107
Issuing New Shares . . . . . . . . . . . . . . . . . . . . . . . . . . . . . . . . . . . . . . . . . . . . . . . . . . . . . . .107
Paying Dividend . . . . . . . . . . . . . . . . . . . . . . . . . . . . . . . . . . . . . . . . . . . . . . . . . . . . . . . . . .108
Finance . . . . . . . . . . . . . . . . . . . . . . . . . . . . . . . . . . . . . . . . . . . . . . . . . . . . . . . . . . . .109
Borrowing and Repaying . . . . . . . . . . . . . . . . . . . . . . . . . . . . . . . . . . . . . . . . . . . . . . . . . .109
Out of Cash and Bankruptcy . . . . . . . . . . . . . . . . . . . . . . . . . . . . . . . . . . . . . . . . . . . . . . . .109
CHAPTER 7: Marketing . . . . . . . . . . . . . . . . . . . . . . . . . . . . . . . . .111
Overall Rating . . . . . . . . . . . . . . . . . . . . . . . . . . . . . . . . . . . . . . . . . . . . . . . . . . . . . . . . . . . .111
Price, Quality & Brand Concern . . . . . . . . . . . . . . . . . . . . . . . . . . . . . . . . . . . . . . . . . . . . .111
Overall Rating & Product Demand . . . . . . . . . . . . . . . . . . . . . . . . . . . . . . . . . . . . . . . . . . .112
Calculating the Overall Rating . . . . . . . . . . . . . . . . . . . . . . . . . . . . . . . . . . . . . . . . . . . . . .112
Quality . . . . . . . . . . . . . . . . . . . . . . . . . . . . . . . . . . . . . . . . . . . . . . . . . . . . . . . . . . . . . . . . . .112
Manufactured Goods . . . . . . . . . . . . . . . . . . . . . . . . . . . . . . . . . . . . . . . . . . . . . . . . . . . . . .113
Crops . . . . . . . . . . . . . . . . . . . . . . . . . . . . . . . . . . . . . . . . . . . . . . . . . . . . . . . . . . . . . . . . . . . .113
Livestock Products . . . . . . . . . . . . . . . . . . . . . . . . . . . . . . . . . . . . . . . . . . . . . . . . . . . . . . . .113
Raw Materials . . . . . . . . . . . . . . . . . . . . . . . . . . . . . . . . . . . . . . . . . . . . . . . . . . . . . . . . . . . .113
Brand . . . . . . . . . . . . . . . . . . . . . . . . . . . . . . . . . . . . . . . . . . . . . . . . . . . . . . . . . . . . . . . . . . .113
Brand Awareness Level and Rating . . . . . . . . . . . . . . . . . . . . . . . . . . . . . . . . . . . . . . . . . . . . . . . . . . . .114
Increasing Brand Awareness . . . . . . . . . . . . . . . . . . . . . . . . . . . . . . . . . . . . . . . . . . . . . . . . . . . . . . . . .114
Brand Loyalty . . . . . . . . . . . . . . . . . . . . . . . . . . . . . . . . . . . . . . . . . . . . . . . . . . . . . . . . . . . . .114
Brand Loyalty Level and Rating . . . . . . . . . . . . . . . . . . . . . . . . . . . . . . . . . . . . . . . . . . . . . . . . . . . . . . . .114
Brand Loyalty Factors . . . . . . . . . . . . . . . . . . . . . . . . . . . . . . . . . . . . . . . . . . . . . . . . . . . . . . . . . . . . . . .114
Brand Strategy . . . . . . . . . . . . . . . . . . . . . . . . . . . . . . . . . . . . . . . . . . . . . . . . . . . . . . . . . . . .115
Corporate Brand . . . . . . . . . . . . . . . . . . . . . . . . . . . . . . . . . . . . . . . . . . . . . . . . . . . . . . . . . .116
Range Brand . . . . . . . . . . . . . . . . . . . . . . . . . . . . . . . . . . . . . . . . . . . . . . . . . . . . . . . . . . . . .116
Unique Brand . . . . . . . . . . . . . . . . . . . . . . . . . . . . . . . . . . . . . . . . . . . . . . . . . . . . . . . . . . . . .117
Advertising . . . . . . . . . . . . . . . . . . . . . . . . . . . . . . . . . . . . . . . . . . . . . . . . . . . . . . . . . . . . . . .117
Media Concepts . . . . . . . . . . . . . . . . . . . . . . . . . . . . . . . . . . . . . . . . . . . . . . . . . . . . . . . . . .117
Advertising & Product Quality . . . . . . . . . . . . . . . . . . . . . . . . . . . . . . . . . . . . . . . . . . . . . . .117
Local Competitors . . . . . . . . . . . . . . . . . . . . . . . . . . . . . . . . . . . . . . . . . . . . . . . . . . . . . . . . .120
Chapter 8: Personnel Management . . . . . . . . . . . . . . . . . . . . . . .121
Hiring an Officer . . . . . . . . . . . . . . . . . . . . . . . . . . . . . . . . . . . . . . . . . . . . . . . . . . . . .121
Factors that Affect the Expected Salary . . . . . . . . . . . . . . . . . . . . . . . . . . . . . . . . . . . . . . .122
Attitude . . . . . . . . . . . . . . . . . . . . . . . . . . . . . . . . . . . . . . . . . . . . . . . . . . . . . . . . . . . . . . . . .122
Salary Raise Request . . . . . . . . . . . . . . . . . . . . . . . . . . . . . . . . . . . . . . . . . . . . . . . . . . . . . .122
Resignation . . . . . . . . . . . . . . . . . . . . . . . . . . . . . . . . . . . . . . . . . . . . . . . . . . . . . . . . . . . . . .123
Layoff . . . . . . . . . . . . . . . . . . . . . . . . . . . . . . . . . . . . . . . . . . . . . . . . . . . . . . . . . . . . . . . . . . .123
Delegating Firms to your Chief Operating Officer . . . . . . . . . . . . . . . . . . . . . . . . .123
COO’s Responsibilities . . . . . . . . . . . . . . . . . . . . . . . . . . . . . . . . . . . . . . . . . . . . . . .124
Management Policies . . . . . . . . . . . . . . . . . . . . . . . . . . . . . . . . . . . . . . . . . . . . . . . . . . . . .125
Expertise . . . . . . . . . . . . . . . . . . . . . . . . . . . . . . . . . . . . . . . . . . . . . . . . . . . . . . . . . . .126
Delegating Firms to a COO with Expertise . . . . . . . . . . . . . . . . . . . . . . . . . . . . . . . . . . . .127
Delegating R&D Centers . . . . . . . . . . . . . . . . . . . . . . . . . . . . . . . . . . . . . . . . . . . . . . . . . . .127
Personality . . . . . . . . . . . . . . . . . . . . . . . . . . . . . . . . . . . . . . . . . . . . . . . . . . . . . . . . .127
Character . . . . . . . . . . . . . . . . . . . . . . . . . . . . . . . . . . . . . . . . . . . . . . . . . . . . . . . . . . . . . . . .128
Concerns . . . . . . . . . . . . . . . . . . . . . . . . . . . . . . . . . . . . . . . . . . . . . . . . . . . . . . . . . . . . . . . .128
Advanced Management Technique . . . . . . . . . . . . . . . . . . . . . . . . . . . . . . . . . . . . .130
Appendix A: Product Ranges of
Retail Stores . . . . . . . . . . . . . . . . . . . . . . . . . . . . . . . . . . . . . . . . . .131
Appendix B: Manufacturer’s Guide . . . . . . . . . . . . . . . . . . . . . . .136
Appendix C: Shortcut Keys . . . . . . . . . . . . . . . . . . . . . . . . . . . . . .145
Appendix D: Credits . . . . . . . . . . . . . . . . . . . . . . . . . . . . . . . . . . . .146
Technical Support . . . . . . . . . . . . . . . . . . . . . . . . . . . . . . . . . . . . . .147
Limited Warranty . . . . . . . . . . . . . . . . . . . . . . . . . . . . . . . . . . . . . . .148
Chapter 1: Installation
Welcome!
Before you install Capitalism II, take a moment to review the Minimum and
Recommended System Requirements. Your computer should meet allof the
Minimum Requirements so that Capitalism II may run. If it meets or exceeds
the Recommended Requirements you will find game performance greatly
improved.
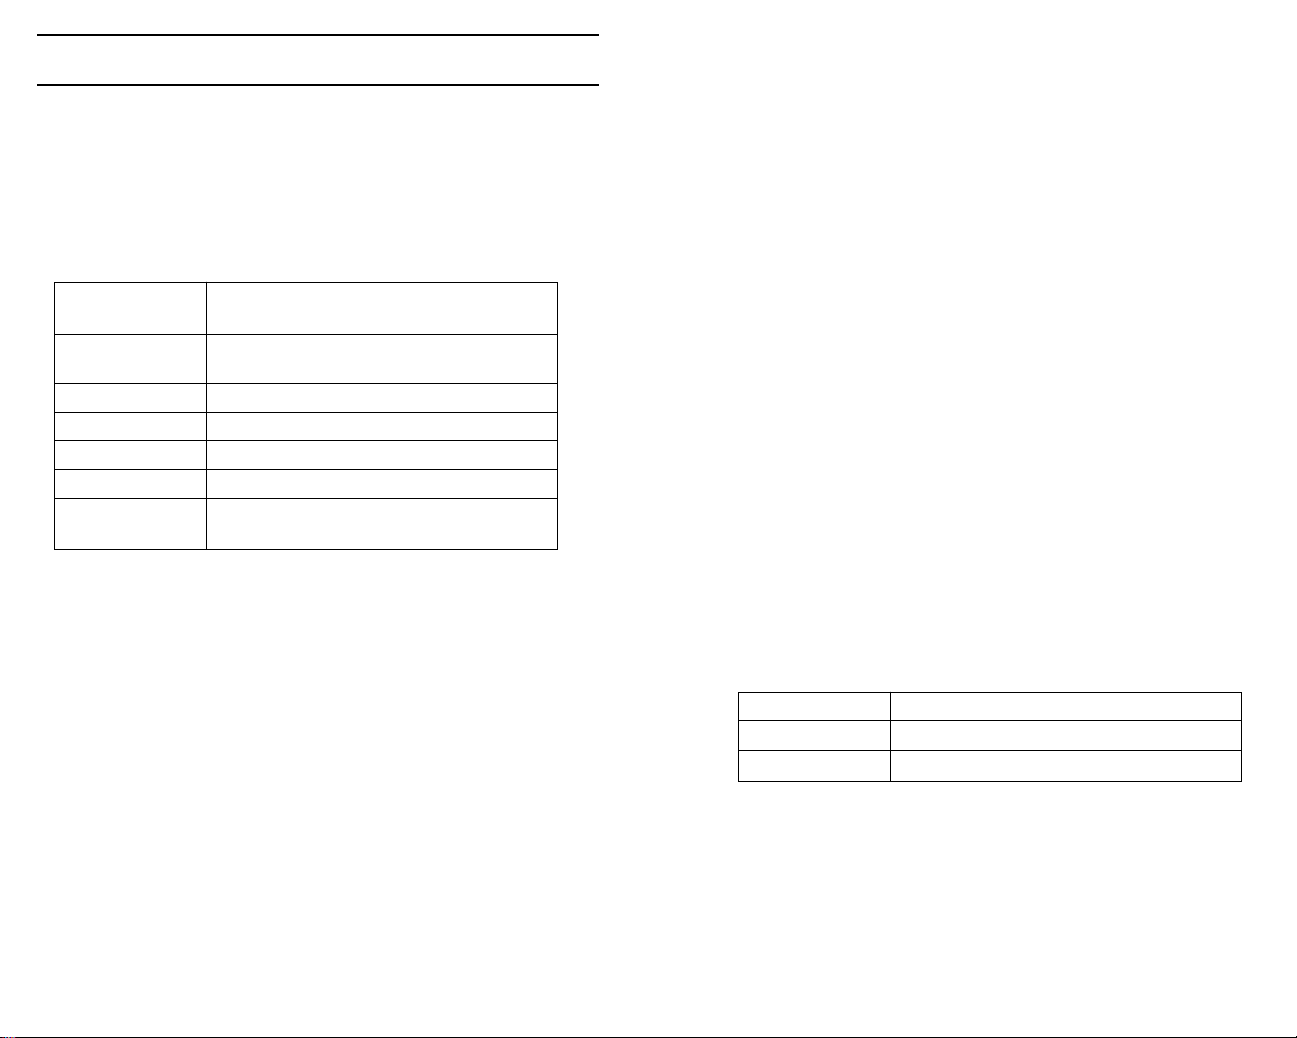
Minimum System Requirements
Operating system Windows®95/98/2000/ME/XP
(Windows®NT not supported)
CPU type and Pentium®II 233 MHz or
speed processors of the same grade
Memory 64 MB RAM
CD-ROM Speed 4x CD-ROM/DVD-ROM drive
Hard drive space 250 MB free hard disk space
Graphics card Video card with DirectX 8 compatible driver
Other needs DirectX 8 compatible sound card;
Keyboard; Mouse
To install Capitalism II follow the procedures below:
Before you start you must have Windows 95 (or later) installed.
1) Start your computer and wait for Windows to finish loading.
2) Insert the Capitalism II CD-ROM in your CD-ROM drive. If you
have AutoPlay you will see the installation screen. Follow the onscreen instructions and Capitalism II will be installed on
your computer.
If the installation screen does not appear, it is likely that AutoPlay is
disabled. Follow these procedures:
1) Click START on the taskbar.
2) Select SETTINGS, then CONTROL PANEL.
3) Double click ADD/REMOVE PROGRAMS.
4) Select INSTALL, NEXT and BROWSE.
5) Locate the program called SETUP on the CD-Rom and click OK.
The installation screen should now appear. Follow the on-screen
instructions and Capitalism II will be installed on your computer.
Recommended System Requirements
®
Pentium
128 MB RAM
Requirements for Multiplayer
Multiplayer support (2-7 players) 56.6 Kbps or faster connections
for Internet play; TCP/IP or IPX compliant network
II 350 MHz or processors of the same grade and
7
Using the Mouse
Capitalism II is controlled using a combination of keyboard and mouse
controls. The following table is a guide to the mouse controls.
Command
or Phrase Means
Left click, Select Depress the left mouse button
Right click Depress the right mouse button
Double click Rapidly depress the left mouse button twice
Please note that if your mouse is equipped with a scroll wheel you may use
it to zoom in or out of the main city view.
8
Chapter 2: Getting Started
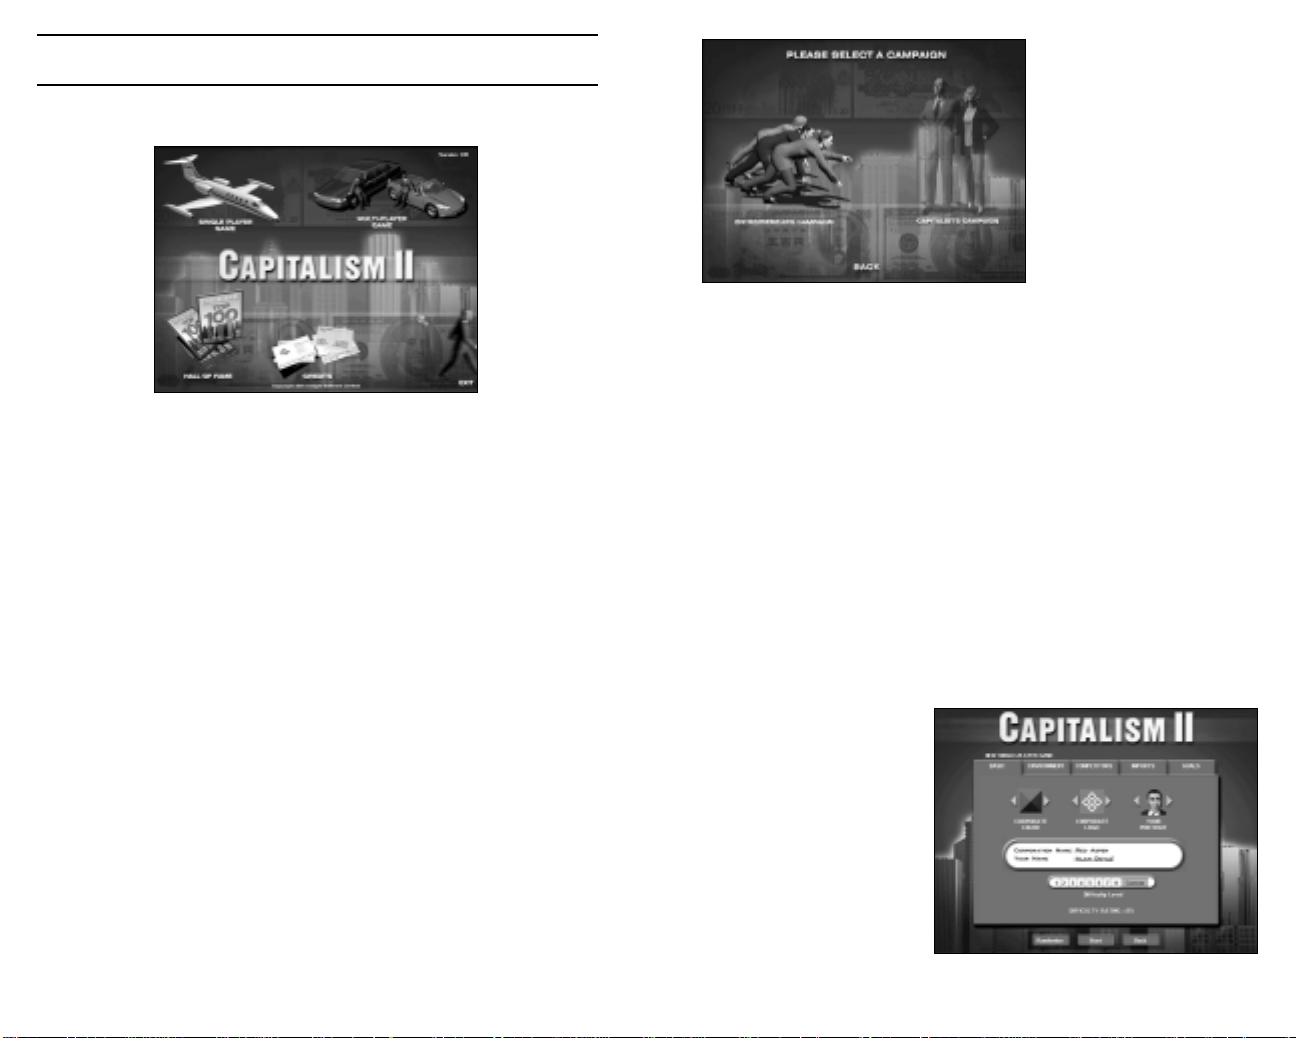
You begin Capitalism 2 at the main menu screen. From here you have 5
options:
Select either,
Entrepreneur’s Campaignto
play the tutorials. The tutorials
will lead you through game
play basics. They are
designed to be played in
sequence, allowing you to
maximise your learning
potential.
If it is your first time playing
the game, you are HIGHLY RECOMMENDED to start with Entrepreneur’s
Campaign.
Or select
Single Player Game Play against the computer
Multiplayer Game Play against computer and human opponents
via a network or the Internet
Hall of Fame View the list of the best players
Credits View the game credits
Exit Exit to Windows
Single Player Game
Select the Single Player option from the main menu to play Single Player
games. You may now choose from loading a previously saved game (LOAD),
playing a CAMPAIGN,or defining a CUSTOM GAME.
Click LOAD and select a previously saved game. The game will start
automatically.
Click CAMPAIGN and the following screen appears.
Capitalist’s Campaignto play through specific challenges presented as
individual scenarios. The scenarios are designed to be played after you have
completed the Entrepreneur’s Campaign, or when you are comfortable with
your knowledge of Capitalism II.
Unlike Entrepreneur’s Campaign,where you will only have access to the next
scenario in the campaign when you have successfully completed the current
one, Capitalist’s Campaignprovides you with a choice of 5 scenarios at a
time. When you have completed any of the available 5 scenarios, a new one
will become available, until all scenarios in the campaign have been
revealed.
Alternatively, if you wish to have open play, click CUSTOM.Here you will be
able to define some of the
game parameters yourself. A
series of screens will lead you
through the available options.
You may alter as many of the
options as you like, from all to
none. The first screen that you
will see is shown to the right.
9
10

From the screen shot you can see that the BASIC tab is the default selection.
From here you can alter your corporation’s color (as displayed in game), its
logo, and the in-game portrait that will represent yourself. Click the yellow
left/right arrows to cycle through the available choices.
Next choose your corporation’s name and enter your own name. You will
begin the game as chairman and chief executive officer of your corporation.
You may choose a difficulty level by clicking the buttons labelled 1 to 8. 1 is
the easiest and 8 is the most difficult. Modifying any of the game settings in
the following tabs will define the difficulty as Custom.
Lastly, you can click the Randomizebutton to set the game settings in the
tabs to random values.
Click the ENVIRONMENT tab
In the Environment screen you can:
• Define the Number of Cities that will appear in the game.
• Determine the level of Start-up Capital (or money) you and your
corporation will have.
• Set the frequency of Random Events such as plagues and power
black-outs.
• Set the Game Starting Year.An earlier start date will mean that
some technologies will have to be researched before they are
available to you.
• Decide if you wish to Allow Stock Investment. If you decide on
including the stock market your corporation will be able to invest in
other corporations, but it will also be open to possible takeover and
merger moves from other corporations.
• You may choose whether to allow only single Retail Store Types or
many. Selecting one type will result in generic departments stores that
can sell any product, while selecting many types will result in more
specific stores being available, such as toy and jewellery stores.
Further information can be found in Chapter 4.
• Finally, you may decide if you want a Complex City Economy or not. If
you decide to enable this option each city will be subject to variances in
the local city economy. You may find that some cities have lower land
values and labor costs, enabling you to operate more cheaply before
exporting your goods to a more wealthy market. Or you may find that
product demand is different than found in a neighbouring city. An
11
abundance of work will increase the local population causing land
values to increase and traffic to become denser. All in all, the city
economy will reflect the dynamics of the city as it develops.
Click the COMPETITORS tab
In the Competitors screen you can:
• Define the Number of Competitors.
• Set the level of their Start-up Capital.
• Set their economic Aggressiveness towards other corporations.
• Adjust the Expertise level for each corporation.
• Choose to be able to see your competitors’ Trade Secrets.If you
select ‘yes’ you will be able to view firm layouts, product information
and R&D projects.
• Alter the Competence of Local Competitors. These local stores are not
corporate controlled but still influence the city market place.
Click the IMPORTS tab
In the Imports screen you may:
• Determine the number of Seaports Importing Consumer and Industrial
Goods per City. The more seaports of each type in existence, the more
diverse the range of products will be available at the start of the game.
• Select Constant Import Supply. If this is selected, the supply of
imports will be constant as long as demand exists. Otherwise the
supply may be cut of suddenly.
• Determine the Import Quality. A low import quality product should be
inferior to a corporation manufactured product at the beginning of the
game. Conversely, imported goods of high quality should be superior at
the start of the game.
Click the GOALS tab
In the Goals screen you may set custom goals for the new game. Click the and + buttons to alter the settings. If you decide to play to any goals, you
may set:
• The No. of Yearsover which the goals must be achieved.
• The Goal Score Bonus, which will be added to the player’s score if the
goals are achieved.
• Values 1 to set financial goals.
12

• Values 2 to set corporate performance goals.
• Industries and Products to set, respectively, industrial and product
dominance goals.
When you have finished customising the game click STARTand the game
will begin.
Multi-Player Game
Select the Multi-Player option from the main menu to play Multi Player
games. You may now choose from Play it on Ubi.com, LOADa previously
saved game, or CREATE A NEW GAME.
Step 1: Starting a Multi-player Game WITHOUT Ubi.com
You should only select CREATE A NEW GAME or LOADnow if you want to
start a multiplayer game playing in a local area network, via modem or cable
directly, or via the Internet accessing a known TCP/IP address. If this is not
the case with you, you should proceed to the manual section “Step 1:
Starting a Multi-player Game WITH ubi.com” below.
If you have selected LOAD, you will be asked to select a game you previously
saved in a multi-player game session.
Subsequently, you will shown to the following options:
IPX Connection for DirectPlay Join a local area network game
Internet TCP/IP Connection for DirectPlay Join a local area network or
internet game
Modem Connection for DirectPlay Join with another player by modem
13
Serial Connection for Direct Play Join with another player linked by
serial cable
Left click on any of the four options and press the CONTINUE button.
Now proceed to the manual section, “Step 2: Setting Up the Multi-player
Game” below.
Step 1: Starting a Multi-player Game WITH ubi.com
Ubi.com provides a central lobby where Capitalism II players can meet each
other online and find opponents to play with in a multi-player game.
When you select Play it on ubi.com, the game will attempt to launch the
ubi.com application, which can be optionally installed to your computer
during Capitalism II installation. If it is installed on your computer, the game
will now close itself and let ubi.com guide you through the multiplayer game
setup. On the other hand, if the ubi.com application is not installed on your
computer, the ubi.com web page will be opened, providing you with
information and instructions for downloading and installing ubi.com on your
computer. Alternatively, you can install ubi.com from your Capitalism II CD by
choosing, “Install ubi.com” from the game startup menu.
When you have successfully found online opponents in ubi.com, ubi.com
will launch Capitalism II again with an attachment of all multiplayer setup
information necessary for starting a multiplayer game. As soon as Capitalism
II is launched, you will see the Multi-player Game menu. There you should
select either CREATE A NEW GAMEor LOADa previously saved game.
If you have selected LOAD, you will be asked to select a game you
previously saved in a multi-player game session.
Step 2: Setting Up the Multi-player Game
Here you will be asked to provide YOUR NAME and a SAVE GAME FILE
NAME. Once you have completed these, choose CREATE to begin a new
multi player game, or JOIN to take part in an existing session.
You will then be taken to the Multiplayer Game Setup screen where you can
customize the new multiplayer game and chat with other players. To chat,
just type in your chat message and press ENTER to send.
When you are ready, click the READYbutton and the indicator next to your
name at the top of the screen will turn from red to green. When all players’
indicators are green, the creator of this game (the player who selected
CREATEinstead of JOIN in the previous screen) can now click the START
button to start the game.
14

Chatting with Other Players
To chat with other players in a multiplayer game, either click the Chat button
on the toolbar at the bottom of the screen or press the Enter key. The chat
message box will be displayed at the bottom of the screen and prompt you to
enter a chat message.
The message will be sent to all other players by default. There is, however, a
list of buttons in different colors representing different companies controlled
by other players. If you click any of them, the message will be sent to the
particular player only.
Winning or Losing
The following are definitions of winning and losing in different types of
games in Capitalism II.
You will lose if any of the following occurs:
• You are not able to achieve all of the goals within the given time.
• You retire without achieving all of the goals.
• Your corporation goes bankrupt.
• Your corporation has been merged into another corporation which
formerly owned not less than 75% of your corporation’s shares.
• Another human player achieves all of the goals before you do.
Note: Unlike in a single player game, where you will immediately lose the
game when somebody has acquired 50% or more of your corporation’s
stock, in a multiplayer game you will be allowed to continue your role as
CEO of your corporation even though somebody else has acquired
controlling interest.
Single Player Game - Campaign Game
You will win if you achieve all of the assigned goals in the given time.
You will lose if any of the following occurs:
• You are not able to achieve all of the goals within the given time.
• You retire without achieving all of the goals.
• Your corporation goes bankrupt.
• Your corporation is taken over by another corporation.
Single Player Game - Custom Game
If you have not set any goals for the game, the game will be open-ended. You
will lose if your corporation goes bankrupt or if it is taken over by another
corporation.
If the game has a set of specific goals, the winning and losing conditions will
be the same as those in a campaign game.
Multi-Player Game
If you have not set any goals for the game, the game will be open-ended. You
will lose if your corporation goes bankrupt or if it is taken over by another
corporation.
If the game has a set of specific goals, you will win if any of the following
occurs:
• You achieve all of the assigned goals in the given time.
15
You will only lose the game when another corporation has acquired 75% or
more of your corporation’s stock and decides to execute a merger with your
corporation. The result of this is that the entirety of your company will be
consolidated into the other company, thus ousting you as CEO.
New Features of Capitalism II
For those who have played Capitalism or Capitalism Plus, the following is a
highlight list of new features of Capitalism II.
• Dozens of exciting new scenarios are packed into two brand new
campaigns: The Entrepreneur’s Campaign and The Capitalist’s
Campaign.
• Vivid, isometric 3D graphics show off the stunning new buildings,
roads, vehicles and people.
• New multiplayer games, with up to 7 players, offer intense competition
against players from around the world.
• A new ability to acquire buildings from other companies. In
multiplayer games you will be able to negotiate for the best prices with
your human or computer opponents.
• The cities in Capitalism II are modeled with a dynamic economic
system. Flourishing businesses and busy traffic will increase the area’s
land values. Astute investments in the real estate market can be a path
to riches.
• Take on the title of Real Estate Mogul by building apartments and
commercial buildings in pricey downtown locations.
16
• Build a headquarters for your company and, from there, execute
corporate-wide training programs. Allocate resources to public and
investor relations, promoting your brand and your company’s stock.
• Build your dream mansion with the fortune that you have made in the
business world.
• Quickly judge the status of your business by observing the activities of
your employees and customers in the newly added interior views
• Economic systems are not only dynamic, but complex as well. Labor
cost and cost of living will vary from city to city, giving you an incentive
to set up production in areas of low overhead, while exporting to cities
with a more wealthy consumer base.
• Now more product types than ever. Over 60 products for you to
manufacture and market.
• A new streamlined interface that eases the locating of suppliers and
the setting up of retail stores.
• You can now build an array of retail stores - from mega-discount
stores to specialty stores; each with its distinct advantage for your
business strategy.
• Rather than being forced to develop your own technology, you may
now acquire it from another company. And you may sell to others the
technology that you have developed yourself.
• You will now be able to fill new senior management positions. Chief
Operating Officers, Chief Marketing Officers and Chief Technical
Officers can help to streamline some of your day-to-day business
activities.
• Expand your corporation into a true conglomerate; get ink on your
fingers and take to the airwaves with your new newspapers publishers
and TV and radio stations.
Chapter 3: Game View
After beginning a new game, or after loading a saved game, you are
presented with an isometric view of your starting city. The view can
be zoomed using your keyboard + and - keys, or with a scroll-wheel
equipped mouse. Move the pointing hand icon using the mouse or
keyboard cursor keys to navigate around the map.
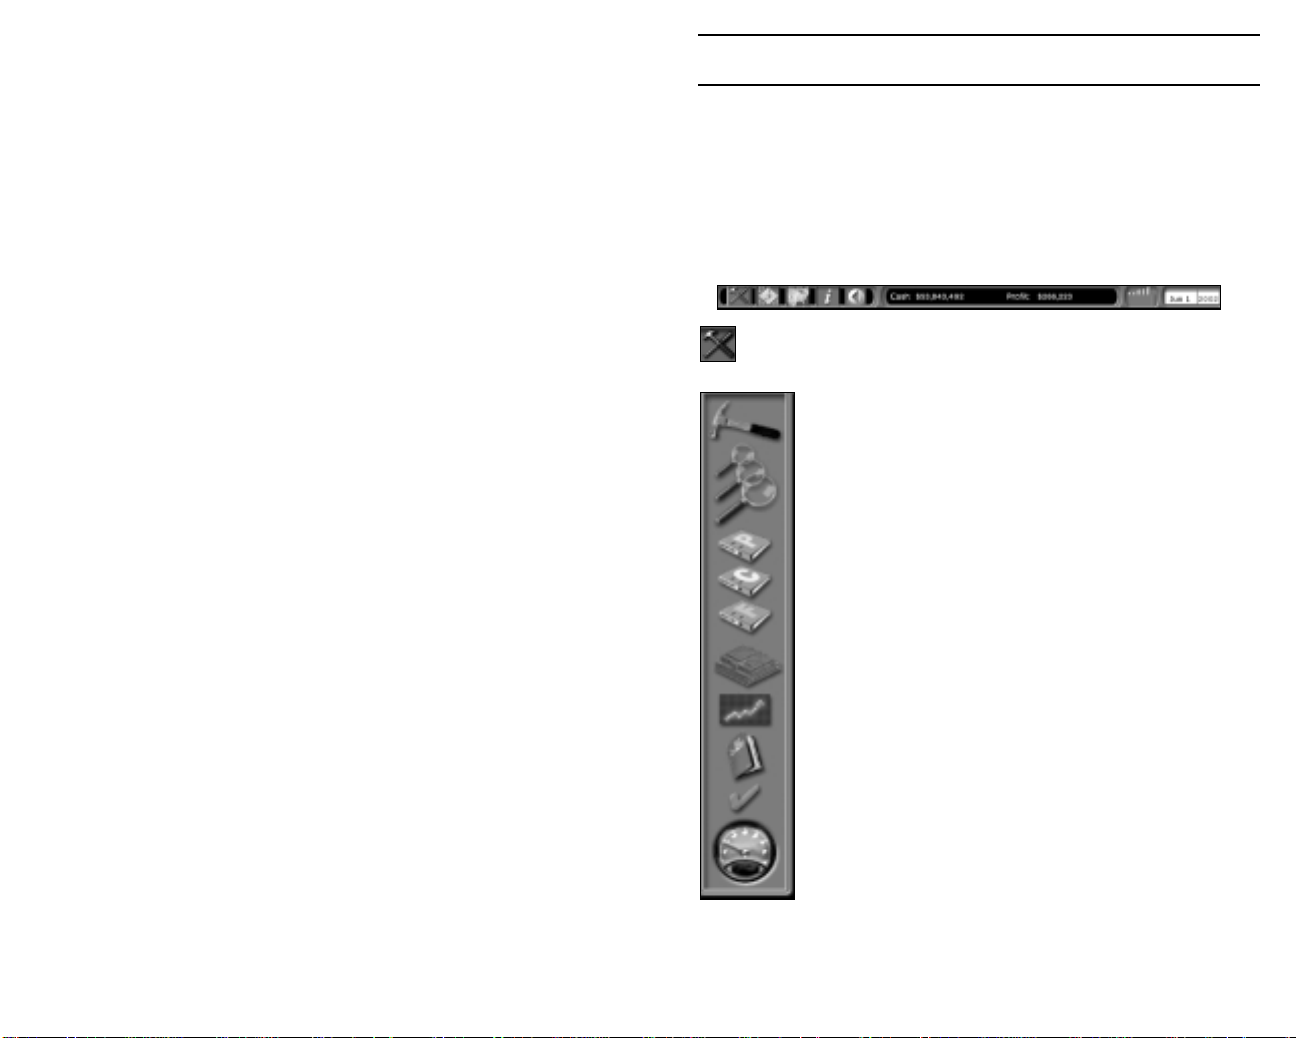
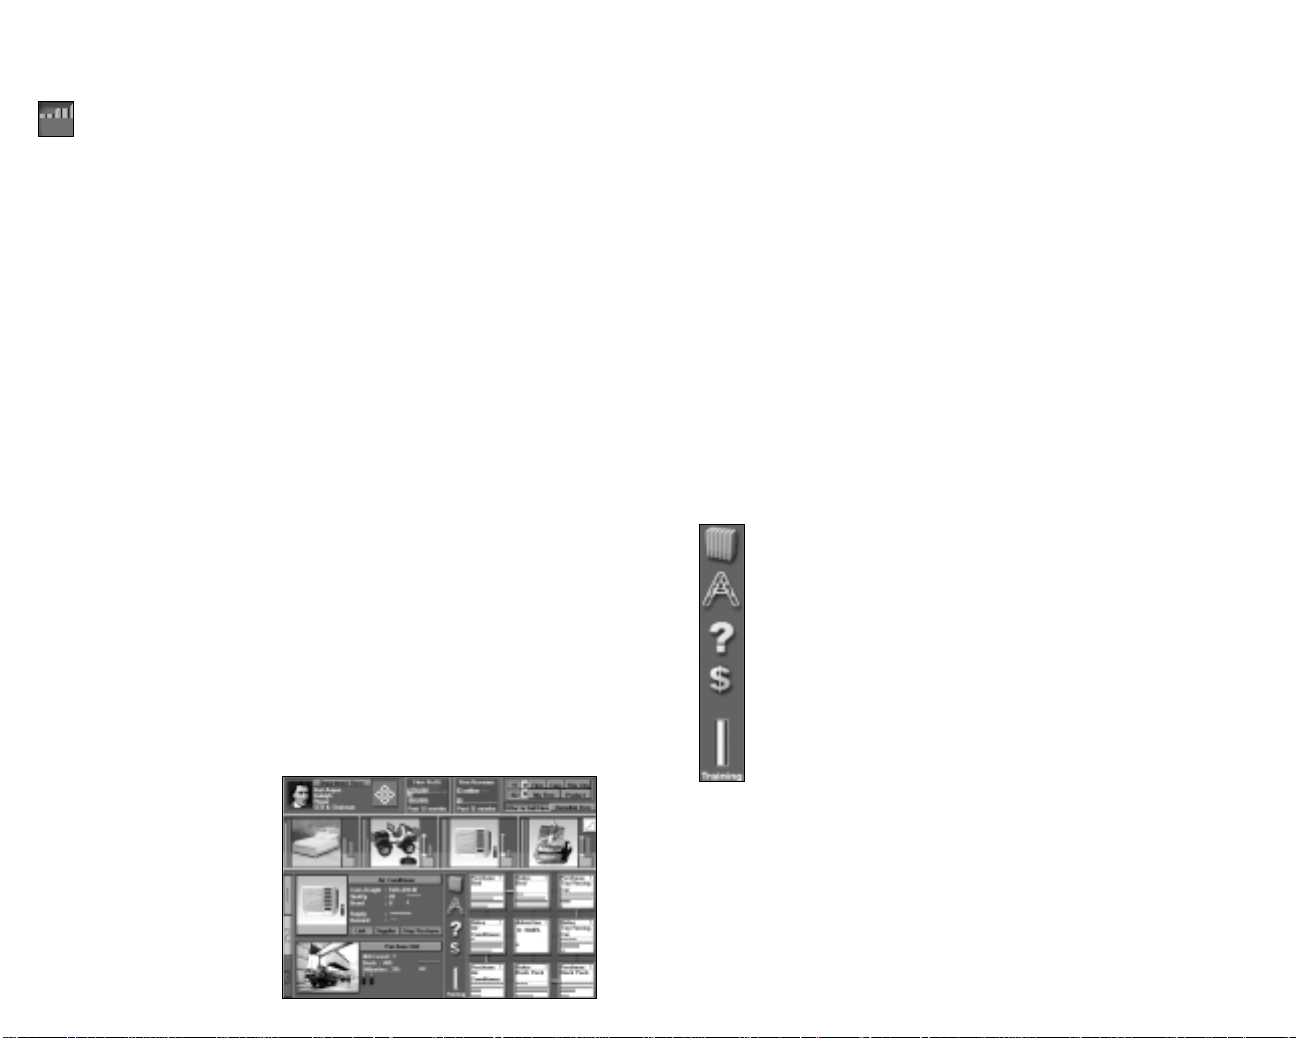
The Toolbar
This is located at the bottom of the screen and comprises 8 sections.
1.
Game Tools –A side bar menu opens when you click on the tool bar.
From top to bottom the menu displays:
Construction. Various types of building are available, from
Retail Stores to Corporate Headquarters. See Chapter 4 for
more details.
Zoom Levels. Three levels of zoom are available. Click on a
magnifying glass to alter the zoom level from closest view (top
glass) to farthest view (bottom glass).
These three icons link to Product Summary Report, Corporate
Summary Report and Finance Summary Report respectively.
These topics are discussed in Chapter 5
Headquarters. Access information regarding your corporation.
More information can be found in Chapter 4
Stock Market. The Stock Market is covered in Chapter 6.
17
Game Options. Load or Save games.
In Game Options. See details below.
Game Speed. Click anywhere on the dial to alter the speed.
The game is paused when the needle is pointing to the bottom
left, and running at full speed when it points to the bottom
right.
Click the Game Toolsicon on the toolbar to close the menu.
18
In Game Options. This screen allows you to activate or deactivate game
sound effects, music or the autosave feature. You may also alter the autolink
(your purchasing units locate their own supplies) and internal sale features
(your manufactured or farm-reared products are available for you
corporation only). Select News to enter the comprehensive news section.
From here you may toggle several options to control how much or how little
news you are given. News items will be displayed at the bottom of the city
view screen for short time. If the headline relates to the construction of a
new building or the discovery of new raw materials, clicking the square to
the left of the headline will reposition the city view over the source of the
news.
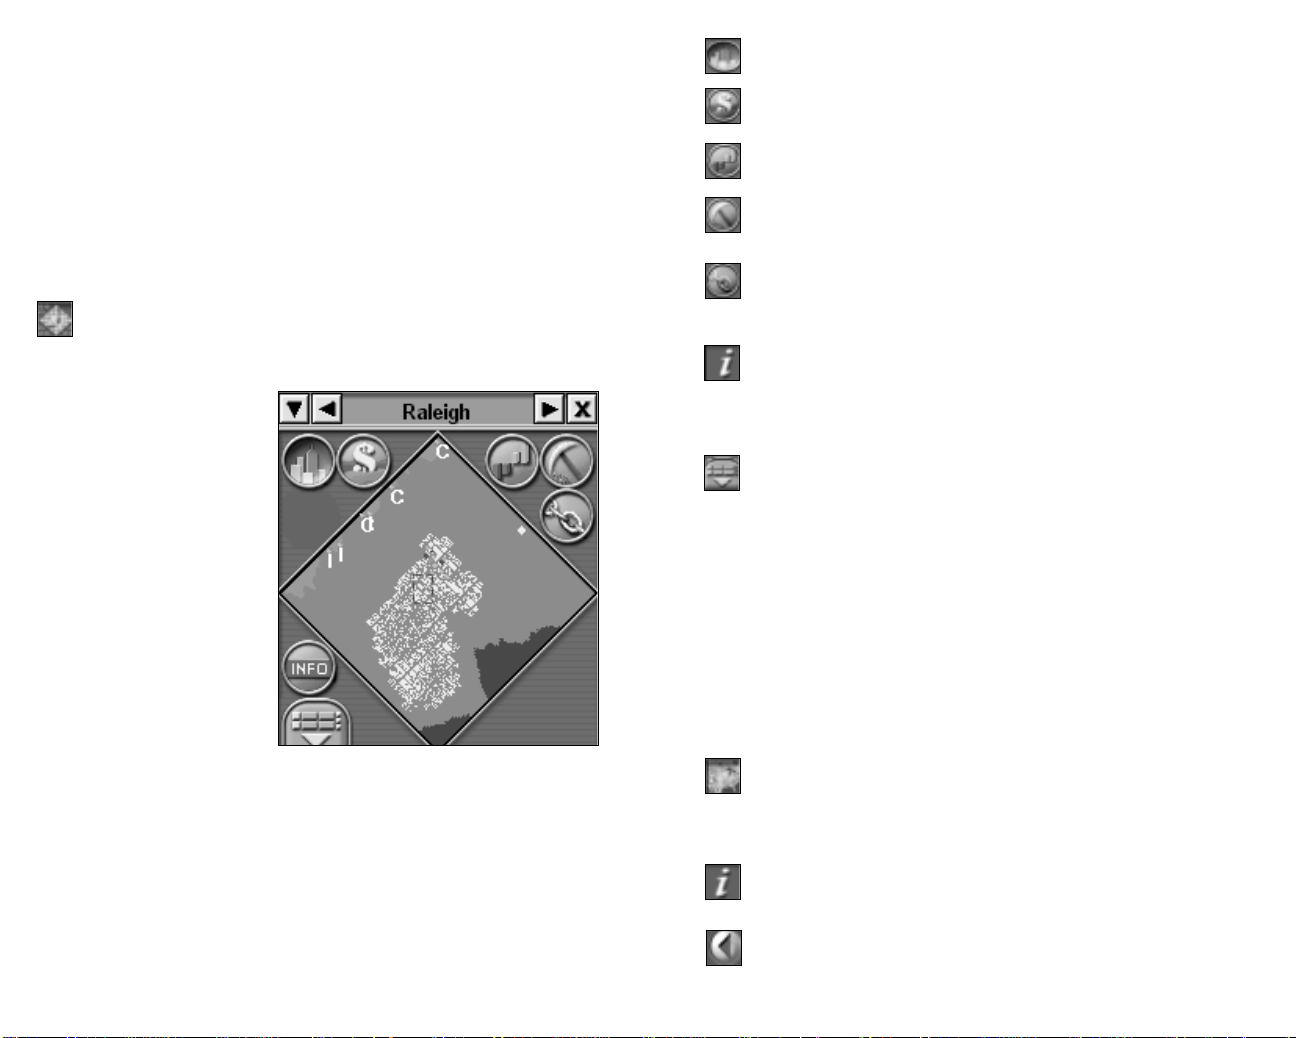
2. Mini Map – Click the map icon on the toolbar and a small map
appears. This provides important geographical and financial
information to help you plan your strategy.
A window opens top right of
the main game screen
displaying the current city.
Government buildings (See
Chapter 4 for more information)
are shown in grey, whilst
corporation-owned buildings
are shown in the corporate
color. Seaports are labeled C or
I depending on the type of
import handled: Consumer or
Industrial goods. A flashing
rectangle indicates the map
location of the current
isometric view on the main
screen. Clicking anywhere on
the Mini Map will update the
main display to that location.
If you have chosen a game with several cities, they can be viewed by
clicking the left/right arrows adjacent to the city name at the top of the Mini
Map window. Alternatively, click the down arrow to display a list by city
name and click on a city to choose it.
Within the Mini Map view are several icons. These toggle various filters that
are then displayed over the city view.
Buildings. Default view displaying the city buildings.
Land Values. Light-colored regions represent higher land values than
darker regions.
Profit Loss. Shows which firms are profitable and which are not.
Raw Materials, Shows the location of such items as Timber, Iron and
Gold, which can be mined for use in manufacturing other goods.
Links. This filter displays product, firms and corporation links within
the game. Use it in conjunction with the “Product/Firm” filter to track,
for example, the sale of raw materials from your mine.
The INFO icon allows you to select whether or not the main view
indicates what a building is used for (toy store, apartment building). If
the option is turned off, the main screen will still display the buildings,
including corporate insignia.
The “Product/Firm” filter allows for greater inspection by toggling the
various buttons it contains. For example, by clicking the MYFIRM
button you can cycle through the location of all your buildings within
the current city, or multiple cities if you toggle between THIS CITY/ALL
CITIES. Similarly the PRODUCTS button allows you to search for specific
products, for example, to see if and where a particular product is being
manufactured and sold. Use FIRM to search for specific buildings (such as
Retail Stores or Factories), or try CORP. for a corporate level search. Choose
from a combination of buttons to refine your search. For example, choose
“Retail Store” from FIRM and “Canned Soup” from PRODUCTS to see which
stores are selling soup in the city.
To close the Mini Map window, click the X in the top right or click the Mini
Map icon on the toolbar.
3. World Map – Displays the world location of the current city (and
any other playable cities). Click the World Map icon on the toolbar. To
close the map view, click the toolbar again, or click the X in the top
right of the map window.
4. Information – A comprehensive choice of reports and guides.
Further details can be found in Chapters 5, 6 and 7.
5. Back – Return to the previous screen viewed (like a browser back
button).
19
20
6. Cash & Profit – A live reading of your corporations’ current cash
and profit amounts.
7. Profit/Loss – A live bar chart depicting corporate profit and loss
information for the previous 6 months. The length and color of each
bar relates to the nature and amount of the monthly turnover. A tall,
green bar indicates large profit, whilst a short red bar indicates a
small loss.
8. Date – Shows the current game month, day and year data.
Understanding a Firm
To build a firm, select the type of firm you want to build from the
Construction menu (see above). Next, position the cursor over the location
on the map where you want to build the firm. If the firm can be built in the
selected location, you are informed about the total building cost, which
includes the land and construction costs. If you think the cost is reasonable,
click the Build button to start construction.
Some firms offer you choices of different sizes. The size of a firm affects 1)
its setup and monthly operating cost, 2) its capacity – the quantity of
products that it can stock, 3) its productivity – the rate it produces products,
and 4) the number of employees each firm unit employs. You should build a
larger firm if you anticipate a high demand for your products. On the other
hand, if you are skeptical about the demand of your products, you should go
for a smaller firm.
The land value of an area may change over time. It rises when there is an
increase in traffic volume and the number of buildings in the area.
Conversely, it falls when firms in the area are closing down and the volume
of traffic decreases. Players will benefit from their real estate investments if
the land values of their properties increase and this will be reflected in their
corporate balance sheets.
The screen represents a department store selling the retail store maximum
of 4 products. The top section of the screen shows the owning corporation –
double click on the logo to enter the Corporate Summary screen – and two
graphs depict the firm’s profit and revenue over the last 12 months. At the
top right is a filter that will allow you to cycle through specific firms,
products and corporations.
The next row shows photos of the products on sale. As this is an established
store, all 4 slots are occupied.
The lower left section contains information relating to the currently selected
unit in the Layout section to the right. In the example shown a Purchasing
unit is selected.
At the left are three tabs labeled “1”, “2” and “3”. “1” is the information view
which is what you are currently viewing. Clicking the “2” tab will change the
view to the exterior of the firm and clicking the “3” tab will display the
interior view of the firm. The interior view gives you visual cues about the
productivity of your firms and the number of customers in your stores. For
instance, if the employees of one of your factories are idle, it is a clear
indication of the existence of a problem in your production line and you must
take action to fix it immediately.
Layout Section
To the immediate left of the nine unit boxes is a column containing
five icons. These are layout library, auto link, help, firm financial
report and training, and are covered in detail below.
Setting up a Functional Unit
There are more than a dozen different functional units in the game.
Each one has a distinct function. For example, a purchasing unit is
responsible for purchasing goods, whereas a sales unit sells goods
and generates income for the firm.
The building will be immediately
available for use. Click the
building to ‘enter’ it. With the
exception of apartment,
commercial, government and
media buildings, which have
building specific interiors, you
will see a similar screen to the
one shown.
21
To set up a functional unit, double-click a location inside the firm where you want
to begin construction. A menu prompts you to select the type of unit you want to
set up. Because the different types of units have different functions, some units
require more capital and workers than other units. For example, the
manufacturing unit requires many more people than the inventory unit. After you
set up a unit, a box displays summary information about it in the lower left of the
screen. In this area, you see a picture of the unit and a group of people
representing its workers. The workers in red uniforms are novice workers and
the workers in blue uniforms are experienced. For details on improving worker
experience level, see Worker Experience and Unit Level below.
22

Linking Functional Units
You can link two units together by clicking the link line between them. Once
linked, they can communicate with each other and transfer goods.
The overall productivity and capacity of most units increase when their unit
level is increased. All units begin at unit level 1, and certain units continue to
improve until they reach the highest rating, unit level 9.
Since functional units are the essential components of a firm, if the linkages
between the units are not properly established, the firm may not function as
you intended.
For example, linking a purchasing unit to a sales unit enables the goods
purchased by the purchasing unit to move onward to the sales unit for sale.
Without the linkage, both of the units will become idle and neither will
contribute to the profitability of the firm.
See Chapter 4, for more detailed information about each type of unit.
Labor Cost
For simplicity, the monthly salary of each worker in the game is set at $2,000.
This salary applies to all workers regardless of the nature of their jobs or
their experience. The specific salary expenses of a firm are shown in the
Financial Report. Please note that hiring individual officers, such as a Chief
Technical Officer, will cost more than $2000 a month. These hired
professionals command salaries in excess of six figures. See Chapter 4, HQ
Unit Types, for information about hiring professionals.
Staff Training and Procurement of New Equipment
To the left of the layout section, there is a vertical slider labeled
Training. Use it to set the spending for staff training and procuring
new equipment. You can see the exact amount spent on training
and equipment for the entire firm in the Financial Report.
Spending on staff training and installing new equipment greatly affects the
efficiency of the workers as the functional unit improves. It is worthwhile for
a firm to spend more on this area especially as one considers that there are
long-term benefits to be gained.
Worker Experience and Unit Level
If an inexperienced worker is provided with proper training, the worker
eventually becomes an experienced worker. You can distinguish between a
novice worker and an experienced worker by looking at the uniform color.
Novice workers wear red uniforms, whereas experienced workers wear
blue. When all the workers in a unit become experienced, the unit will
increase one level.
23
The rate of improvement varies for the different unit types. Improvement
largely depends on the resources you allocate to train staff and upgrade
new equipment. Employees who are in units with high utilization receive
more experience than employees who do not work to capacity. Workers who
work to their capacity will learn faster than workers who are idle. Therefore,
it is not unusual to find that the rate of improvement is faster during the
growth phase of the business than when the firm has leveled off in its
productivity.
The unit level decreases for most units when there is change in the product
handled by that unit. For example, if a manufacturing unit, which previously
manufactured sport shoes, changed its production line to manufacture
jeans, its unit level would immediately decrease.
Auto Link
Over the training slider, you can see the Auto Link button. If you enable
it, all of the purchasing units in the firm with broken supplies will look
for the needed supplies automatically. This feature also works with layouts
pasted from the layout plan library.
Help
Click the help icon to be taken to the Manager’s Guide screen. This
guide is discussed on page 100.
Layout Library
Clicking the books icon next to the layout grid accesses the library.
When you enter the library you can immediately ADD the layout you have
just left. Complete the description line if you wish. You may also Delete the
firm’s layout with the one currently displayed in the library window. If you
enter the library from either a farm or factory you will be able to use the
Search filter to locate any previously stored layout plans containing the
product you select. Alternatively you may use the slider below the layout
plan to search through all the stored plans. If you locate a plan you wish to
use, click USE and the plan is placed within your firm.
When in the farm or factory layout mode there are two further sections to
assist you. These are the input and output sections. The output section lists the
product outputs of the currently displayed layout plan, whilst the input section
lists the products required to attain the output. A tick next to an input list
item indicates that particular product is available from a local supplier.
24

Firm Financial Report
Click this icon to display the financial report for the firm. This report,
discussed in Chapter 5, details the income and expenditure of the firm
(such as salaries paid, training expenses and sales revenue) by current
month, previous month, year to date or lifetime of the firm.
Product Summary
The main screen displays the pictures of all products currently available for
sale in the firm. Each product picture has several bar and line indicators on
the side. These indicators tell you how good the product is compared to the
market’s standard and how well the product is currently selling. An
explanation of the indicator bars and lines follows.
Supply and Demand Lines
There are two vertical lines to the left of the product picture. The blue one is
the supply line, and the red one is the demand line.
If the supply line is longer than the demand line, the supply of the product
exceeds the demand. This implies that the profitability of the product might
not yet be fully exploited. There is more capacity to meet demand and
generate revenue than there is currently demand for the product.
On the other hand, if the demand line is longer than the supply line, the firm
cannot supply enough goods to meet the demand. In this situation, you
should increase the supply of product as soon as possible to increase
revenues.
The relative size of each bar
represents the importance of
that aspect to the consumer.
For example, consumers of the
soap shown on the left are
buying this particular soap
because it has a high rating for
brand – the size of the orange
brand bar is equivalent to the
combined sizes of the yellow
price and green quality bars. If the price of the soap were lowered, the
likelihood is that the yellow price bar would increase in size to represent the
new price attractiveness felt by the consumer. As a consequence brand and
quality would become slightly less important considerations for the
consumer. The important thing to remember is that the relationship of the
bar sizes is an indicator of why the consumers are purchasing that
particular product, irrespective of competition or necessity. You may see a
situation in which two examples of a product successfully exist in the
market place even though one is inferior in brand or quality to its rival. It may
be the case that the inferior product is priced so aggressively low that its
only selling point is its price – it will only show a yellow bar – whilst its rival
displays large bars for quality and brand. An example of this is given in
Product Information, below.
Studying the relative sizes of the bars can help you decide a strategy;
Concentrating on improving a soap’s brand, for example, would initially be
more beneficial than modifying price or improving quality.
Product Rating Bars
There is a set of two vertical bars to the right of the picture. The left one,
which usually consists of differently colored portions, is the overall rating
bar. Each portion represents a distinct aspect of the product and their
combined rating becomes the overall rating of the product. The definitions of
the colors are:
• Yellow. The product’s price attractiveness.
• Green. The product’s quality.
• Orange. The product’s brand.
25
Product Market Share
Next to the product rating bar, there is a red bar showing the market share
of the current product in the city. When the length of the bar is close to its
maximum, the product is dominating the market in the city.
Product Brand Indicator
Directly under the two bars, there is an indicator showing the corporate
color of the product’s brand owner. A gray branding indicates imported
products.
Product Information
When you left-click a product photo, detailed information is displayed in the
lower-left section of the screen. The example below shows detailed product
information. In this instance the product on sale is a bed.
26
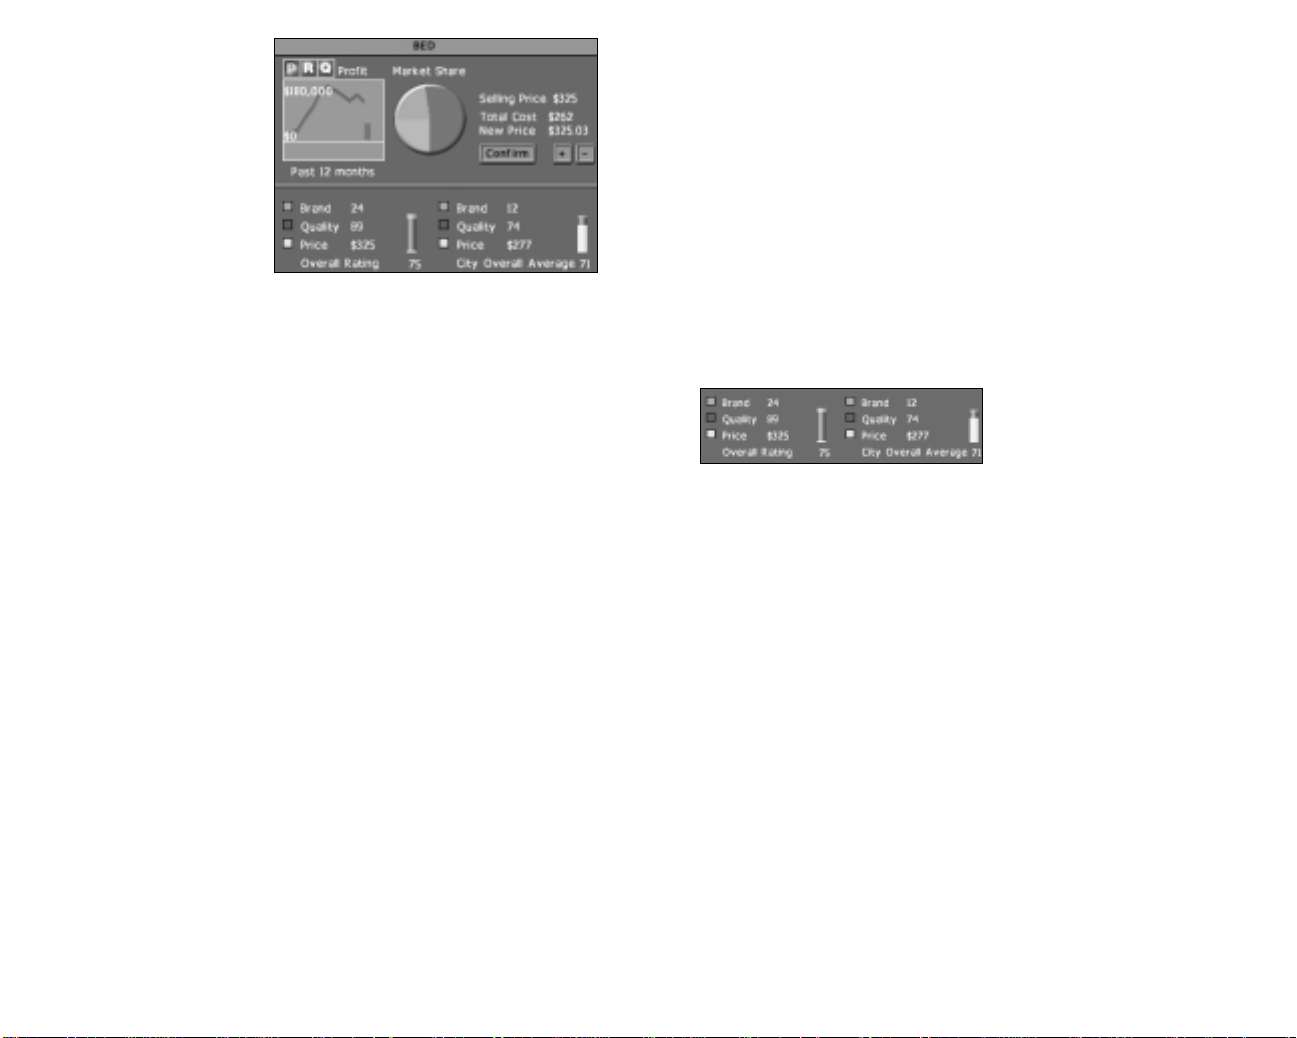
The Product Information
section displays:
Selling Price. The selling price
of the product.
Total Cost.In a factory, this is
the total cost of the raw
materials used to manufacture
one unit of the product,
including the freight cost of the
raw materials.
In a retail store, this is the purchase cost (how much the store pays the
supplier) and the freight cost of the product.
In a mine, logging camp, or oil well, this is the cost of the consumption of the
natural resource reserve. When a corporation buys land with a natural
resource reserve, the reserve is treated as a corporate asset. Hence, when
the reserve is being consumed, the devaluation of the asset is regarded as a
cost to the company.
New Price. If the firm displayed belongs to your corporation, you can
change the selling price of the product by setting the new selling price and
then clicking the Confirm button to confirm the change of the selling price.
NOTE: There is an upper limit on the price you can set.
The graph shows information about the product. There are three buttons
above the graph. Click one of these buttons to control the type of information
displayed on the graph.
• P button. Shows the gross profit of the product over the past 12
months.
• R button. Shows the revenue of the product over the past 12 months.
• Q button. Shows the quantity of the product sold over the past 12
months.
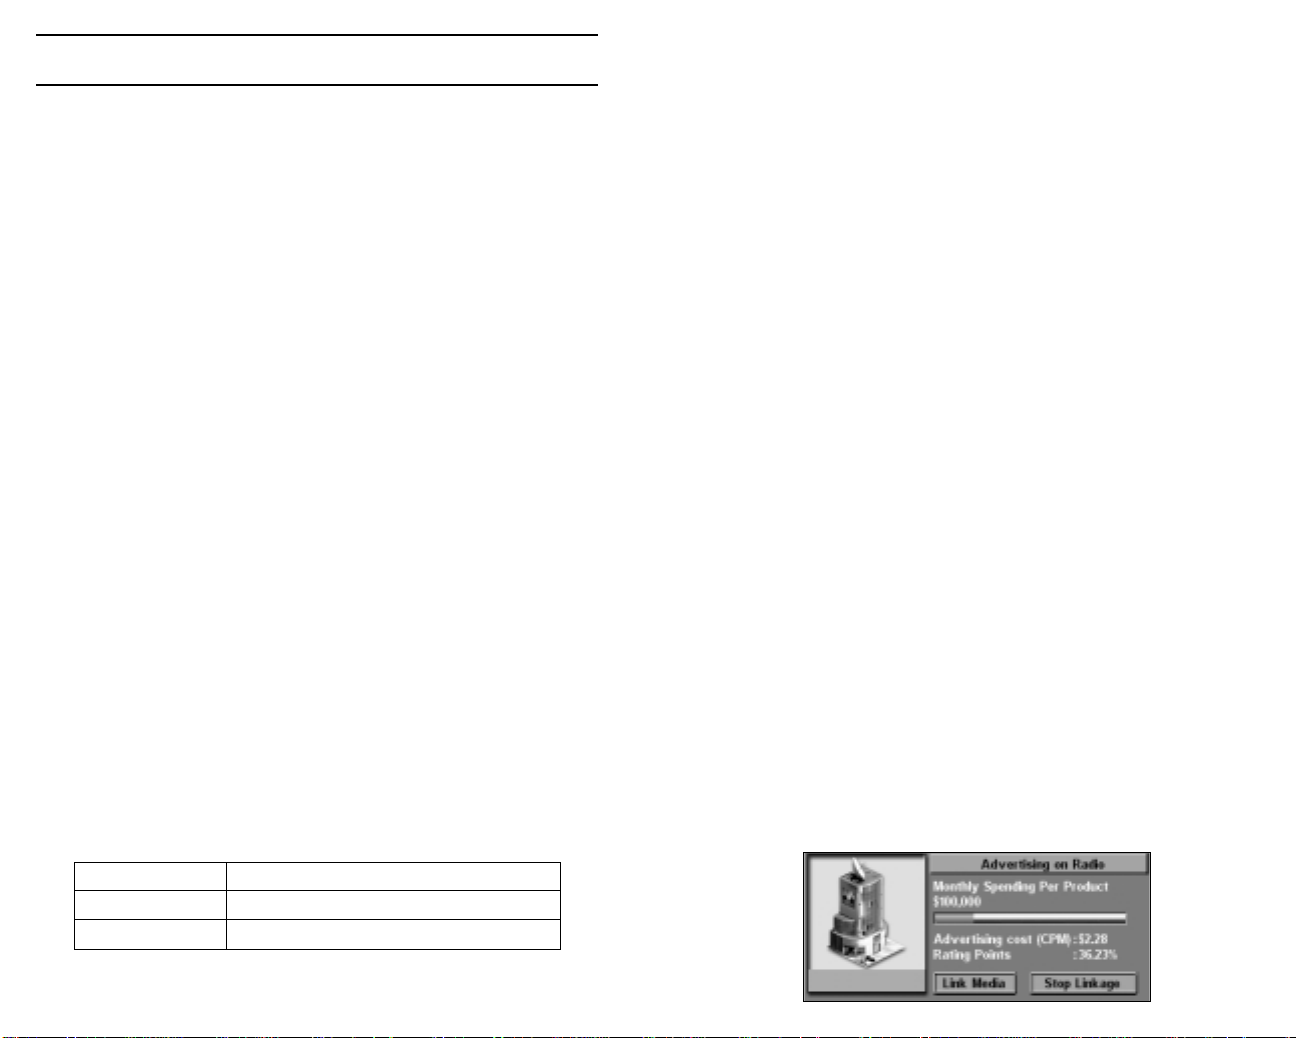
Product Ratings
The section at the lower part of the Product Detail area displays important
ratings about the product. They are:
• Brand. The product’s brand rating.
• Quality. The product’s quality rating.
• Price. The product’s sale price.
• Overall. The product’s overall rating.
To the right of each rating, the average rating of similar products in the city
is displayed.
The example below is taken from the product detail report for the bed
discussed before.
The type of bed being sold has a
Brand rating of 24, a Quality of 89
and a Price of $325. These ratings
result in an overall rating of 75. In
comparison, other competitors’
beds for sale in the city do not have such established branding or quality but
their price is lower. As a consequence the overall rating for the competitors’
beds is only slightly lower at 71.
By looking at the Product Rating bars you can see the real difference
between the two types of bed. The consumers purchasing the current firm’s
beds are more concerned by the higher quality on offer – the green portion
dominates the Product Rating bar. Those consumers purchasing the
competitors beds are doing so because of the lower price – the yellow
portion dominates the Product Rating bar. These are local variations to the
concerns normally addressed by the consumer. A bed is usually rated in
equal proportions against Price, Quality and Brand (the yellow, green and
orange sections of the Product Rating bar in the product photograph are of
approximately equal size). Such variations arise if a product displays
superior attributes, in this example a much higher quality, than other types
on offer.
Links to Other Reports
You can display the Product Detail Report for a specific product by doubleclicking the product picture.
27
28

Complex City Economy
Capitalism II offers the player with an optional economic simulation mode
called “Complex City Economy” which provides the player the challenges of
operating a business in a highly dynamic economy. Complex City Economy
can be enabled or disabled in the Custom Game Setup screen’s Environment
tab.
With Complex City Economy enabled, the first thing you notice is the displays
of the following economic indicators in the mini-map window.
Spending Level indicates the ability and
willingness of consumers to spend. A more
developed city will have a higher Spending Level
than a less developed one. It is also affected by
the city’s economic climate, which is described
below.
The demands of all products are affected by a
city’s Spending Levelat different degrees.
Products with a high necessity index (e.g.
toothpaste) are less affected by Spending Level
than those with a low necessity index (e.g. cars.)
A product’s necessity indexcan be seen in the
Product Detail Report.
Salary Level indicates the labor cost of the city. One good way to increase
profitability is to set up production in areas of low labor cost, while exporting
to cities with a more wealthy consumer base. Salary Level is also affected
by the city’s economic climate.
Business startups will help stimulate a city’s economy and improve its
economic climate. Conversely, closures of businesses will negatively affect
a city’s economy and excessive business closures may drag a city into a
recession. As such, if you invest aggressively in a city by building new firms,
the positive effect it brings to the economy may in turn benefit all of your
businesses in the city.
Economic Climate can be Boom, Prosperous, Normal, Recession or Panic. A
city with a booming economy benefits all business activities with higher
consumer demands (indicated by Spending Level). On the other hand, labor
cost also tends to increase in the midst of a booming economy, thus
increasing the cost of operating a business (indicated by Salary Level).
You should pay close attention to these economic indicators, which all vary
from city to city and over time, when selecting a city in which to build a new
firm. In a city in recession, businesses suffer. Building a large department
store in a city with a panic economy is a recipe for financial losses and
failure. To avoid this, you must keep a watchful eye on these economic
indicators.
29
30
Chapter 4: Firms, Units & Buildings
A firm is any building that a corporation can operate, such as a retail store
or a factory. Buildings are controlled by civilians (houses, stadiums and the
like) or by the city government (such as the stock market).
Usually a firm is built and operated by the same corporation, but there
are exceptions. Radio and TV stations, and Newspaper Publishers begin the
game under the city’s control. Corporations may buy these firms
and subsequently sell them. Construction of a firm not only includes the cost
of the actual structure, but a land value cost. The land value is determined
by several factors, but the general rule is that construction
on empty land will be cheaper than having to purchase occupied land.
Within each firm, specialized units may be built. Several units are
common amongst different types of firms whilst some are firm specific. All
units are placed within the Layout section of a firm. This is a 3 x 3
grid containing 9 slots. Each slot can accommodate one unit. Units may be
linked to other units to provide functional groups. For example, if you
connect a Manufacturing unit to a Sales unit you will be able to sell
what you produce.
You may find you need to use the same layout in more than one firm.
See Chapter 5, Reports and Guides, for information on using the Layout
Library. The common units are discussed below whilst the more specialized
units are discussed within the relevant firm text.
A firm may be available in different sizes, such as small, medium and large
factories. The general rule is that for each increase in size there is a
corresponding increase in the production capacity of the firm. However, the
firm will cost more to build and maintain than a smaller version. The size of
retail stores, mines, oil wells and logging camps are predetermined, but
farms, factories, apartment and commercial buildings offer different sizes
from which to choose.
An advertising unit in a firm is responsible for contacting the media
(television and radio stations and newspaper publishers) and arranging
advertising. The following sections describe the unit’s basic operation. For
an in-depth discussion of advertising, see Advertising on page 89.
Advertising a Product
To advertise a product, do the following:
1. Link the advertising unit to a unit with a product. If you link to a sales unit,
the advertising unit will advertise the product sold by the sales unit.
2. Press the Link Media Firm button to select a media firm (a television
station, a radio station or a newspaper publisher) in which to advertise the
product. Choose a media firm and press the Link button.
3. Set the monthly advertising expense per product by clicking on the
Monthly Expense slider. A higher advertising budget means your
advertisement is broadcast more frequently, which increases public
awareness about your product more rapidly.
Unit Details
When an active advertising unit is highlighted, the unit detail area shows the
following information.
Common units
Advertising Unit
The information shown in the advertising unit detail box is shown below:
• Monthly Spending Per Product. The amount spent advertising
a product each month.
• Advertising cost (CPM). The cost to expose 1,000 members
of a target audience to an advertising message.
• Rating Points. This measurement indicates the portion of potential
audiences that receive messages from a specific media outlet. One
rating point is equivalent to one percent of the potential audience
that receives messages from a specific media outlet. It is calculated
by dividing the reach by the coverage.
Set up in Retail store, factory, farm,
Setup cost $5,000
Workers needed 1
31
32
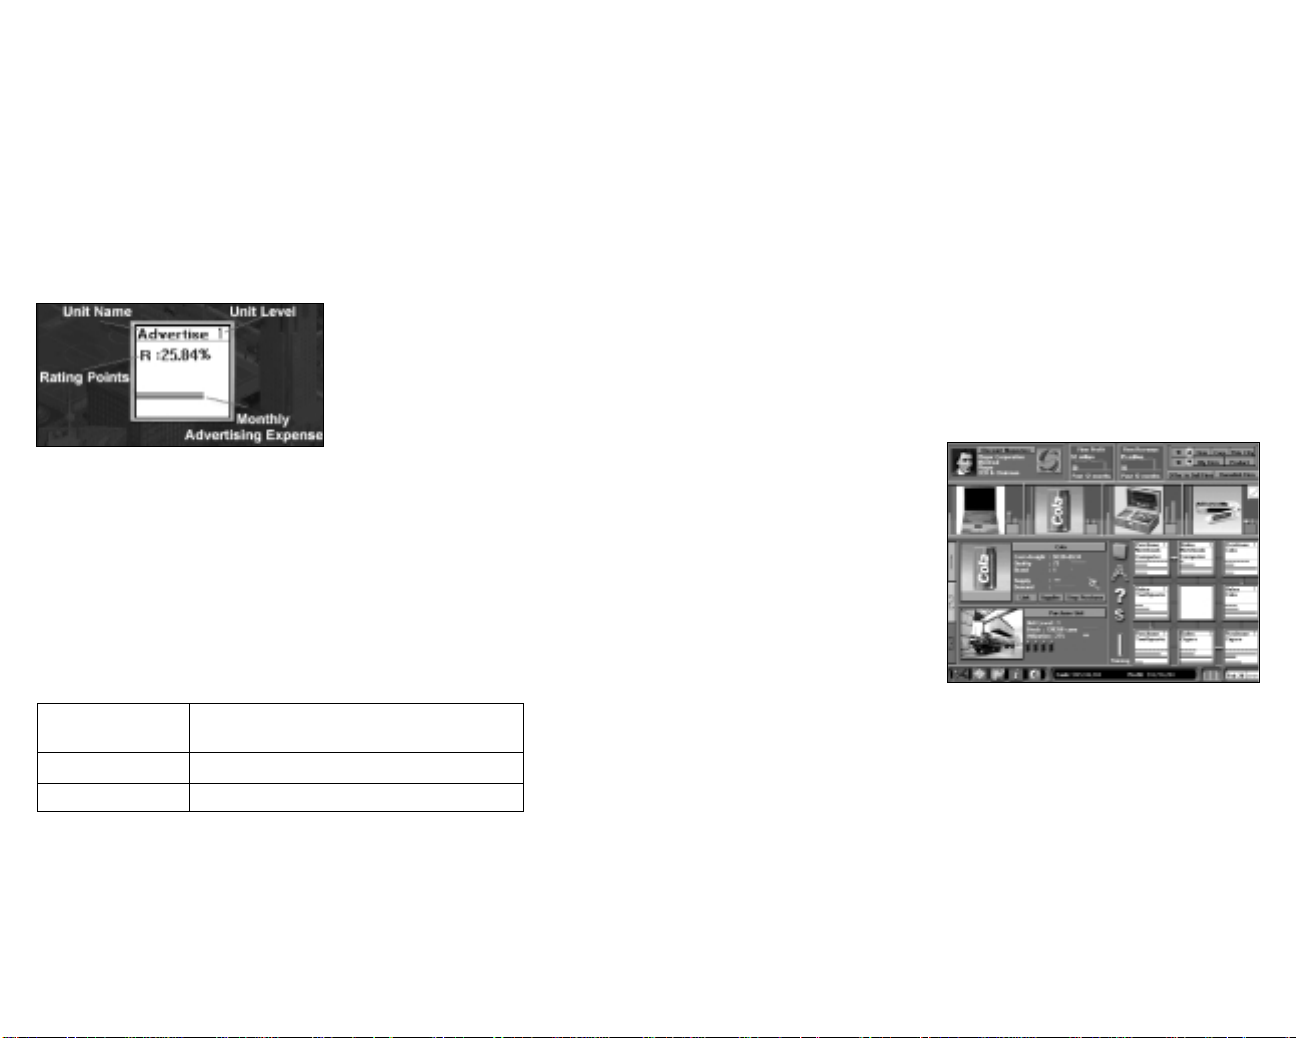
In this example, the unit is linked to the local radio station. It can be seen
that the advertising cost per thousand (CPM) for this particular station
is $2.28 and the station enjoys Rating Points of 36.23%. The greater this
figure, the greater the population reach the advertising campaign has. The
gray slide bar can be manipulated to change the monthly spending per
product and will affect the advertising campaign, helping to raise brand
awareness of your products. Setting the bar (click and hold the left mouse
button and drag the red slider to set the value) all the way to the right will
saturate the city with advertising. This may have a negative effect on brand
loyalty if you cannot satisfy the increase in demand.
Unit Info
The info-box of the Advertising Unit
in the layout area shows the
following information:
Why Retain Inventories?
There are two major operational reasons why companies retain inventories:
anticipation and buffer.
Anticipation inventories
Anticipation inventories are held because you expect a future increase
in demand. Rather than operate at peak capacity during one period and
then shut down in a subsequent period, anticipation inventories can
accumulate before a period of peak demand.
Buffer inventories
Buffer inventories protect against unexpected surges in demand. Any
inventory held over and above the average demand requirement is
considered buffer inventory. High buffer inventories allow companies to
continue to serve customers through unexpected increases in demand.
Ratings Point – Explained above.
Monthly Advertising Expense –
Explained above.
Unit Level
Since the function of an advertising unit is to contact media outlets and
arrange advertising, the unit’s experience does not affect the outcome
of the advertising. Therefore, unlike most other units, the unit level of an
advertising unit does not increase over time. However, your corporation may
hire a Chief Marketing Officer whose expertise will improve the efficiency of
your corporation’s advertising units without increasing their level. See
Headquarters later in this chapter for further guidance.
Inventory Unit
Set up in Retail store, farm, factory, mine, oil well
and logging camp
Setup cost $50,000
Workers needed 1
Inventory units provide storage for large quantities of raw materials or
finished goods.
Although most firms can operate without an inventory unit, it supports
smooth operations for the whole firm. The inventory unit’s capacity is several
times greater than other units and operating costs are several times smaller.
The discussion that follows describes the Inventory Unit in detail.
Unit Details
When an inventory unit is highlighted, the unit detail area shows the
following information:
Cost+Freight. The product cost
and the freight cost.
Quality. The product’s quality
rating.
Brand. The product’s brand
rating.
Unit Level. The experience level
of the unit
Stock. The quantity of the product stocked in the unit. Each cargo unit can
store a certain number of product units. The number of units a cargo unit
can hold varies. For some expensive products, such as automobiles, one
cargo holds only a few units. For lower-cost products, such as shampoo, one
cargo unit holds several thousand units. The value of each cargo unit is
about the same.
Utilization. The unit’s level of productivity.
Staff. Staff number represented by the figure icon.
NOTE: The color bar under the product picture shows the corporate color of the brand owner of
the unit’s products.
33
34
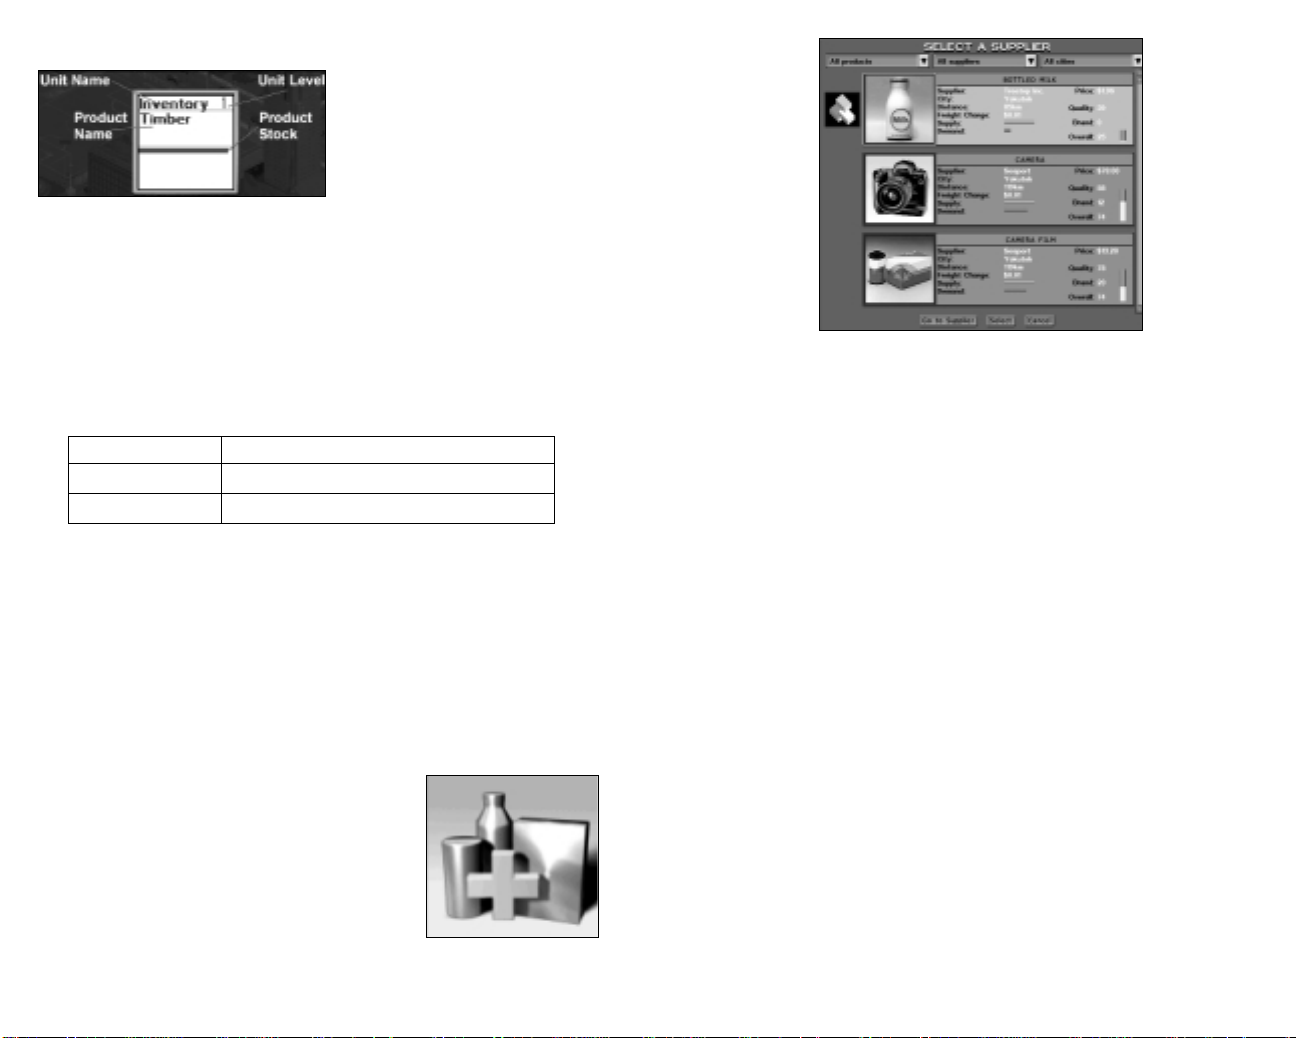
Unit Info
The info-box of the Inventory Unit in
the layout area shows the following
information
Product Name. The name of the
product in the inventory.
Product Stock. Explained above.
Unit Level
Because an inventory unit provides a place for storing goods, the unit’s
experience does not affect the productivity of the business. Therefore, unlike
most other units, the unit level of an inventory unit does not increase over
time.
Purchasing Unit
Set up in Retail store, farm or factory
Setup cost $50,000
Workers needed 2 or 4 (in medium to large firms)
A purchasing unit buys products from suppliers. These units are essential for
retail stores, farms and factories. The following sections describe the basic
operations and displays of the purchasing unit.
Purchasing a Product
Once you tell the purchasing unit which product you want to purchase, it
purchases the product until the supply is no longer available.
To give the purchase unit an order, select the purchasing unit. Press the Link
Supplier button and the supplier screen appears.
Alternatively, if you do not currently have any
Purchasing units in store you may click the Add
Product button and a new Purchasing unit will be
added to your store (along with a linked Sales unit).
The Select A Supplier screen will automatically
open. Remember that the Add Product button will
only be visible if there is sufficient layout space for
setting up an additional pair of purchasing and
sales units.
Now, select the product you want to purchase from a supplier by:
• Scrolling the main list until you see the product you want, or
• Use the filter lists, All Products, All Suppliers and All Cities, to refine
your search. You may, for example select your corporation from the All
Suppliers list in order to select a product that you are producing.
Please note that clicking Go To Supplier will take you to that particular
factory or seaport. Click the back button on the toolbar to return to your
retail store.
You can see from the picture above that each product entry carries specific
details. The owning corporation’s logo (if any) is displayed to the left of the
product picture and the corporation name is displayed in the detail box. If
the product is imported, the detail box will show ‘Seaport’ and a logo will be
absent. Next, the city housing the supply and the distance to the supplier is
given. Remember that importing from another city will carry additional freight
costs. The actual freight cost of transporting the product from the supplier’s
location to the current firm’s location is also shown. The product cost,
quality, brand and overall rating are displayed, allowing you to make
comparisons if several suppliers offer the same product type. Finally, the
current levels of supply and demand for the product are shown. Once you
have found a product you wish to purchase, left click the detail box and
press the Select button to start the purchasing process.
Stopping a Product Purchase
After a purchase linkage is established, the Stop Purchase button appears.
Press this button to stop the current purchase.
35
36
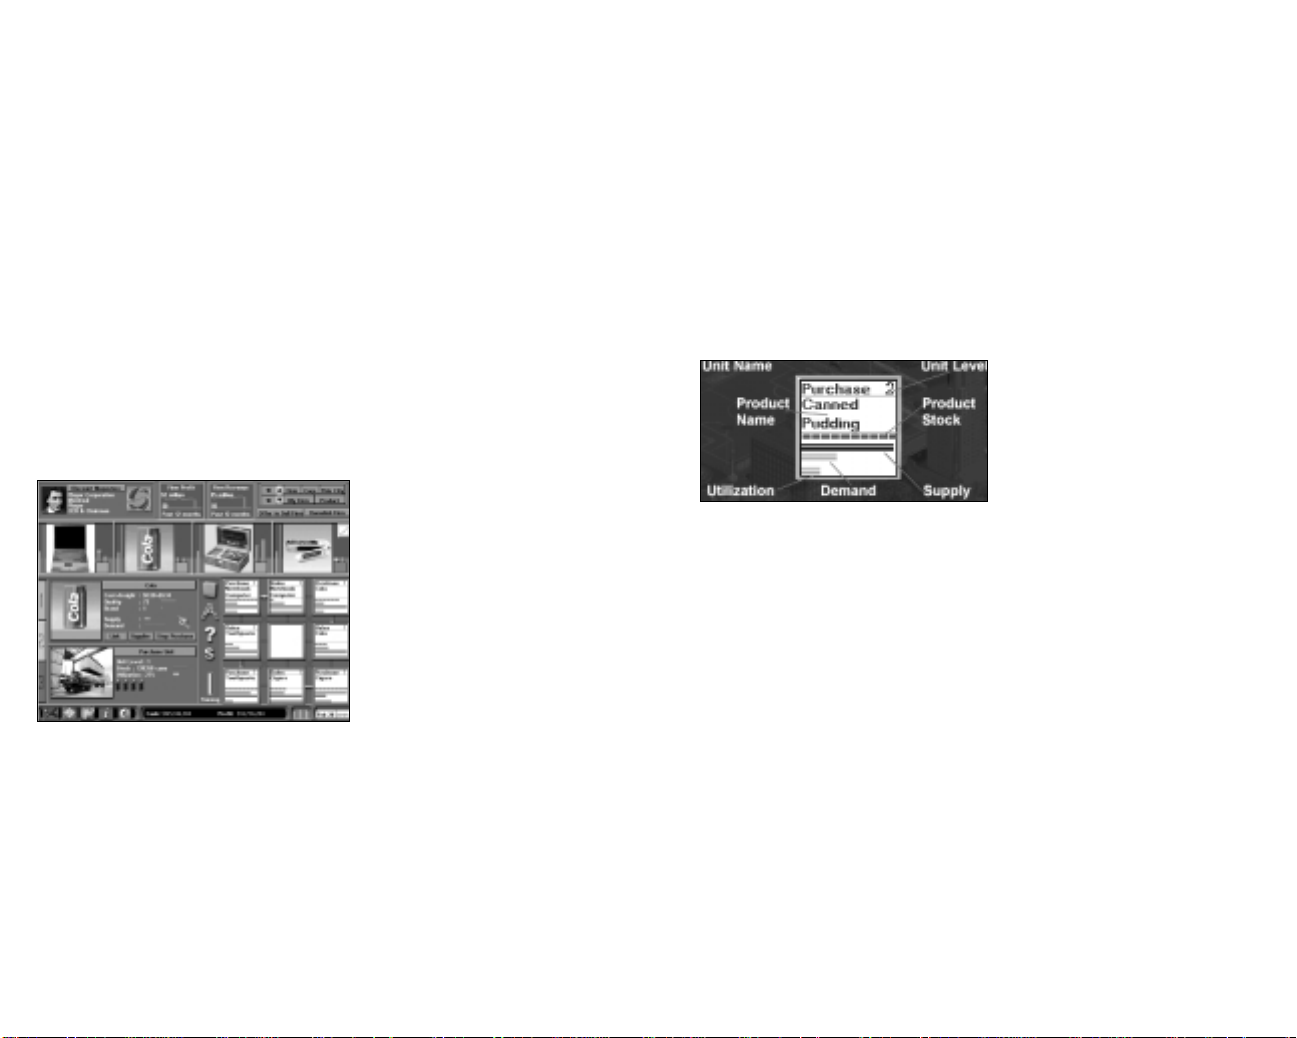
Changing the Current Supply
To switch to a new supplier, press the Link button and select the product that
you want to purchase. This is the fastest way to change the current supply,
because the newly selected product is purchased immediately. You will,
however, incur a loss, because the stock of the old product in the purchasing
unit is discarded.
To avoid this loss, stop the purchase of the current product by pressing the
Stop Purchase button and wait until its stock is cleared to the sales unit or
manufacturing unit. Then, link the purchasing unit to the new supplier.
Locating the Supplier of a Purchasing Unit
You can click the “Supplier” button to display the details of the supplier. You
may then click “Go to Supplier” button on the detail popup box to go to the
supplier firm.
Unit Details
When you highlight an active Purchasing Unit, the unit detail area shows the
following information:
Cost+Freight. The cost of the
product and the freight cost.
Quality. The quality rating of the
product.
Brand. The overall brand rating.
This is the sum of the brand
awareness rating and the brand
loyalty rating.
Supply and Demand. The supply
bar is blue and indicates the
product supply from the supplier.
The demand bar is red and indicates the product demand from the
current firm. If the supply bar is shorter than the demand bar, there is a
supply shortage. Overall firm performance may be affected by the
shortage and you should consider switching to a better supplier.
Unit level. The experience level of the unit
Stock. This area shows the stock of the product in the unit. Each cargo
unit can store a certain number of product units. The number of units a
cargo unit can hold varies. For some expensive products, such as
automobiles, one cargo holds only a few units. For lower-cost products,
such as shampoo, one cargo unit holds several thousand units. The
value of each cargo unit is about the same.
Utilization. The brown bar shows the unit’s utilization. If this bar
reaches its full length, the unit is at full capacity. No more goods can be
purchased, even if there is additional supply and demand. Conversely, if
the unit is underutilized, its facilities and resources are not being used
effectively.
Staff. Staff number represented by the figure icon
The color bar under the product picture indicates the brand owner’s
corporate color.
Unit Info
The info-box of the Purchasing Unit
in the layout area shows the
following information:
Product Name. The product the unit
is currently purchasing.
Product Stock. This area shows the
stock of the product in the unit. Each cargo unit can store a certain number
of product units. The number of units a cargo unit can hold varies. For some
expensive products, such as automobiles, one cargo holds only a few units.
For lower-cost products, such as shampoo, one cargo unit holds several
thousand units. The value of each cargo unit is about the same.
Supply and Demand. The blue bar indicates the supply of the product by
supplier. The red bar indicates the demand for the product from the current
firm. If the supply bar is shorter than the demand bar, there is a lack of
supply. Firm performance may be affected by supply problems, so keep a
close watch on your suppliers.
Utilization. The orange bar shows the unit’s utilization. If this bar reaches its
full length, the unit is at full capacity. No more goods can be manufactured,
even if there is additional supply and demand. Conversely, if the unit is
underutilized, its facilities and resources are not being used effectively.
37
38
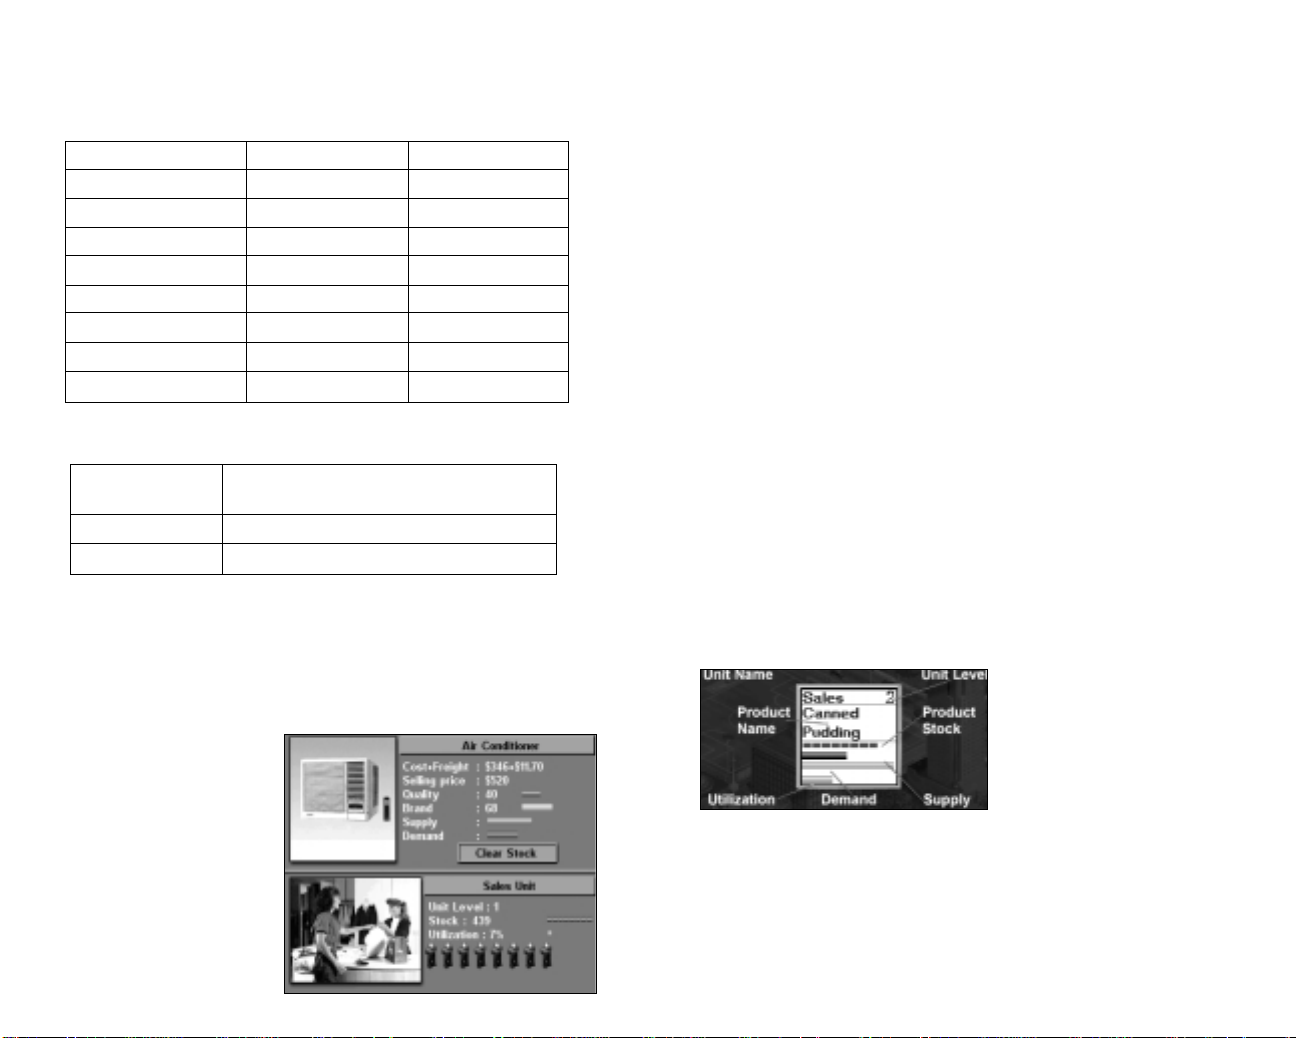
Unit Level
The productivity and capacity of a purchasing unit increases when its unit
level increases. The following table shows this relationship.
Unit Level Productivity Capacity
1 100% 100%
2 130% 125%
3 160% 175%
4 200% 200%
5 250% 250%
6 300% 300%
7 360% 375%
8 430% 437%
9 500% 500%
Sales Unit
Set up in Retail store, farm, factory, mine, oil well
and logging camp
Setup cost $100,000
Workers needed 4 or 8 (in medium to large firms)
A sales unit is responsible for selling products to customers. Since sales
units are the only units in a firm that generate income directly, you find them
in almost every type of firm that produces goods. In the following section,
the basic operations and displays of this unit are introduced.
Unit Details
When you highlight an active
Sales Unit, the unit detail area
shows the following
information:
Cost+Freight. The cost of
the product plus the freight
cost.
Selling Price. The cost of
the product to the
customer.
Quality. The quality rating of the product.
Brand. The overall brand rating. This is the sum of the brand awareness
rating and the brand loyalty rating.
Supply and Demand. The blue bar indicates the supply of the product
from the current firm. The red bar indicates the demand for the product
from the buyers. If the supply bar is shorter than the demand bar, there
is a lack of supply. Firm performance may be affected by supply
problems so keep a close watch on your suppliers.
Unit level. The experience level of the unit
Stock. This area shows the stock of the product in the unit. Each cargo
unit can store a certain number of product units. The number of units a
cargo unit can hold varies. For some expensive products, such as
automobiles, one cargo holds only a few units. For lower-cost products,
such as shampoo, one cargo unit holds several thousand units. The
value of each cargo unit is about the same.
Utilization. The orange bar shows the unit’s utilization. If this bar
reaches its full length, the unit is at full capacity. No more goods can be
manufactured, even if there is additional supply and demand.
Conversely, if the unit is underutilized, its facilities and resources are
not being used effectively. This could contribute to low profitability of
the firm.
Staff. Staff number represented by the figure icon
NOTE: The color bar under the product picture represents the corporate color of the product’s
brand owner.
Unit Info
The info-box of the Sales Unit in the
layout area shows the following
information:
Product Name. The product the unit
is currently selling.
Product Stock. Explained above.
Supply and Demand. Explained above.
Utilization. Explained above.
39
40
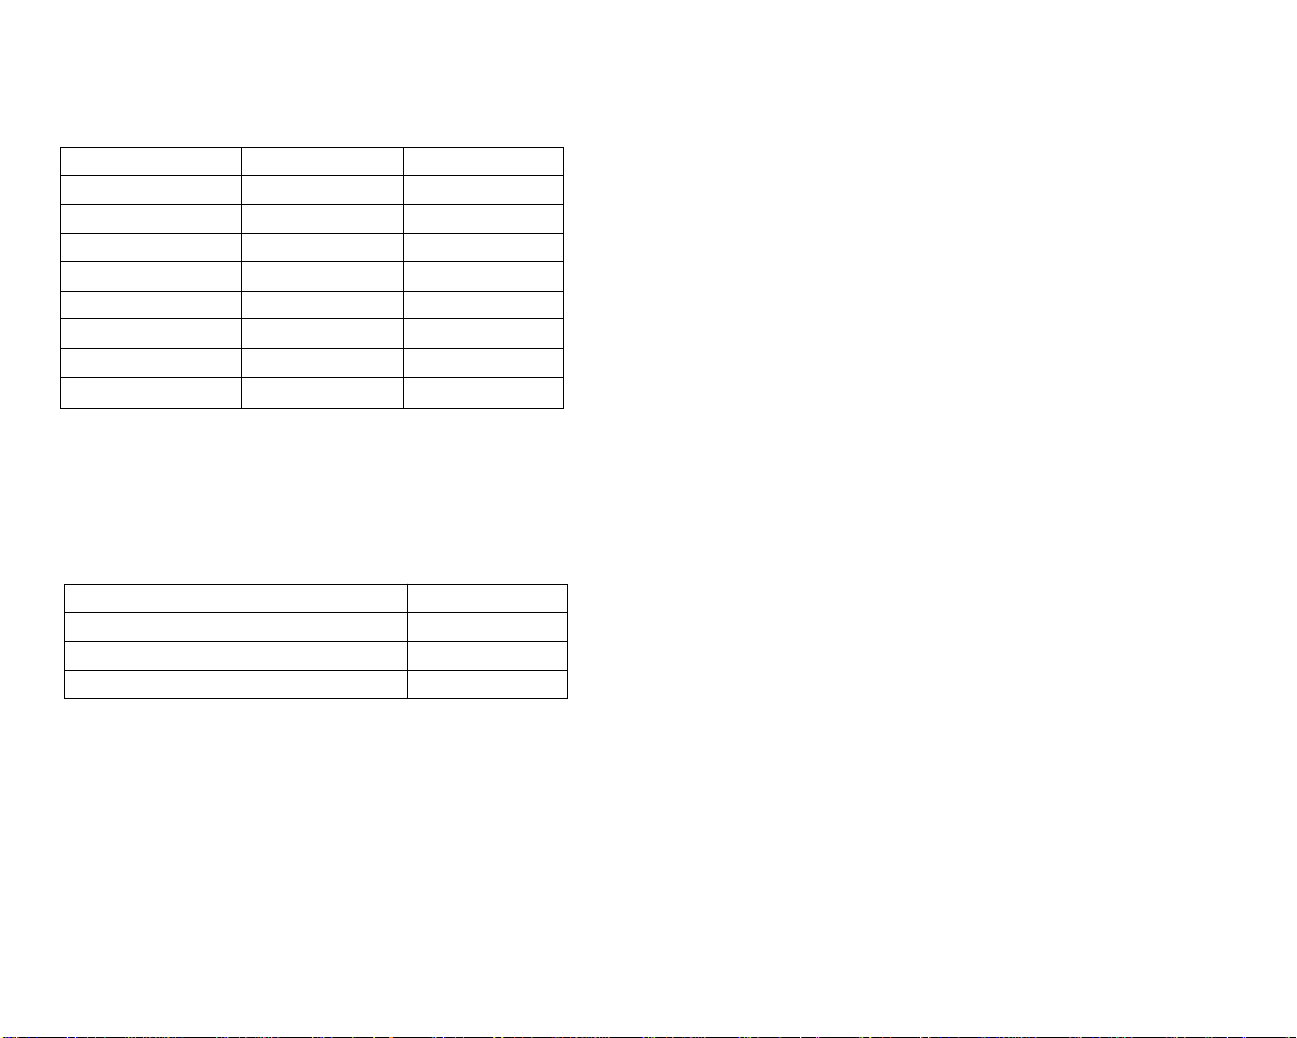
Unit Level
The productivity and capacity of a sales unit increases when its unit level
increases. The following table shows this relationship.
the scheduling among functional units. To increase the supply, trace the
chain of supply, examine all linked units carefully, and remove any
bottlenecks you find.
Unit Level Productivity Capacity
1 100% 100%
2 130% 125%
3 160% 175%
4 200% 200%
5 250% 250%
6 300% 300%
7 360% 375%
8 430% 437%
9 500% 500%
Bottleneck Diagnosis
Because sales units are the only units in a firm that generate sales revenue
directly, inspecting them frequently and removing any bottlenecks usually
increases the profitability of the whole firm. Refer to the following table to
identify common bottlenecks:
Supply and Demand Utilization Bottleneck
Supply < demand, utilization = 100 Capacity is peak
Supply > demand, utilization = 100 Capacity is peak
Supply < demand, utilization < 100 Insufficient supply
Supply > demand, utilization < 100 Low demand
Here are some suggested solutions:
Capacity is peak. When the capacity of the sales unit is at its peak, you can
resolve this bottleneck in two ways. The first way is to set up an additional
sales unit to share the workload. However, due to the limitations of layout
space, you cannot do so in every case. The second way is to increase the
spending on training and new equipment, which lets the unit improve its unit
level and productivity faster.
Insufficient Supply. Sometimes, the cause of the problem is not obvious. It
can be caused by a shortage in the product supply, capacity limitation of a
purchasing or manufacturing unit, or improper linkage of units, which affects
41
Low Demand. There are many ways to increase demand, but all have costs.
For a department store, increasing the frequency of the advertising can be
an adequate short-term decision. The real driving forces of demand are
price, quality, and brand; however, you should also allocate more of your
budget to research and development and plan strategically to decrease the
cost of your products. A long-term strategy will win out over a short-term
one, if you plan ahead.
Firms
Retail Stores
To choose an appropriate location for a retail store, you must consider the
following factors.
• Strength of competitors in the city. First, you should know which
products you plan to sell. It is wise to build your retail store in a city
section with comparatively weak competitors.
• Population of the city. The population of the city directly affects the
total demand for the goods your retail store offers.
• Land cost. The land cost can vary greatly. Land in urban areas is
always much more expensive than in rural areas. Similarly, land near
the center of the city is more expensive than land farther away from the
city center. Despite these costs, it makes sense to build a retail store
near the city because this ensures a larger flow of customers.
• Transportation cost of goods from suppliers.You have to estimate the
cost of transporting goods from the suppliers to your retail store. For
goods with a high ratio of weight to value, try to open your retail store
in a section of the city not too far away from the suppliers. Otherwise,
the cost of transportation could severely affect your firm’s profitability.
• Availability of building site near the city center. Finally, the
availability of a building site near the city center is an important
criterion. The flow of customers reaches its maximum in the city center
and decreases toward the city border. If your competitors already
occupy most spaces in the city center, you will have to set up your
retail store in a less advantageous location and you will be at a
disadvantage from the very start.
42
You can set up the following units in a retail store:
• Purchasing Unit
• Inventory Unit
• Private Labeling
• Sales Unit
• Advertising Unit
Purchase units and sale units are typically the most common in retail stores.
With one unit of each type, you can form a simple purchasing-sales team.
You can also set up:
• An inventory unit to stock goods and provide the retail store with
merchandise when a fluctuation of supply or demand might otherwise
leave the store without sufficient stock.
• An advertising unit to arrange advertising of your products on TV and
Radio stations or local newspapers.
• A private labeling unit to convert products made under another brand
to your own brand. The private labeling unit is detailed below.
The following table depicts the retail stores types available to build if you
have chosen ‘many’ in the game settings. If you chose ‘one’ store type you
will only be able to build Discount Megastores. Each store has a setup cost
(for construction) and a monthly operations charge.
Retail Store Type Setup Cost Monthly Cost
Discount Megastore $1,800,000 $180,000
Department Store $1,000,000 $100,000
Supermarket $1,000,000 $100,000
Convenience Store $500,000 $50,000
Drug Store $500,000 $50,000
Apparel Store $500,000 $50,000
Automobile Outlet $1,000,000 $100,000
Hardware Store $1,000,000 $100,000
Footwear Store $500,000 $50,000
Jewelry & Watch Store $500,000 $50,000
Leather Store $500,000 $50,000
Computer Store $500,000 $50,000
Cosmetic Store $500,000 $50,000
Furniture Store $1,000,000 $100,000
Sports Store $500,000 $50,000
Toy Store $500,000 $50,000
Some stores are specialty stores and can only sell certain items. For example,
a furniture store can only sell beds, chairs and sofas. Because it specializes,
speciality stores will enjoy greater demand for its products than, say, an
adjacent department store that may also stock the same goods. The main
disadvantage of the specialist store is that if demand decreases or supply is
interrupted, it is difficult or impossible to stock substitute goods. Whereas the
potential range of goods available to a department store cushions the impact
of any down turn in trade by allowing the firm to switch to alternate goods.
43
A full listing of items available to sell in each store can be found at Appendix A.
Private Labeling Unit
Set up in Department store or factory
Setup cost $100,000
Workers needed 3
A private labeling unit converts products of other brands to your own brand
by labeling the product with your own corporate insignia. If you are tired of
manufacturing products yourself, you can label products of a less popular
brand with your own brand. This saves you the trouble of managing
production lines and lets you concentrate on marketing.
44
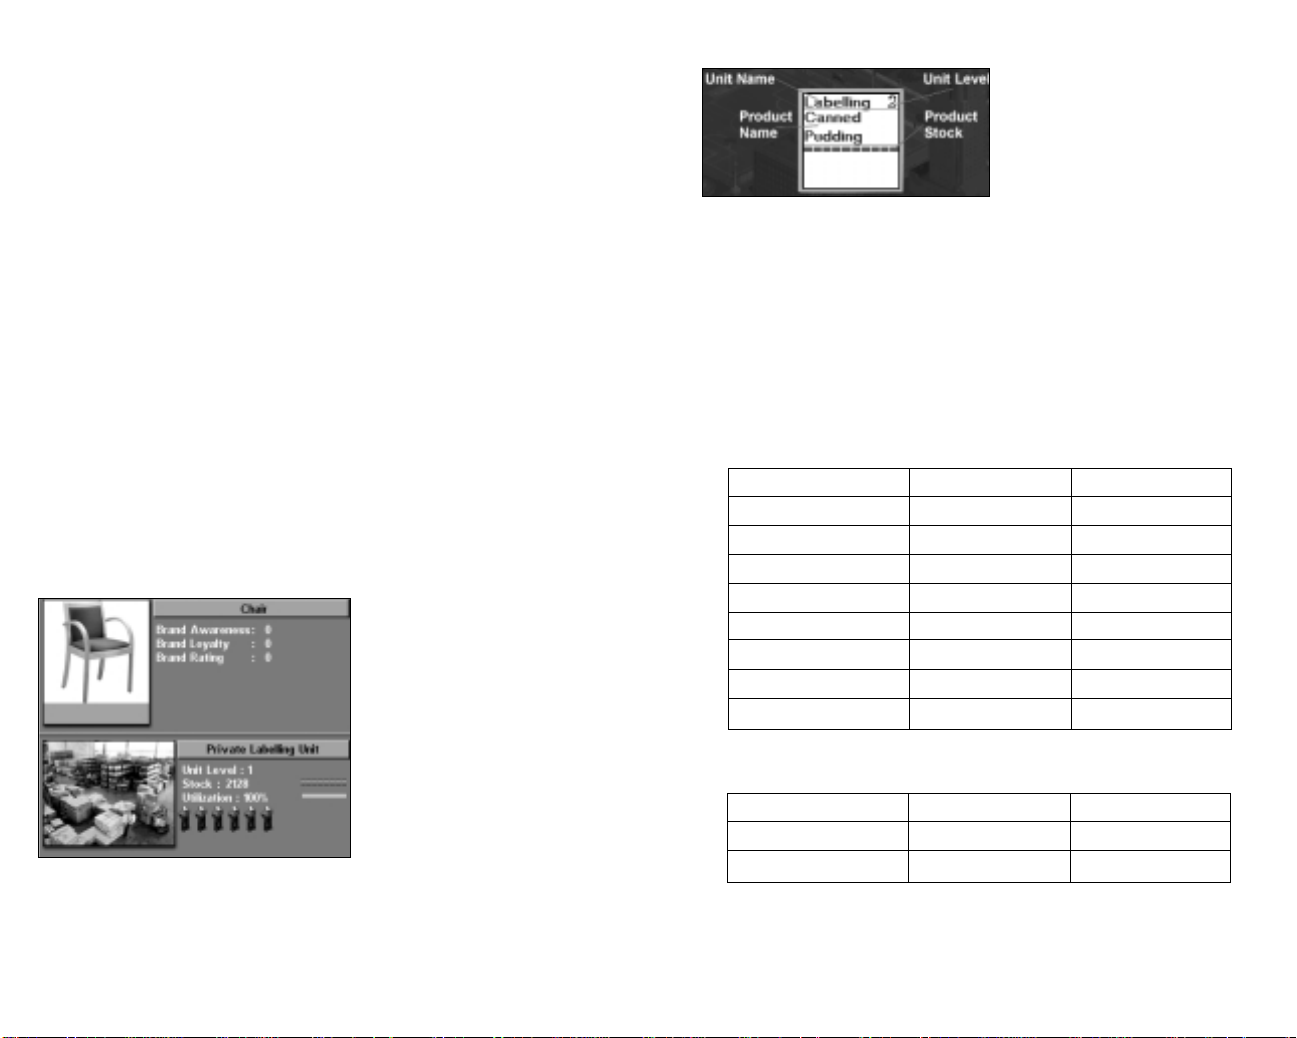
When to Private Label Products
Private labeling is a reasonable choice if your corporation is pursuing a
corporate or range brand strategy. In this case, the private-labeled goods
can be sheltered under the retailer’s brand and receive the immediate
benefit of a well-established brand.
Although it seems that private labeling could put additional brand value into
a product effortlessly, this tactic should be used with extreme caution. If the
quality of the private-labeled product is inferior to those of the existing
products in the brand family, it will damage the entire brand. Furthermore,
since external suppliers manufacture the products, it is very difficult to
assure that their quality will always meet your corporation’s quality
standard.
Private Labeling Products
Any products directed into the private-labeling unit are relabeled
immediately. Usually linking a private labeling unit between a purchasing
unit and a sale unit is the easiest way to label the products from another
corporation. In this arrangement of units, the purchased goods from another
company are labeled with your brand and resold as if you had produced
them yourself.
Unit Details
When you highlight an active Private Labeling Unit, the unit detail area
shows the following information:
Brand Awareness. The brand
awareness rating of the privatelabeled goods.
Brand Loyalty. The brand loyalty
rating of the private-labeled
goods.
Brand Rating. The overall brand
rating. This is the sum of the
brand awareness rating and the
brand loyalty rating.
Unit level. The experience level
of the unit
Stock. The quantity of the product stocked in the unit.
Utilization. The unit’s level of productivity.
Staff. Staff number represented by the figure icon.
45
Unit Info
The info-box of the Private Labeling
Unit in the layout area shows the
following information.
Product Name. The product being
processed.
Product Stock. This area shows the stock of the product in the unit. Each
cargo unit can store a certain number of product units. The number of units
a cargo unit can hold varies. For some expensive products, such as
automobiles, one cargo holds only a few units. For lower-cost products,
such as shampoo, one cargo unit holds several thousand units. The value of
each cargo unit is about the same.
Unit Level
The productivity and capacity of a private-labeling unit increases when its
unit level increases. The table below shows this relationship.
Unit Level Productivity Capacity
1 100% 100%
2 130% 125%
3 160% 175%
4 200% 200%
5 250% 250%
6 300% 300%
7 360% 375%
8 430% 437%
9 500% 500%
Factory
Factory Size Setup Cost Monthly Cost
Small $750,000 $50,000
Medium $1,500,000 $100,000
Large $2,500,000 $180,000
The types of units in a factory include:
• Purchasing Unit • Sales Unit • Inventory Unit
• Advertising Unit • Private Labeling Unit • Manufacturing
46
 Loading...